We’re still in China for our factory and lab tours, but we managed to coordinate with home base to get enough testing on the GTX 1660 done that a review became possible. Patrick ran the tests this time, then we just put the charts and script together from Dongguan, China.
This is a partner launch, so no NVIDIA direct sampling was done and, to our knowledge, no Founders Edition board will exist. Reference PCBs will exist, as always, but partners have control over most of the cooler design for this launch.
Our review will look at the EVGA GTX 1660 dual-fan model, which has an MSRP of $250 and lands $30 cheaper than the baseline GTX 1660 Ti pricing. The cheapest GTX 1660s will sell for about $220, but our $250 unit today has a higher power target allowance for overclocking and a better cooler. The higher power target is the most interesting, as overclocking performance can stretch upwards toward a GTX 1660 Ti at the $280 price-point.
We’ll get straight to the review today. Our focus will be on games, with some additional thermal and power tests toward the end. Again, as a reminder, we’re doing this remotely, so we don’t have as many non-gaming charts as normally, but we still have a complete review.
GPU Test Bench (Sponsored by Corsair)
Component | Courtesy of | |
CPU | GamersNexus | |
GPU | This is what we’re testing! | Often the company that makes the card, but sometimes us (see article) |
Motherboard | ASUS | |
RAM | Corsair | |
PSU | Corsair | |
Cooler | NZXT | |
SSD | Plextor 256-M7VC | GamersNexus |
Apex Legends
Apex Legends is still new to our charts and not as heavily populated with cards as our later games. This one is important for its relevance, but also because it is built atop a modified Source engine with DirectX 11 as the API, giving us a title that represents performance on much of the games market. We retested the 1660 Ti in this game, but have not yet retested the other cards. Recent updates have improved performance on the 1660 Ti in Apex Legends. We also need to revisit the other cards once we’re home from China.
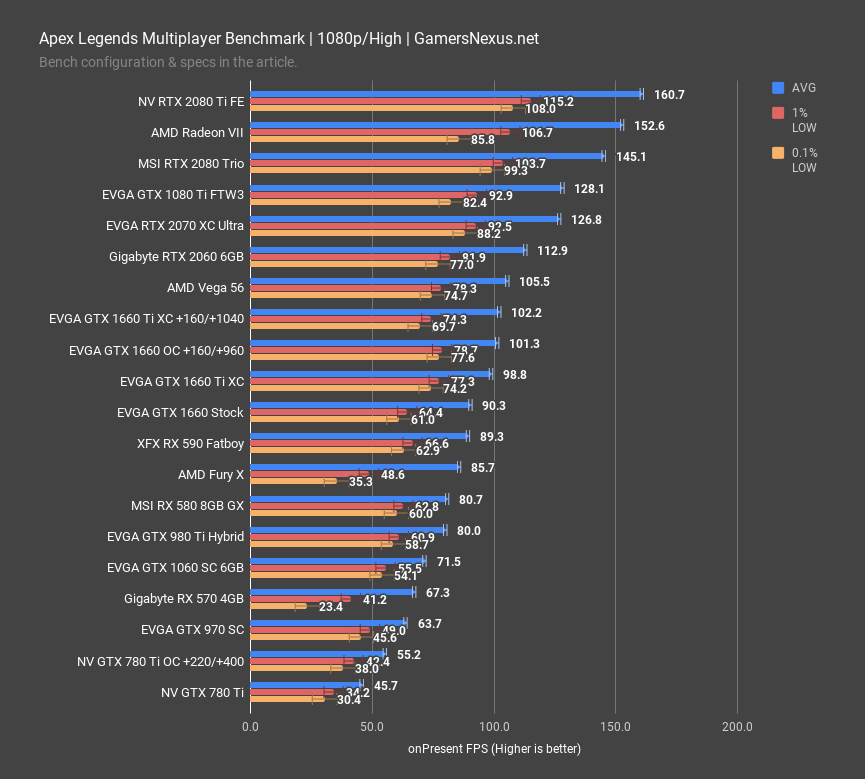
We’ll use our multiplayer test course that we detailed heavily in previous content, tested first at 1080p. This test placed the GTX 1660 at 90FPS AVG with High settings (everything set to “high”), or 101FPS AVG when overclocked. For reference, the 1660 Ti XC’s stock performance was about 99FPS AVG stock, or about 102FPS AVG when overclocked. We did not see much performance scaling with the 1660 Ti’s overclock in Apex Legends; at least, we didn’t see as much as we did before the 1660 Ti driver update with Apex Legends game-ready support. We tested this a total of 3 separate times, including full driver wipes, for validation, and confirmed this performance. We’ll look into this more when back from China, as we’d expect a wider OC gap (since there is a wider one at 1440p).
The 1660 was the closest to the 1660 Ti in Apex Legends, with most other games showing a 13-17% performance advantage stock-to-stock between the two. The RX Vega 56 card, for reference, ended up at about 106FPS AVG, with the RX 590 card at about 89FPS AVG.
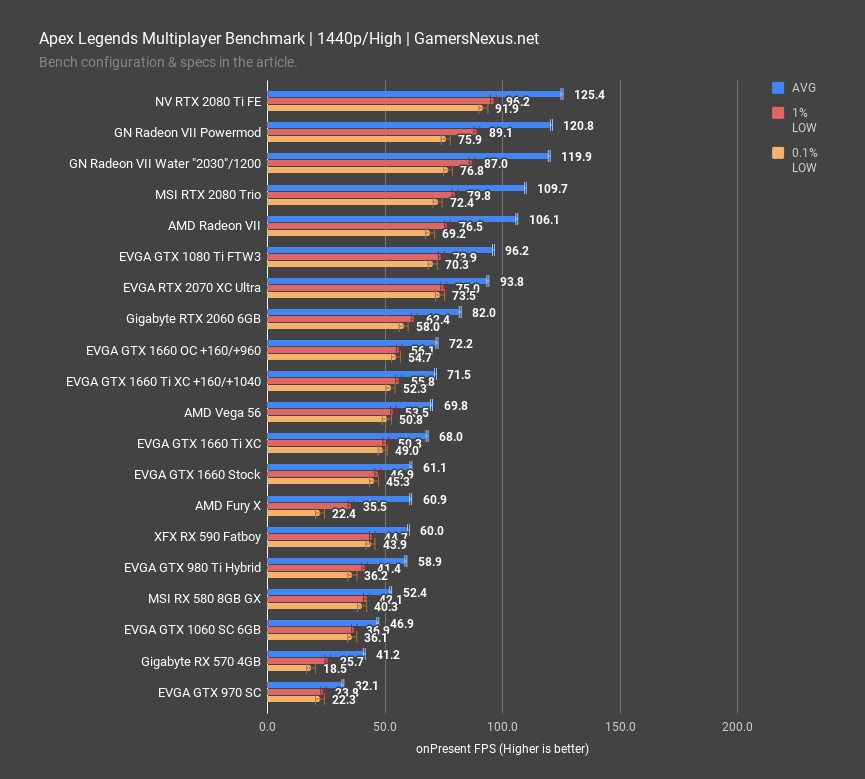
Tested at 1440p, the 1660 stock card still pulled about 61FPS AVG, although lows started dragging behind. Performance is reasonable and the game can be played at 1440p, it’s just that settings should be dropped slightly to better accommodate heavy combat areas and the initial drop-in. The 1660 Ti, for what it’s worth, was at about 68FPS AVG, posting a lead of around 11% over the 1660 non-Ti. Overclocking the 1660 got it to 72FPS AVG, which is where the 1660 Ti OC landed. The two are within margin of error.
Sniper Elite 4 Benchmarks
Sniper Elite 4 is still our best example of good DirectX 12 implementations. We test this one with both 1080p and 4K resolution, but please note that the 4K testing is meant to be treated as more of a synthetic representation of performance scaling from card-to-card. This is done because 4K gives us the full range of performance without CPU bottlenecks at the top-end of the stack, so we can compare all cards to each other even if over the performance capabilities of those cards.
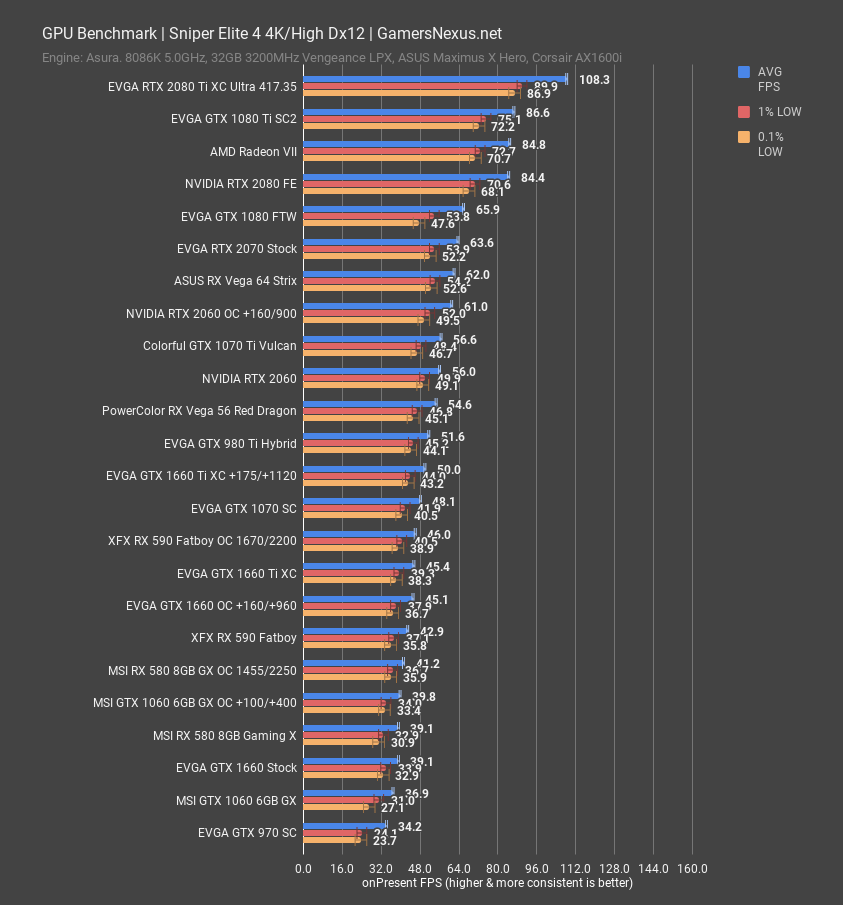
Starting with the more synthetic 4K workload, the GTX 1660 posted 39FPS AVG, with lows very close by at 34FPS 1% and 33FPS 0.1%. Comparatively, the GTX 1660 Ti XC under stock conditions posted 45FPS AVG, or a lead of about 16% over the GTX 1660. The 1660 is outperformed marginally by the RX 590, which held a lead of a few FPS AVG, and is not too dissimilar from the GTX 1060 6GB’s 37FPS AVG. Overclocking the 1660 to 160MHz offset got it to 45FPS AVG, matching the performance of the GTX 1660 Ti stock card, roughly matching the RX 590 Fatboy overclock results of 46FPS AVG, and allowing the 2060 stock card a lead of 24%.
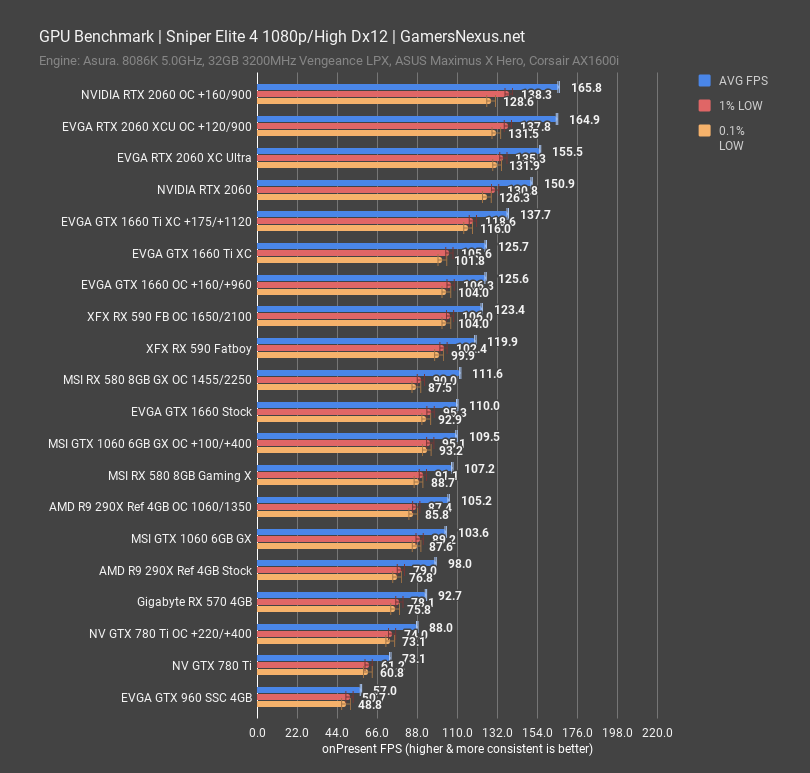
Moving on to 1080p testing, the GTX 1660 pushed 110FPS AVG stock, allowing the 1660 Ti XC card a lead of about 14%. The RX 590 Fatboy ended up at 120FPS AVG, pushing closer to the 1660 Ti than the 1660 in this title. Sniper is compute-intensive and allows AMD to leverage its architecture more than most other games do. Overclocking the 1660 got it to 126FPS AVG, marking it as equivalent to the stock GTX 1660 Ti XC and within margin of error. It also allowed the card to outperform the RX 590 overclock, but this is insignificant beyond declaring that the two can be made equal. The rough 2FPS difference can’t really be called observably better, but can certainly show a minimum of equal performance.
F1 2018
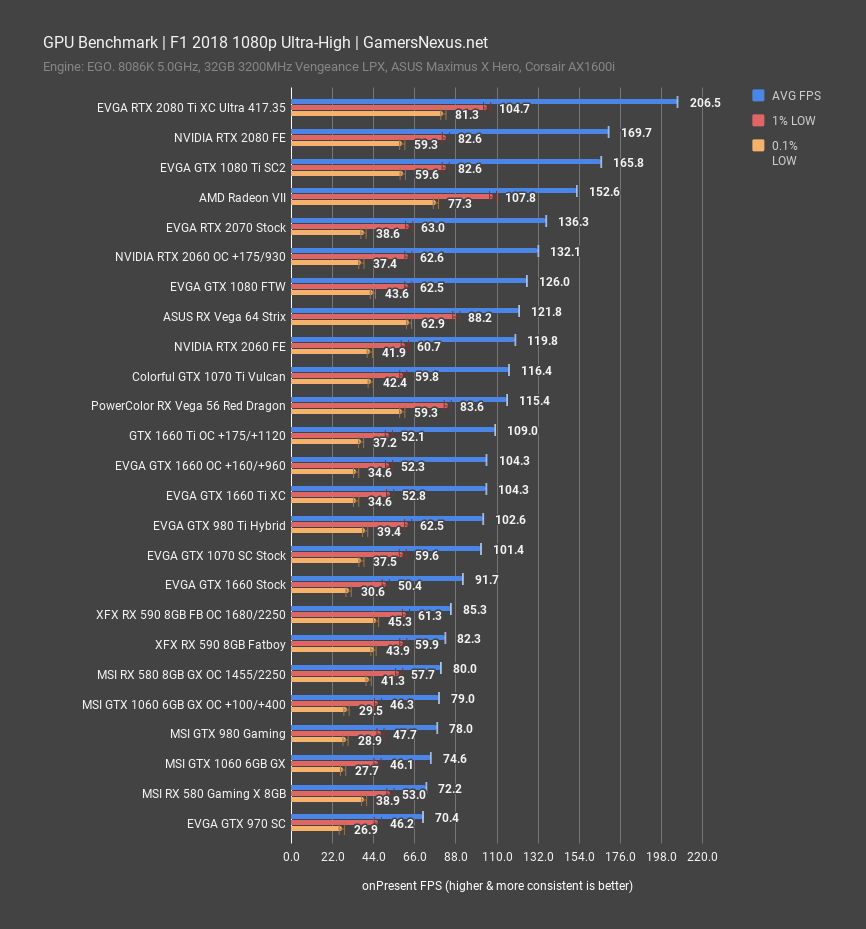
F1 2018 is next. For this one, tested first at 1080p, the GTX 1660 non-Ti ended up at 92FPS AVG, with lows at about 50FPS and 31FPS for 1% and 0.1% lows, respectively. That performance allowed the 1660 Ti XC a lead of about 13.7%. Overclocking the GTX 1660 to a 160MHz offset pushed it to 104.3FPS AVG, which is the exact same performance we got out of the 1660 Ti XC. Even the lows are roughly identical. Sure, overclocking the 1660 Ti gets it another 5FPS AVG, but at some level, it may be better to step down to the 1660 and settle for Ti baseline performance. If you wanted 1660 Ti stock performance, the 1660 could be purchased and overclocked for the same performance level. Vega 56 hit 115FPS AVG when stock, for reference, with the RX 590 8GB card at 82FPS AVG when stock. Vega 56 and the RX 590 ran tighter frametime consistency than NVIDIA does in this game, with Vega 56 advantaged to a point of low frametime performance averaging to about 60FPS 0.1%, whereas the 1660 Ti and 1660 both sit in the 30s.
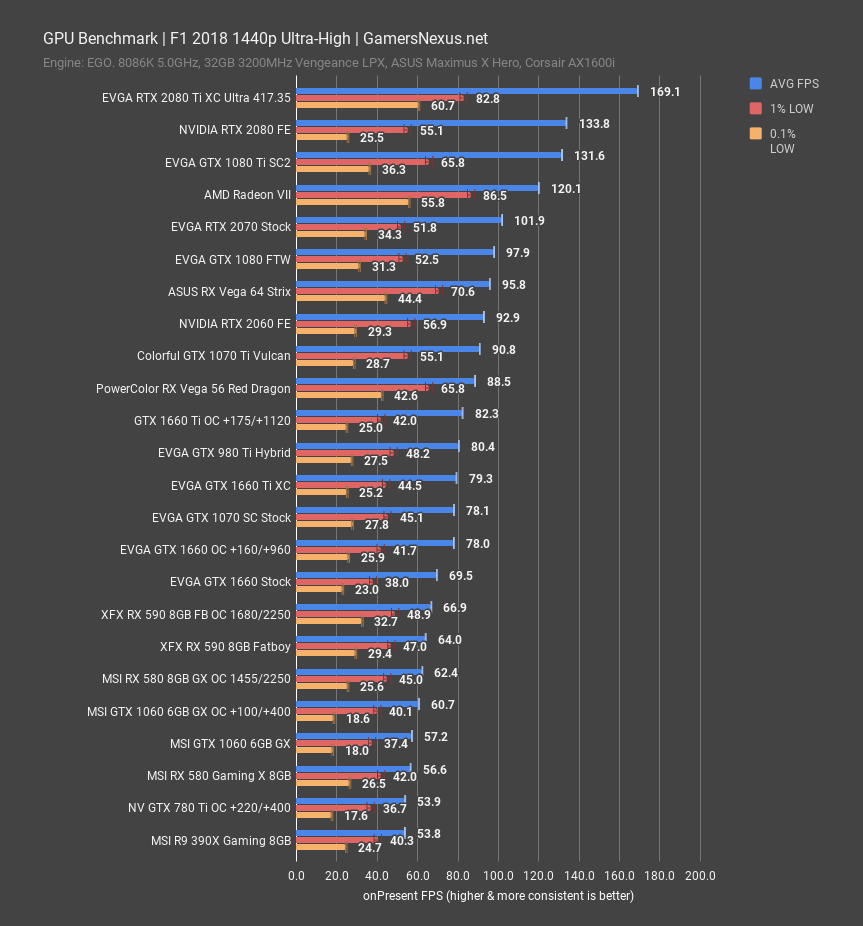
At 1440p, the 1660 non-Ti operated at 70FPS AVG, giving the 1660 Ti a lead of about 10FPS AVG, or about 14%. Once again, overclocking ties things up between the OC 1660 and stock 1660 Ti. The 1660 is fully capable of playing F1 2018 at 1440p and could be made more consistent in frametimes with some settings tweaks. Performance is about at the level of a GTX 1070 stock card when overclocked, better than a 1060 6GB, and not distant from an overclocked RX 590.
Far Cry 5
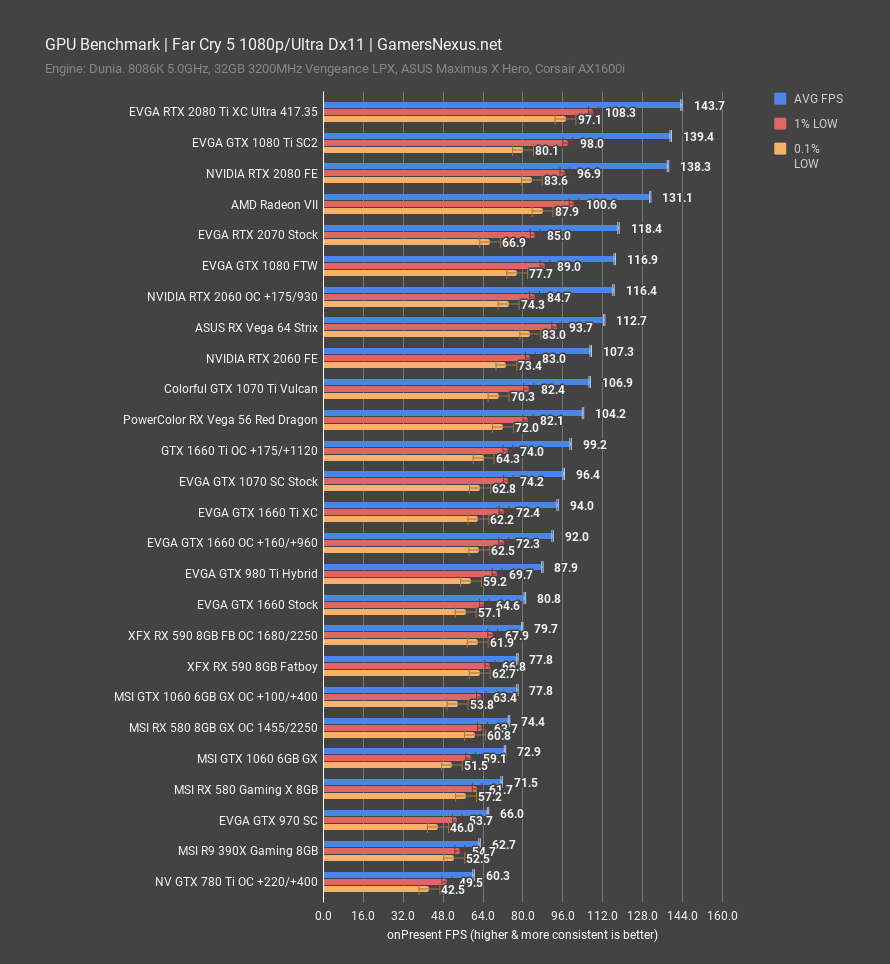
Far Cry 5 is next. At 1080p, the GTX 1660 ran an 81FPS AVG, putting it as closest in performance to an overclocked RX 590 and allowing the 1660 Ti stock card a lead of about 13FPS AVG, or 16%. This is consistent with other results. Vega 56 maintained a strong lead over both the Ti and, obviously, non-Ti for this game, but pricing also structures the 56 and 1660 at much different price classes. The 1660’s overclock planted it once again at Ti-level performance.
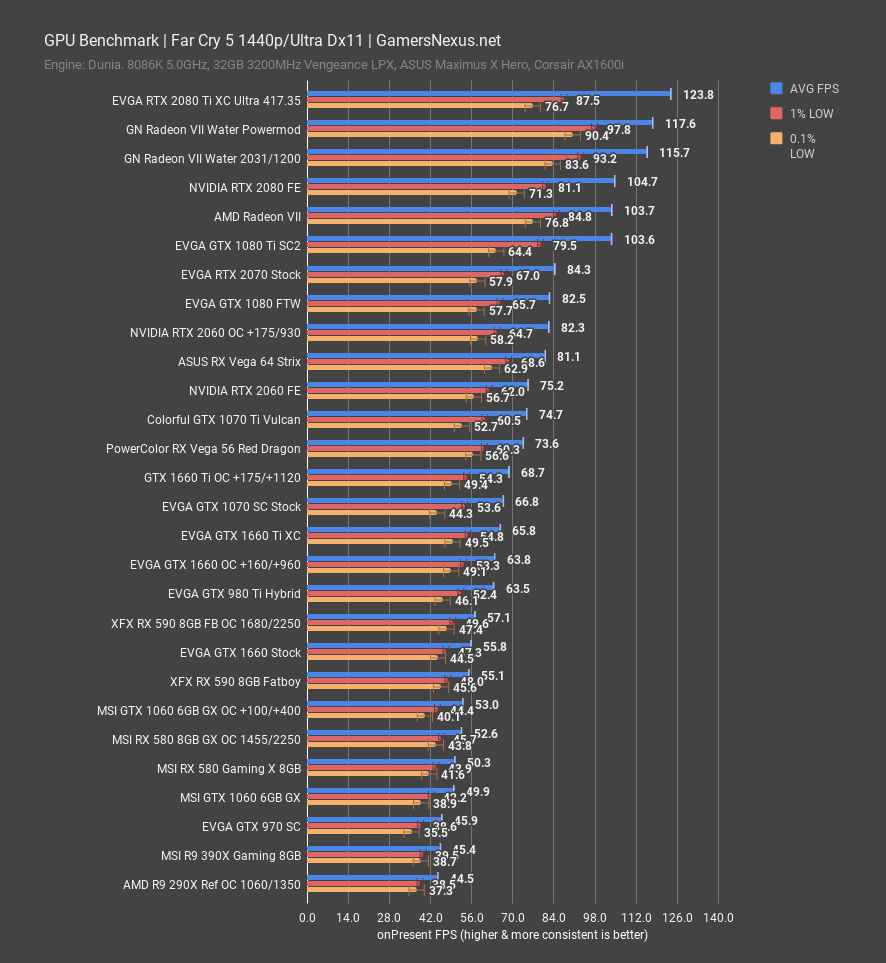
At 1440p, the 1660 stock card still managed to nearly hit the magical 60FPS mark, and is close enough that it could be said to work reasonably well at 1440p with some settings tweaks. At 56FPS AVG and 64FPS AVG when overclocked, the card nearly hit 1660 Ti performance even at the higher resolution. The GTX 980 Ti was also roughly tied with the overclocked 1660, for reference, with the stock RX 590 ending up functionally tied with the stock GTX 1660.
Shadow of the Tomb Raider
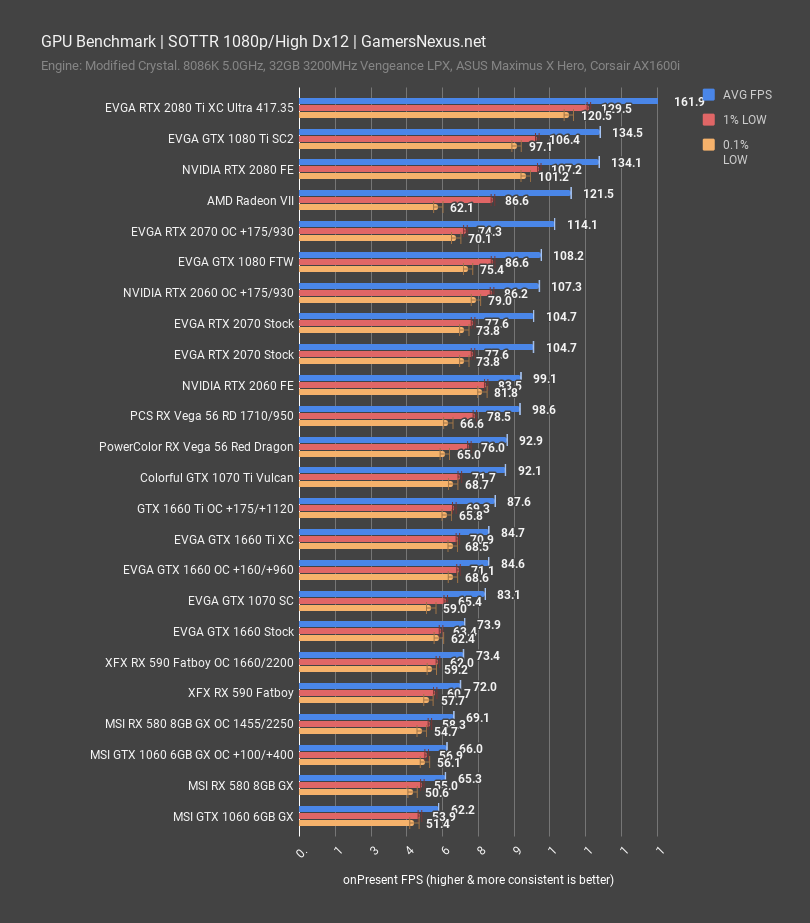
Shadow of the Tomb Raider at 1080p placed 1660 stock performance at about 74FPS AVG, allowing the 1660 Ti XC a lead at about 85FPS AVG, or 15%. Once again, this lead is consistent with other titles and seems to be about the average percentage increase. Overclocking the 1660 with a 160MHz offset allowed it to match the 1660 Ti stock card, which then climbed another couple FPS when it, too, was overclocked. The 1660 OC performed about where a GTX 1070 is, with the stock GTX 1660 at about RX 590 performance, including lows that were roughly within margin of error.
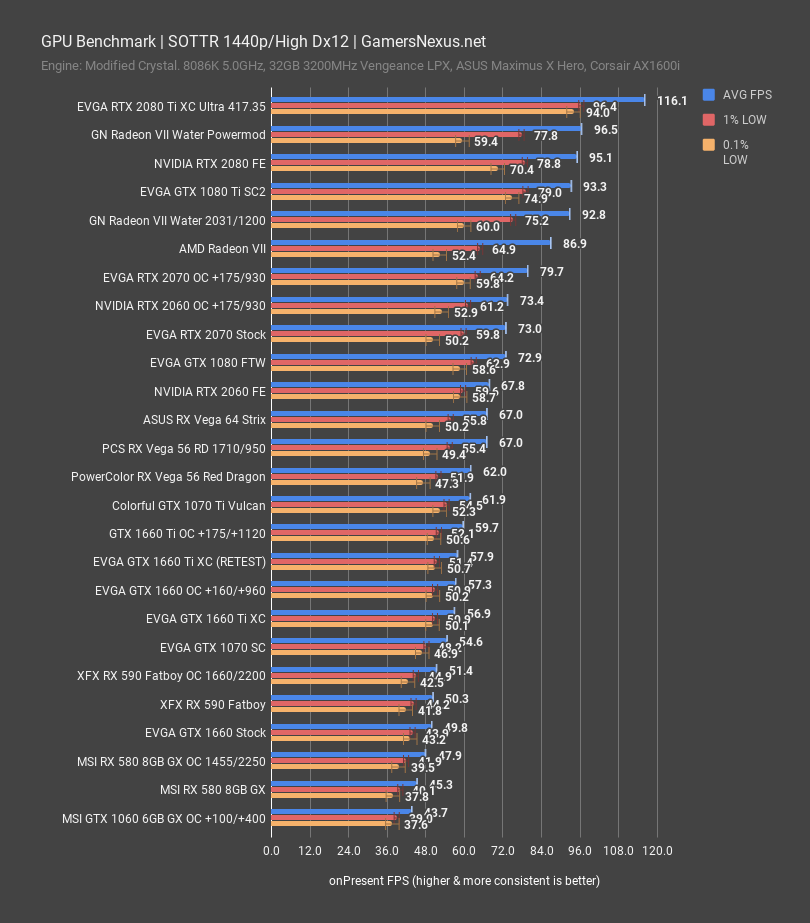
At 1440p, the GTX 1660 fell to 50FPS AVG, roughly tied with the RX 590’s 51FPS AVG. Low performance is within margin of error of the RX 590. The 1660 Ti ended up 14% ahead of the GTX 1660, within range of our previously plotted differences, while the 1660 OC pushed it up to 1660 Ti XC stock performance levels. The 1660 Ti XC overclock permitted another 5% performance over stock, but the 1660 overclock permitted 15% performance uplift. This massive headroom is what allowed for the tie-making performance, note however that the GTX 1660 we’re reviewing has power target increase of 23% available, whereas the 1660 Ti XC we reviewed remained capped at 130W TDP, or about 8% higher than the stock 120W TDP. If the 1660 Ti XC also had a 23% cap, we could push it a little further.
GTA V
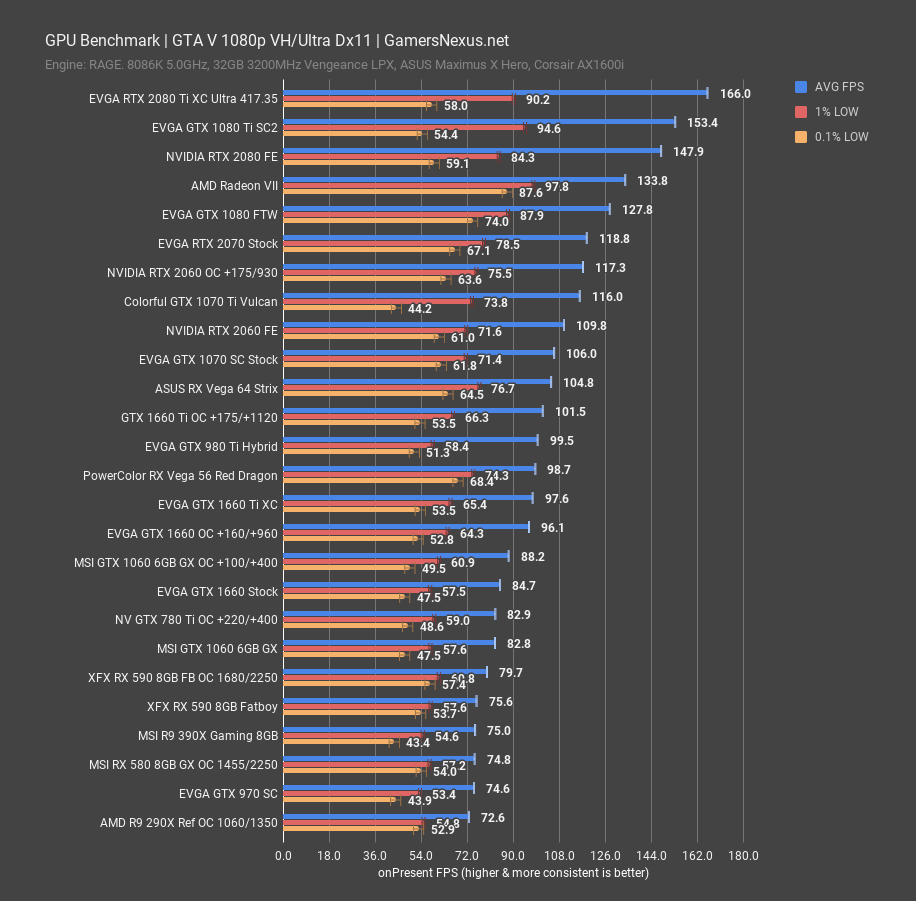
Finally, for GTA V, performance at 1080p, the GTX 1660 ended up at 85FPS AVG, allowing the 1660 Ti a lead of about 10FPS or about 13%. Overclocking, as the last several charts, got the 1660 to about the same performance as the 1660 Ti XC stock card. The RX 590 ended up far behind here, with Vega 56 also stuck at lower performance levels than in other titles. The way GTA V is built tends to favor NVIDIA devices, which isn’t for any other reason aside from how much compute is used, and so the GTX 1660 does favorably here.
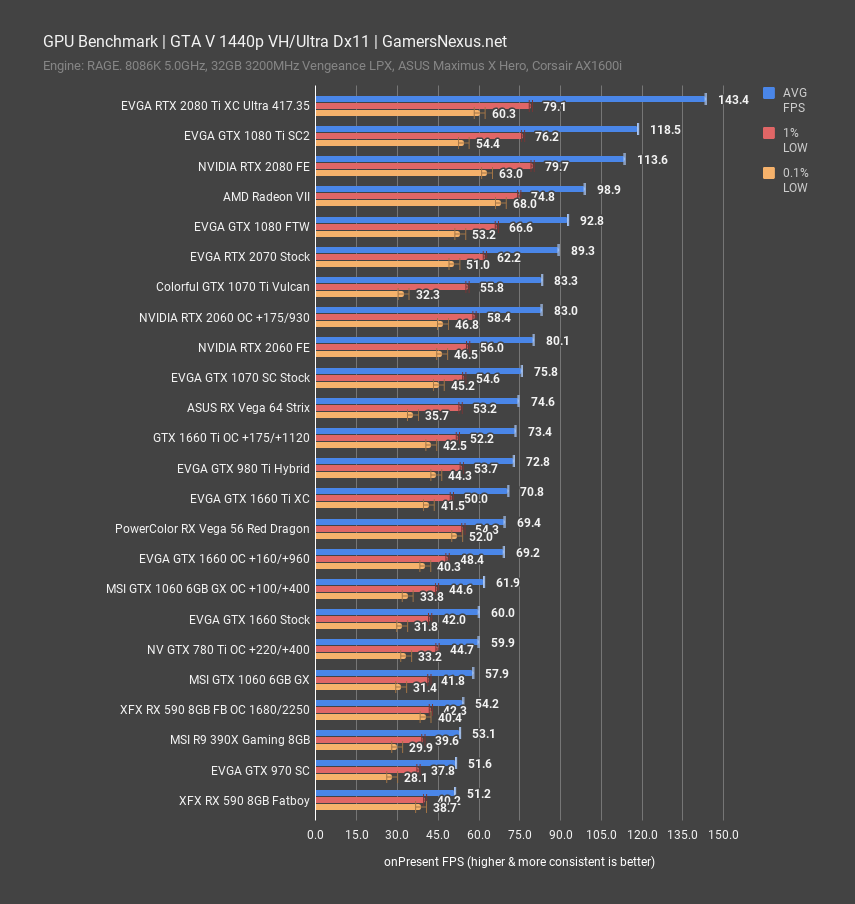
1440p placed the 1660 stock card dead at 60FPS AVG, but its frametime performance became more variable and dropped to about 32FPS 0.1% lows. Some settings reductions would be recommended to improve frametime consistency, although the card is overall capable of running GTA V at 1440p with these settings. Overclocking pushed it to 70FPS AVG, or about the same as the 1660 Ti XC, once again, and about the same as the Vega 56 Red Dragon.
OC Stepping
| EVGA GTX 1660 Overclock Stepping | TimeSpy Extreme Stress Test | GamersNexus.net | ||||||||||
| Peak Frequency | AVG Frequency | Core Offset | Core Voltage | Memory Frequency | Memory Offset | Power | Watts | Fan Speed | Active Temp | Pass/Fail |
| 1935 | 1935 | 0 | 1050 | 2000.5 | 0 | 123% | 115 | 1677 | 59 | P |
| 2025 | 2025 | 100 | 1050 | 2000.5 | 0 | 123% | 118 | 1700 | 59 | P |
| 2085 | 2085 | 150 | 1050 | 2000.5 | 0 | 123% | 120 | 1725 | 60 | P |
| 2100 | 2100 | 175 | 1050 | 2000.5 | 0 | 123% | 121 | 1735 | 60 | P |
| N/A | N/A | 200 | N/A | N/A | N/A | N/A | N/A | N/A | N/A | F |
| Fail - Application Crash | ||||||||||
| 2085 | 2085 | 175 | 1031 | 2415.5 | 830 | 123% | 124 | N/A | N/A | F |
| Fail - Application Crash | ||||||||||
| 2070 | 2070 | 160 | 1038 | 2415.5 | 830 | 123% | 125 | 1720 | 61 | P |
| 2070 | 2070 | 160 | 1038 | 2480.5 | 960 | 123% | 129 | 1770 | 60 | P |
| N/A | N/A | N/A | N/A | N/A | 1040 | N/A | N/A | N/A | N/A | F |
| Fail - Application Crash | ||||||||||
For that overclock we’ve been showing, Patrick stepped the card up to 123% power target and saw performance hold consistently at 1935MHz, with few dips between. This is often rare as a result of power limitation impositions restricting clocks as the frequency bounces off of the limit, but with no core offset applied and just power increased, the clock becomes consistent and holds steady. This remains true at 100MHz offset, where we’re still not hitting a power limitation. Skipping a few steps, we saw crashes at 175MHz offset on this card and so settled on 160MHz, with 15MHz being about the minimum stepping that can be applied to NVIDIA cards. At 2070MHz, there’s not much to be mad at with this card. 2070MHz is a strong frequency to hold for a mid-range video card. Memory ended up at about 2480.5MHz. We often stick closer to 400-500MHz for GDDR5, but did not see any performance decay in games with this 960MHz offset. The memory is good on the device we tested, and holds these higher clocks without issue. You’ll sometimes see soft memory errors at this type of offset, but in the games we tested, those didn’t impact performance. It may be more of a concern with professional applications, although we doubt many people are using a 1660 with those.
Power Consumption
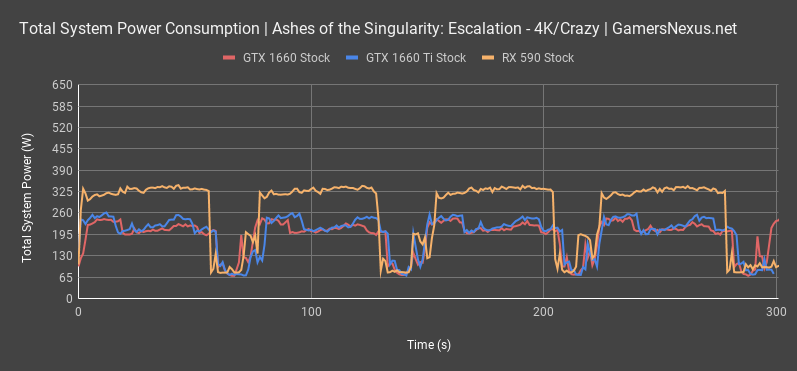
Power consumption testing is done at the wall, but uses a heavily controlled test bench for accurate tests run-to-run. We’re looking at total system power consumption in this test.
The GTX 1660 peaked at about 258W total system power consumption when stock, averaging closer to 200W total system power draw. Our 1660 Ti saw about the same power consumption, for reference, but keep in mind that partner model cards can change power target beyond the reference total board power provided by NVIDIA’s spec table.
The RX 590, for reference, plotted at about 325W peak p ower consumption and remained more consistent in its higher power draw, whereas the NVIDIA cards will power throttle more aggressively during testing. The RX 590 ended up about 70-120W higher than NVIDIA’s 16-series power consumption, depending on the test.
Thermals
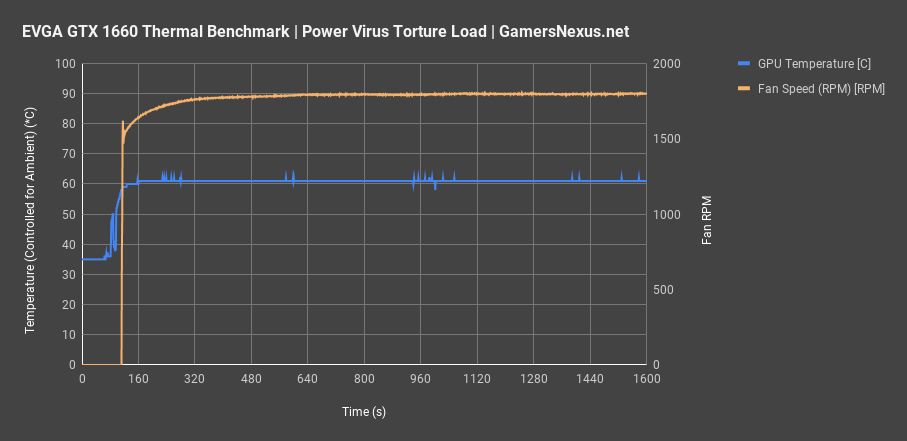
Thermal torture testing is up next. Under auto, stock conditions, the EVGA GTX 1660 tested kept a thermal target of about 60 degrees Celsius, illustrated by the thermal-over-time plot holding steady at 60. This had the fan ramping to about 1800RPM against its maximum of 3500RPM. Thermally, the GPU does well, and the fan RPM could be manually run at a less aggressive curve if lower noise were desired rather than lower thermals.
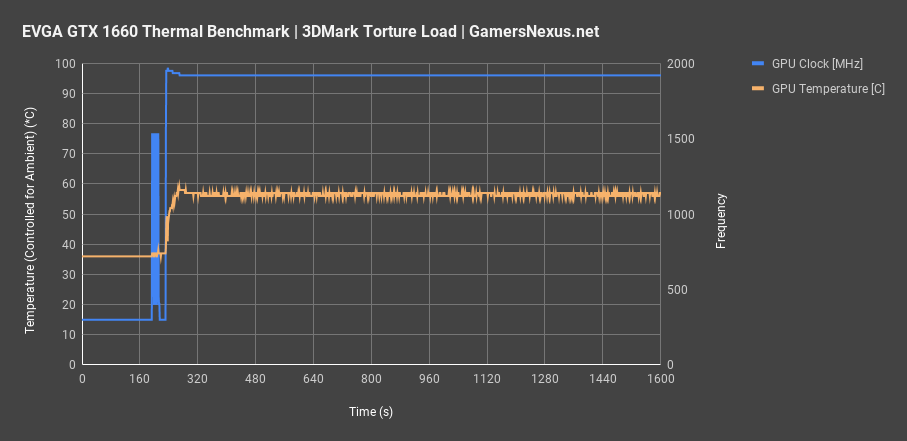
Switching over to the frequency chart, we see one of the most impressive frequency lines we’ve ever plotted for a stock card. It’s nearly perfectly flat in our 3DMark test, a result of the lower thermal target that kept the card under 60 degrees Celsius for the duration of the test. The card operated at about 1920MHz constantly when under stock conditions and with our 3DMark Firestrike Extreme fixed workload. This illustrates good thermal performance of the cooler and that we’re not bouncing off of major power limits under stock conditions.
Conclusion: Is the GTX 1660 Worth It?
The GTX 1660 that we reviewed is an interesting study in shaving pennies off of a higher-end product while spending more on the next model down. At $240-$250, it’s notably more expensive than the price floor of ~$220, but also has a high power target of ~130W GPU power with the offset. That’s the same amount of power as our GTX 1660 Ti XC runs when stock or overclocked, as it doesn’t have any offset available, and so the differences largely boil down to chip quality and memory bandwidth. In the games we tested, memory bandwidth didn’t matter as much as core speed (or was made-up for with the OC), and so an overclocked 1660 dual-fan model from EVGA rapidly becomes a price floor 1660 Ti XC model when stock. As always, you can continue the arms race and also overclock the 1660 Ti, but price becomes a limiter for people at some point.
For users who have wanted 1660 Ti baseline performance for a lower price, that can be had with one of the better 1660s (like the EVGA unit we reviewed) and 20 minutes of overclocking effort. It functionally becomes a stock 1660 Ti at that point, and so can shave $30 off the effective price of a 1660 Ti.
The GTX 1660 is a GTX 1060 6GB replacement. Performance shows that. The RX 590 needs to sell consistently at $200-$240 to make a dent in sales of the 1660, and Vega 56 needs to stay closer to the $280-$300 price-point of the 1660 Ti. If these conditions are not met, the 1660 OC models are worthwhile as a means to cheapen the effective price of a stock 1660 Ti by just spending some time applying a basic overclock. Note, of course, that the $220 models won’t have as high of a power target, and so won’t be as strong in their upward punch toward higher-end SKUs.
Editorial: Steve Burke
Testing: Patrick Lathan
Video: Andrew Coleman