AMD’s biggest ally for the RTX launch was NVIDIA, as the company crippled itself with unimplemented features and generational price creep out the gate. With RTX Super, NVIDIA demonstrates that it has gotten the memo from the community and has driven down its pricing while increasing performance. Parts of the current RTX line will be phased-out, with the newer, better parts coming into play and pre-empting AMD’s Navi launch. The 2070 Super is priced at $500, $50 above the 5700 XT, and the on-paper specs should put it about equivalent with an RTX 2080 in performance; it’s even using the TU-104 RTX 2080 die, further reinforcing this likely position. The 2060 Super sees a better bin with more unlocked SMs on the GPU, improving compute capabilities and framebuffer capacity beyond the initial 2060. Both of these things spell an embarrassing scenario about to unfold for AMD’s Radeon VII card, but we’ll have to wait another week to see how it plays-out for the yet unreleased Navi RX cards. There may be hope yet for AMD’s new lineup, but the existing lineup will face existential challenges from the freshly priced and face-lifted RTX Super cards. Today, we’re reviewing the new RTX Super cards with a fully revamped GPU testing methodology.
The first question is this: Why the name “Super?” Well, we asked, and nobody knows the answer. Some say that Jensen burned an effigy of a leather jacket and the word “SUPER” appeared in the toxic fumes above, others say that it’s a self-contained acronym. All we know is that it’s called “Super.”
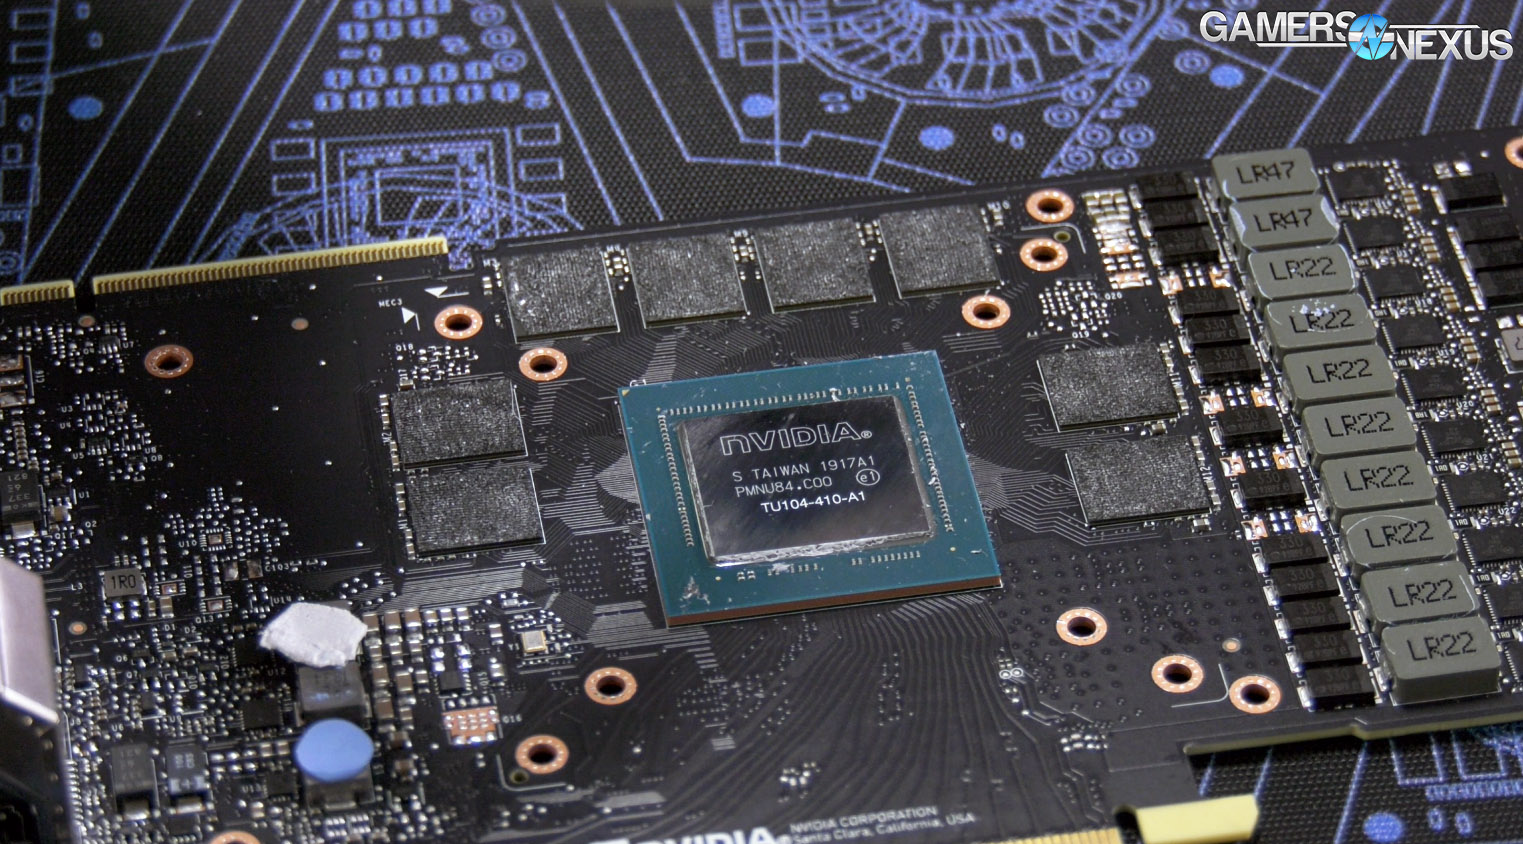
Rather than pushing out Ti updates that co-exist with the original SKUs, NVIDIA is replacing the 2080 and 2070 SKUs with the new Super SKUs, while keeping the 2060 at $350. This is a “damned if you do, damned if you don’t” scenario. By pushing this update, NVIDIA shows that it’s listening – either to consumers or to competition – by bringing higher performing parts to lower price categories. At the same time, people who recently bought RTX cards may feel burned or feel buyer’s remorse. This isn’t just a price cut, which is common, but a fundamental change to the hardware. The RTX 2070 Super uses TU104 for the GPU rather than TU106, bumping it to a modified 2080 status. The 2060 stays on TU106, but also sees changes to SMs active and memory capacity.
NVIDIA RTX 2060 Super & 2070 Super Specs
RTX 2070 Super | RTX 2070 | RTX 2060 Super | RTX 2060 | |
GPU Die | TU104-410 | TU106-400 | TU106-410 | TU106-200 |
Process Node | 12nm FinFET | 12nm FinFET | 12nm FinFET | 12nm FinFET |
Transistor Count | 13.6B | 10.8B | 10.8B | 10.8B |
Graphics Processing Clusters (GPC) | "5 or 6" | 3 | 3 | 3 |
Streaming Multiprocessors | 40 | 36 | 34 | 30 |
Texture Processing Clusters (TPC) | 20 | 18 | 17 | 15 (?) |
FP32 Units ("CUDA Cores") | 2560 | 2304 | 2176 | 1920 |
Tensor Cores | 320 | 288 | 272 | 240 |
RT Cores | 40 | 36 | 34 | 30 |
Texture Units | 160 | 144 | 136 | 120 |
ROPs | 64 | 64 | 64 | 48 |
Base/Boost | 1605/1770MHz | 1410/1620MHz | 1470/1650MHz | 1365/1680MHz |
Memory Clock | 7000MHz | 7000MHz | 7000MHz | 7000MHz |
Memory Data Rate | 14Gbps | 14Gbps | 14Gbps | 14Gbps |
L2 Cache | 4MB | 4MB | 4MB | 3MB |
VRAM | 8GB GDDR6 | 8GB GDDR6 | 8GB GDDR6 | 6GB GDDR6 |
Memory Interface | 256-bit | 256-bit | 256-bit | 192-bit |
Memory Bandwidth | 448GB/s | 448GB/s | 448GB/s | 336GB/s |
Texture Filter Rate | 283.2GT/s | 233.3GT/s | 246.2GT/s | 201.6GT/s |
Advertised TDP | 215W | 175W | 175W | 160W |
MSRP | $500 | $500 | $400 | $350 |
For a very quick explanation of what’s happening, NVIDIA has binned-out its chips to help with cost management of the relatively large Turing dies. The RTX 2070 will now run 5 or 6 GPCs by spec, varying from die-to-die. The fact that it’s “5 or 6” tells us that this is a matter of binning based on defects. As with all silicon manufacturing, some percentage of silicon will be defective. NVIDIA is taking TU104 GPUs that may have otherwise failed validation for an RTX 2080 and is instead turning them into 2070 Supers, which means that more chips will pass validation for this product SKU than might have for a 2080. The 2080 has 46 streaming multiprocessors, or functional cores, each of which has its own hardware within, like FP32 and INT units. The 2070 Super has 40 SMs, so cutting 6 but boosting the clock speeds from 1710MHz boost to 1770MHz boost means that performance should be close in most comparisons, as you’ll see in our benchmarks today. That “5 or 6” number means that the functional SMs will move around the die based upon what passed in validation, so this isn’t going to be some artificial limit that NVIDIA set, it’s actually based on yields for the dies. If it were artificially locked, they’d all be set 5 or 6 GPCs, not either 5 or 6 per card. This is an optimization in manufacturing process that allows NVIDIA to better min-max its price-to-performance on Super versus the base models. Clocks do the rest.
UPDATE: NVIDIA has made a last-minute change (literally made within hours of the review going up). While some of the 2070 Supers will have "5 or 6" GPCs, the company decided to only fuse them off to 6 GPCs going forward, so that "5" number should be pretty rare to encounter after the initial batch, if ever.
Opening our card up revealed that these were assembled on May 31, so when considering shipping timelines, holidays, and Computex, these haven’t been in existence for very long. The board design is the same, so the RTX 2070 Super card uses the same PCB layout as the RTX 2080, which means that existing water blocks will fit, albeit with the wrong name plate. More on this in our upcoming tear-down video.
Let’s get into the testing. We have all new testing today.
Test Methodology
We have overhauled the host test bench and had updated with new games. Our games selection is a careful one: Time is finite, and having analyzed our previous testing methodologies, we identified shortcomings where we were ultimately wasting time by testing too many games that didn’t provide meaningfully different data from our other tested titles. In order to better optimize our time available and test “smarter” (rather than “more,” which was one of our previous goals), we have selected games based upon the following criteria:
- Game Engine: Most games run on the same group of popular engines. By choosing one game from each major engine (e.g. Unreal Engine), we can ensure that we are representing a wide sweep of games that just use the built-in engine-level optimizations
- API: We have chosen a select group of DirectX 11 and DirectX 12 API integrations, as these are the most prevalent at this time. We will include more Vulkan API testing as more games ship with Vulkan
- Popularity: Is it something people actually play?
- Longevity: Regardless of popularity, how long can we reasonably expect that a game will go without updates? Updating games can hurt comparative data from past tests, which impacts our ability to cross-compare new data and old, as old data may no longer be comparable post-patch
Game graphics settings are defined in their respective charts.
We are also testing most games at all three popular resolutions – at least, we are for the high-end. This includes 4K, 1440p, and 1080p, which allows us to determine GPU scalability across multiple monitor types. More importantly, this allows us to start pinpointing the reason for performance uplift, rather than just saying there is performance uplift. If we know that performance boosts harder at 4K than 1080p, we might be able to call this indicative of a ROPs advantage, for instance. Understanding why performance behaves the way it does is critical for future expansion of our own knowledge, and thus prepares our content for smarter analysis in the future.
For the test bench proper, we are now using the following components:
GPU Test Bench (Sponsored by Corsair)
Component | Courtesy of | |
CPU | GamersNexus | |
GPU | This is what we’re testing! | Often the company that makes the card, but sometimes us (see article) |
Motherboard | ASUS | |
RAM | Corsair | |
PSU | Corsair | |
Cooler | NZXT | |
SSD | Plextor 256-M7VC | GamersNexus |
All memory timings are completely controlled for our new GPU testing, which has significantly tightened our error margins. Windows is version 1903. Note that some games, like GTA V and Hitman 2, have been manually tuned outside of a simple preset to ensure we have a proper benchmark. GTA V uses 2x MSAA in our testing, as it runs into engine frame limits at 187.5FPS and triggers engine-level bugs. Hitman 2 has crowd simulation and sound simulation settings that we tune back to the 4-core setting, as running higher than that creates a CPU bottleneck (and more of a CPU benchmark, as a result).
NVIDIA RTX Super Frequency Scaling
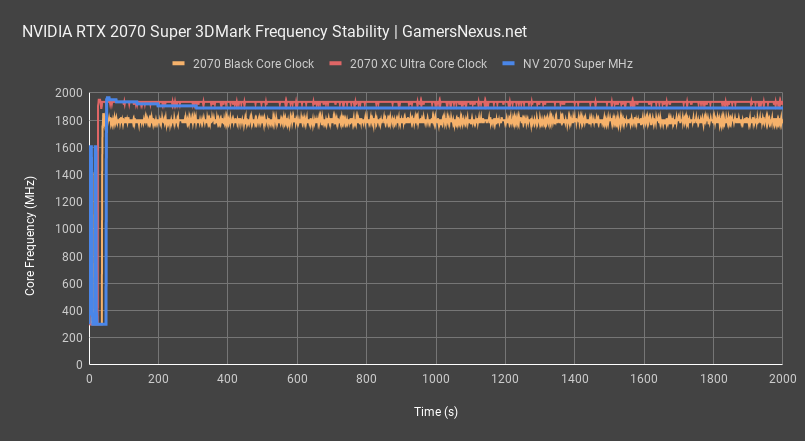
We’ll start with frequency plots so that we can better illustrate NVIDIA’s changes. Most of the changes are lower-level activations on SMs and parts of GPCs, but some of it is frequency tuning. This first chart shows frequency over a 30-minute 3DMark burn-in for the RTX 2070 Super. The Super has a nearly perfectly flat line, which is ideal. We don’t see lines like this typically unless it’s a good partner cooler; typically, the line will fluctuate, kind of like the 2070 Black line on this chart, because of bouncing off of power, thermal, or voltage limits. The 2070 Super is nearly perfectly flat and averages at 1890MHz. The fall-off at the beginning is a result from temperature ramp from under 40 degrees to about 70 degrees Celsius, and Boost behavior means we see fall-off as this ramps. The 2070 XC Ultra partner model still has a higher frequency, but won’t perform as well as the 2070 Super due to hardware-level differences.
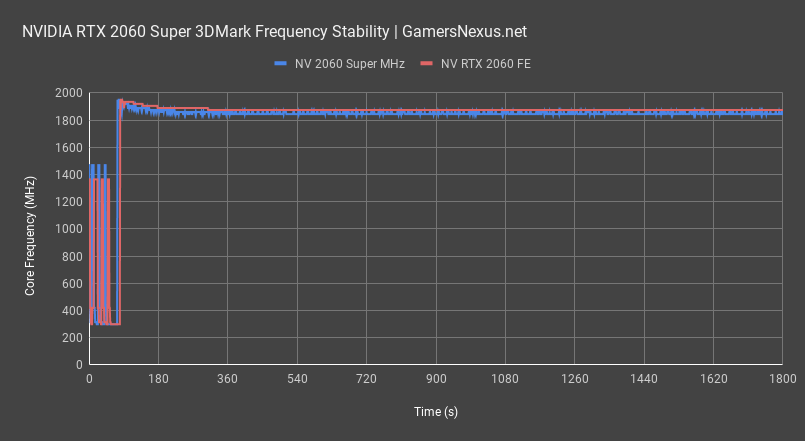
As for the 2060 Super’s frequency, that trends lower than the 2060 Founders Edition, but occasionally spikes above it. The additional hardware enabled on the chip pushes a higher thermal density and causes spikier frequency behavior under the smaller cooler, although the overall frequency is still very stable. We see it averaging at about 1845MHz versus the 1875MHz of the 2060 FE. Fan RPM is still the same as the 2070 Super at 3700RPM and hits the same 1700RPM range under an auto load due to thermal targets. More on this later. Let’s get into games next.
Sniper Elite 4 – NVIDIA RTX 2060 Super & 2070 Super Benchmarks
Sniper Elite 4 remains one of our most-used games as a benchmark, always because of its excellent reliability and good DirectX 12 and asynchronous compute implementations. Both teach us about how graphics architectures handle modern games. We’ll get to the other Dx12 and Vulkan games freshly added after this.
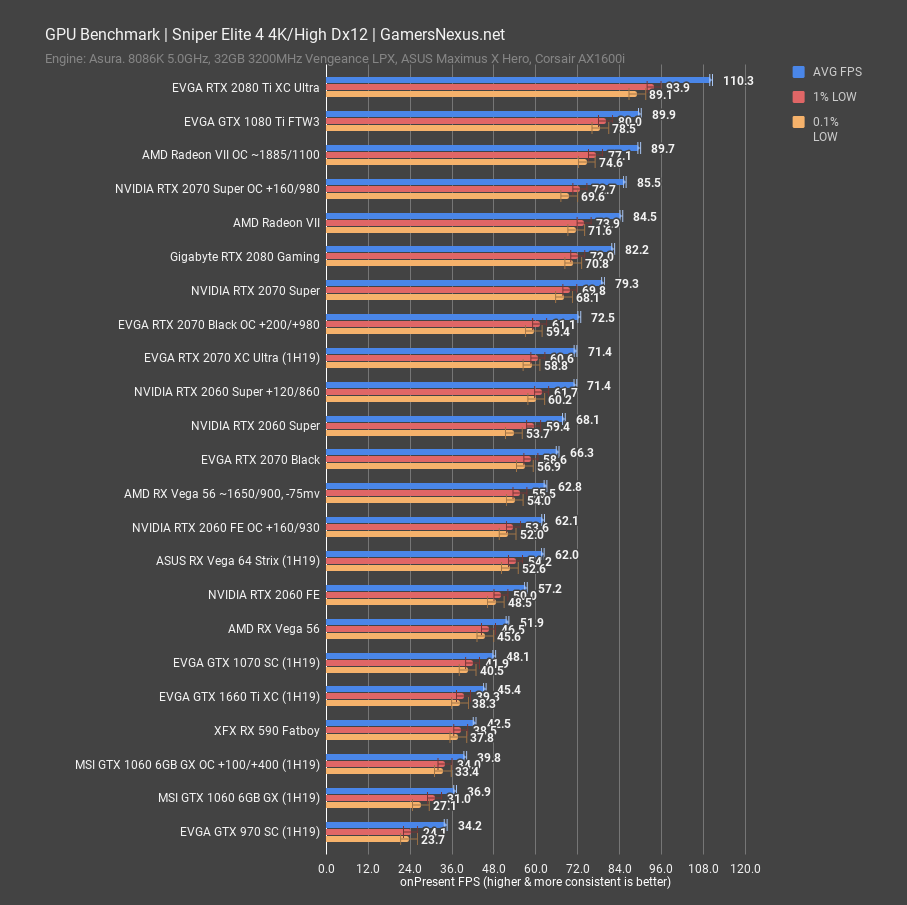
For Sniper Elite 4 testing, used at 4K to produce a bit of a synthetic load for better review usability, we found the RTX 2060 Super card performs at 68FPS AVG, with lows well-spaced at 59FPS 1% and 54FPS 0.1%. This is more a testament to the game, at this point. The 2060 non-Super FE card runs the same workload at 57FPS AVG, allowing the Super card a massive gain of 20%. Both cards were freshly retested on the newest drivers. This jump is from the gains in compute performance from unlocked hardware on the 2060 Super and is nothing to do with the memory.
The RTX 2070 Super ends up at 79FPS AVG, putting it about on par within an RTX 2080. The 2080 FE, for reference, was at about 84FPS, although we’ve placed the cheaper Gigabyte model as we think it’s a more realistic representation of what people actually buy. They’re about the same and within error. The Super and 2080 differences exit error, but are perceptually the same. This allows Radeon VII a lead of about 6.5% over the 2070 Super, although the Super is priced at $500 and Radeon VII still runs at about $680 on a good day. At this point, it’s difficult to impossible to justify Radeon VII for gaming uses. If you’re curious about its uses in workstation applications where the 16GB framebuffer might get utilized, we have a separate GPU workstation video you can check out for that. In gaming, though, Radeon VII simply looks bad when compared to the new 2070 Super, which also is positioned about 20% ahead of the original EVGA RTX 2070 Black, which was the cheaper non-A model of the 2070 – the one that shipped actually at MSRP, as opposed to the A-binned ones with a higher clock. The RTX 2060 Super outpaces the RTX 2070 Black card in this test. For reference, we included the 2070 XC Ultra more expensive A-bin model, which ranks at 71FPS AVG and equals an overclocked 2060 Super. We won’t include this data going forward as we’re more interested in comparing at actual MSRP, but you can find it in our older GPU reviews.
Strange Brigade – RTX 2060 & 2070 vs. 2060 Super & 2070 Super
Our next test is new. The game is Strange Brigade, made by the same people who made Sniper. This game was chosen because it leverages both Vulkan and DirectX 12, and so we tested with both APIs. We’ll first look at performance with the Vulkan API, an important and underrepresented API in the market, and we’ll then do a performance scaling comparison against DirectX 12.
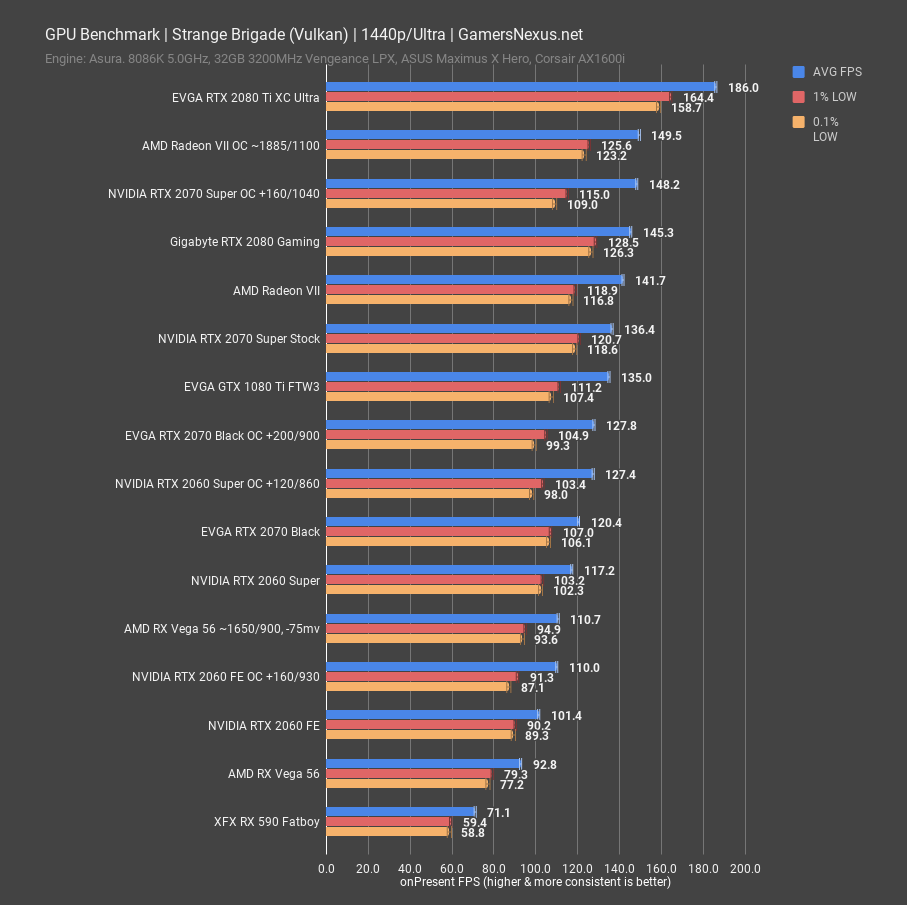
With Vulkan and tested at 1440p/Ultra, the RTX 2060 Super places at 117FPS AVG, with lows again well-timed. This positions it as ahead of the overclocked and undervolted Vega 56 card’s 110FPS AVG, but also ahead of the 2060 FE’s 101FPS AVG. The latter is surpassed by 16%. The 2060 Super therefore ends up near the non-A SKU RTX 2070 MSRP model, priced at about $480 these days. Overclocking Super puts it just below an overclocked RTX 2070, which still performs well when manually boosted, despite the non-A die. The 2060 Super and 2070 are functionally equal in this testing, especially with the OC. Finally, NVIDIA starts to look like it got the message on price: We beat NVIDIA over the head with its own 1080 Ti when the RTX cards launched, primarily pointing toward the generational price creep for equivalent performance. Now, with the 2070 Super stock card slightly better than the 1080 Ti, and with a price of $500 to the 1080 Ti’s $700 to $800 range, it’s finally starting to look better.
As for an overclock on the 2070 Super, it ends up past the stock RTX 2080 and about equal with an overclocked Radeon VII, although Radeon VII’s 0.1% lows are marginally better; note though that 0.1% low error margins are wider than averages. NVIDIA’s compute improvements for Turing chip away at an advantage AMD previously had, chewing Radeon VII’s lead over the 2070 Super down to just 4%. Radeon VII isn’t even meant to compete with a $500 2070 refresh, it’s meant to compete with the 2080. Things aren’t looking good for gaming use cases for the card.
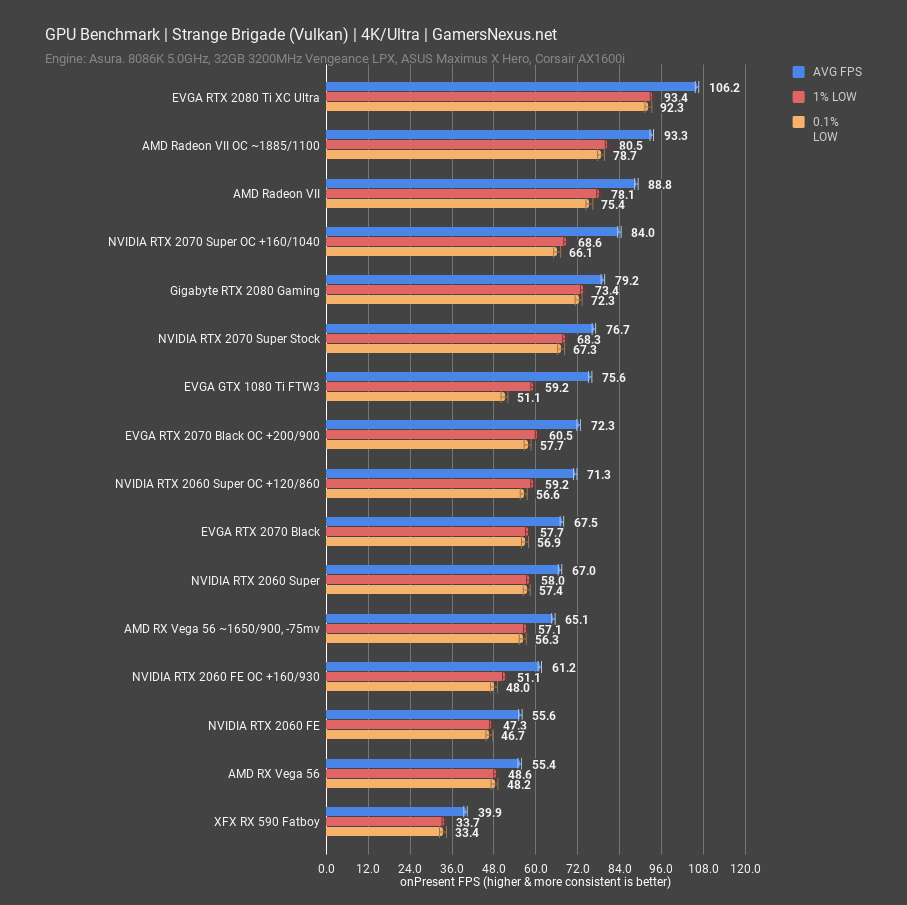
At 4K with Vulkan, AMD architecture scales a bit better and puts the R7 ahead of the 2070 Super by 16%. This isn’t to do with memory capacity, but instead with memory bandwidth and GCN tripping over itself at higher CU counts with workloads that don’t match the architecture’s capabilities properly. As for the stars of the show today, the 2060 Super ends up at 67FPS AVG, leading the 2060 FE’s 55FPS AVG by 20%. The 2070 Super roughly matches the 2080, allowing the 2080 a slight lead.
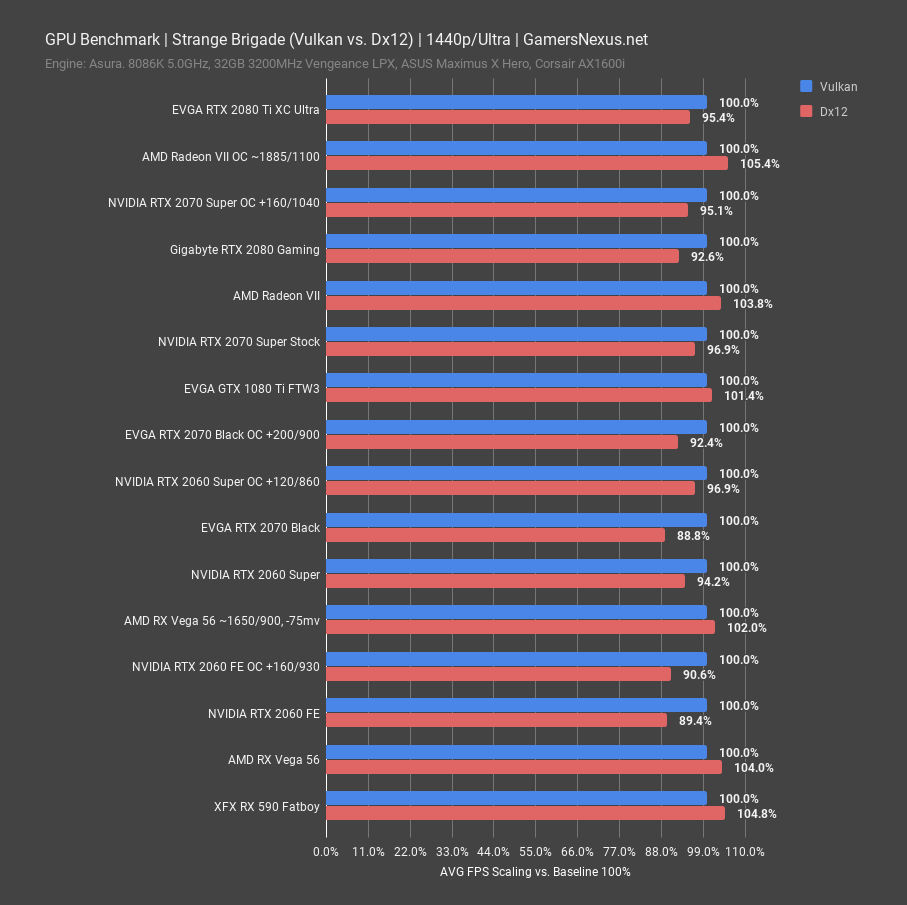
Moving on from these tests and into a scaling comparison, we get something really interesting and unique to our new test methods. Contrary to our expectations, AMD actually does better with DirectX 12 in this game, as does Pascal. It appears the older architectures prefer Strange Brigade’s Dx12 implementation. We saw roughly 4% higher performance with Radeon VII on Dx12, resulting in a jump from 141FPS to about 147FPS AVG. The NVIDIA Turing cards do better on Vulkan, sometimes significantly so. We see a bigger jaunt with the low-ish end RTX 2060 and 2070 Black than others, but even the 2080 Ti saw a 5% jump.
GTA V – Radeon VII vs. RTX 2070 Super
We have more Dx12 tests to get through, but it’d be good to first visit the third major graphics API: GTA V gives us a long-standing look at a traditionally built Dx11 game and features the many abstraction layers that once inhibited hardware.
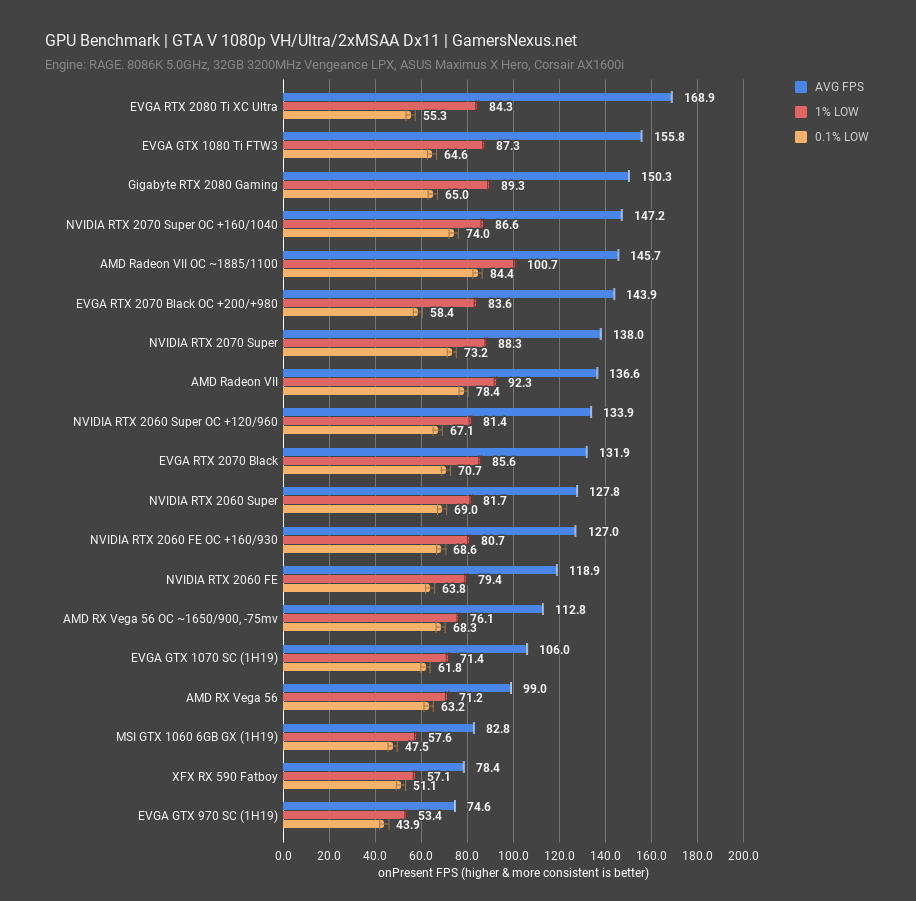
At 1080p, 2060 Super ends up at 128FPS AVG, positioned roughly tied with the overclocked 2060 FE at 127FPS AVG. The lead over the stock 2060 FE’s 119FPS AVG is about 7.5%. The 2070 Super measures at 138FPS AVG, putting it slightly ahead of Radeon VII and about 4.6% ahead of the 2070 Black. Between this result and the GTA V results, we see closer performance between the Super and non-Super cards. This is because GTA V is more frequency intensive, so the 2060 Super and 2070 Super are primarily deriving gains from the frequency rather than from the additional SMs. Overclocking the 2070 Super puts it at about 2080 levels of performance, further reinforcing that frequency matters more than the additional SMs in this title. AMD has historically done poorly in GTA V, demonstrated by Vega 56’s lackluster performance and near-equivalence with a GTX 1070.
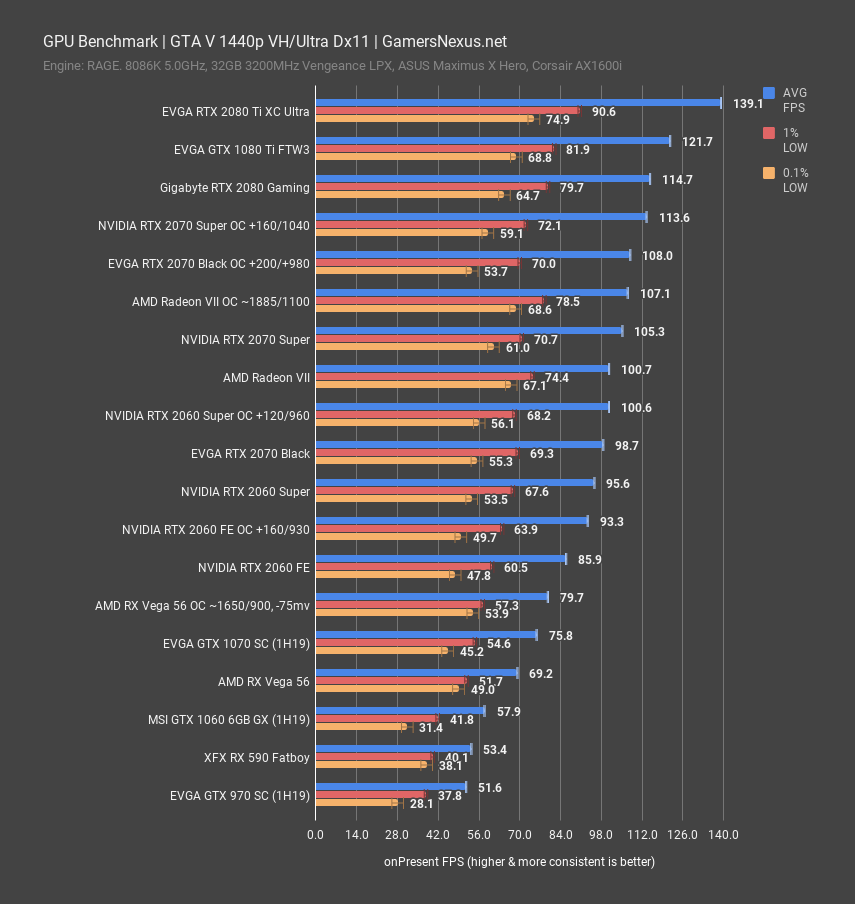
1440p shows more of the same: An overclocked 2070 Super is roughly equivalent to a 2080 stock card, a 2070 Super stock card lands between Radeon VII stock and overclocked results, and an overclocked 2060 Super is roughly equivalent to Radeon VII stock while outperforming the non-A SKU 2070 Black.
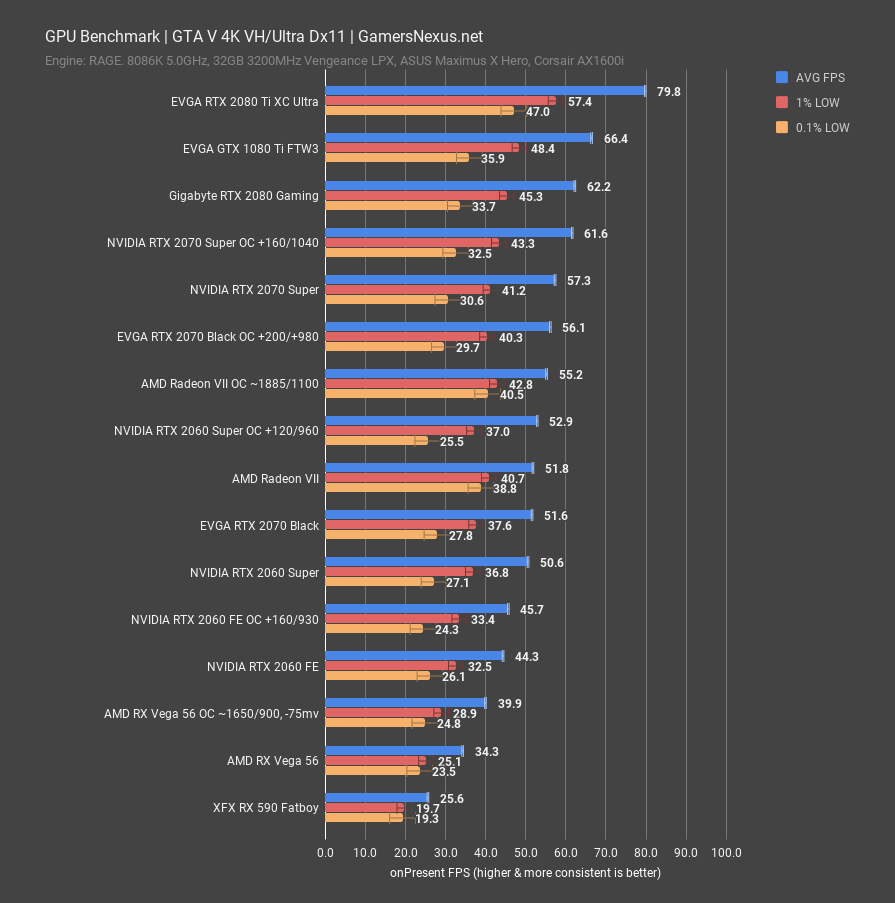
Just quickly, at 4K, the RTX 2080 holds a lead of about 9% over the 2070 Super when stock, but overclocking ties them up; obviously, you could then overclock the 2080 to keep that distance. The 2060 Super ends up at 51FPS AVG, which roughly ties it with the previous RTX 2070 Black card.
F1 2018 – NVIDIA Super Benchmarks
We’ll look at another DirectX 11 game next, then back to Dx12.
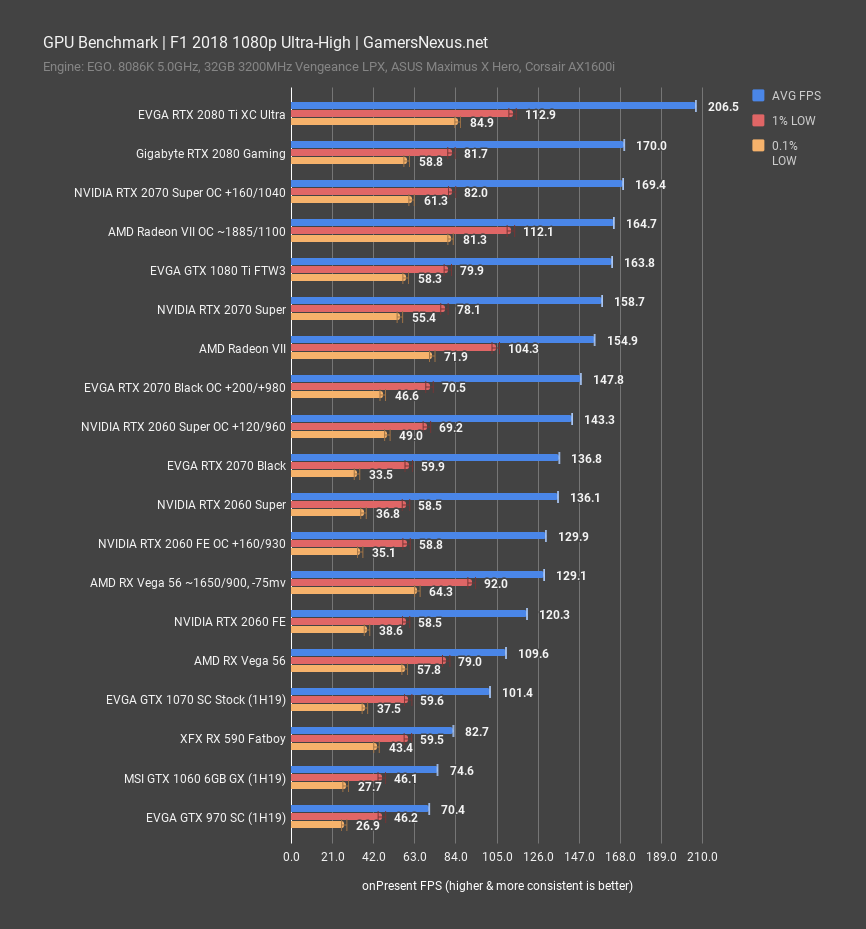
F1 2018 at 1080p positions the 2070 Super at 159FPS AVG, which is between the Radeon VII and 1080 Ti FTW3. Overclocking Super puts it just below the RTX 2080, with the RTX 2080 Ti useful primarily to illustrate that we aren’t hitting a CPU bottleneck with the 2070 Super and 2080. The 2060 Super ties with the 2070 Black, and the 2060 FE overclocked is just below the 2060 Super. Overall, the 2070 Super stock carries a lead of 16% over the 2070 Black, with the 2060 Super stock carrying a lead of 13% over the stock 2060 FE at 120FPS AVG.
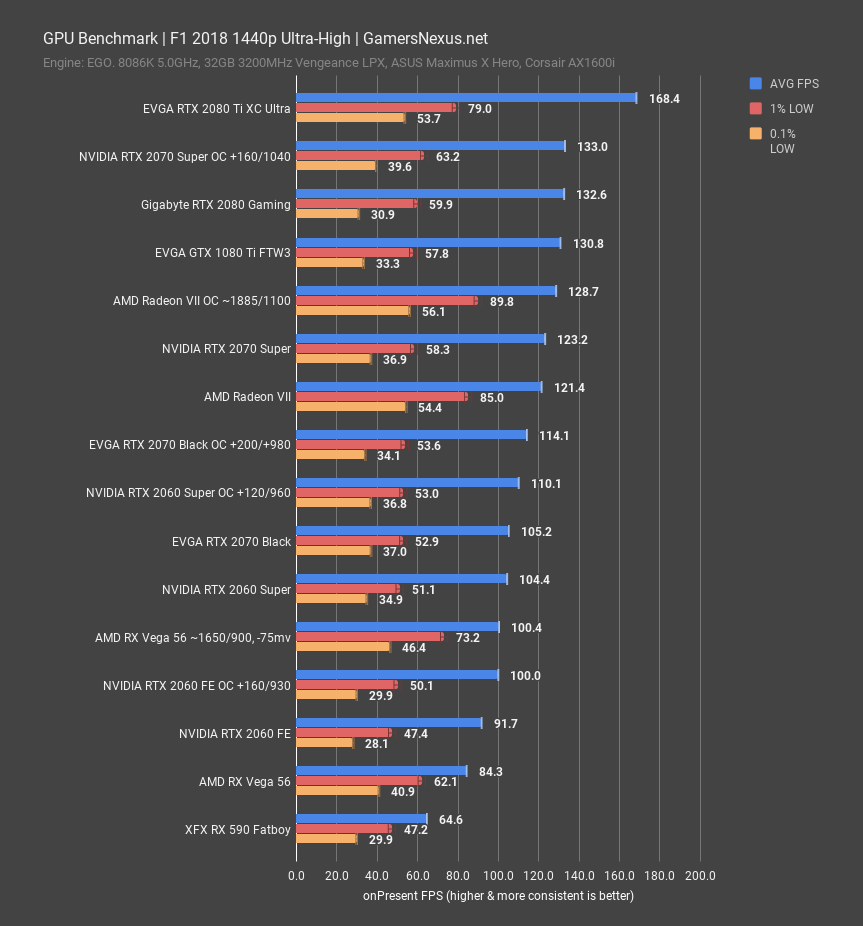
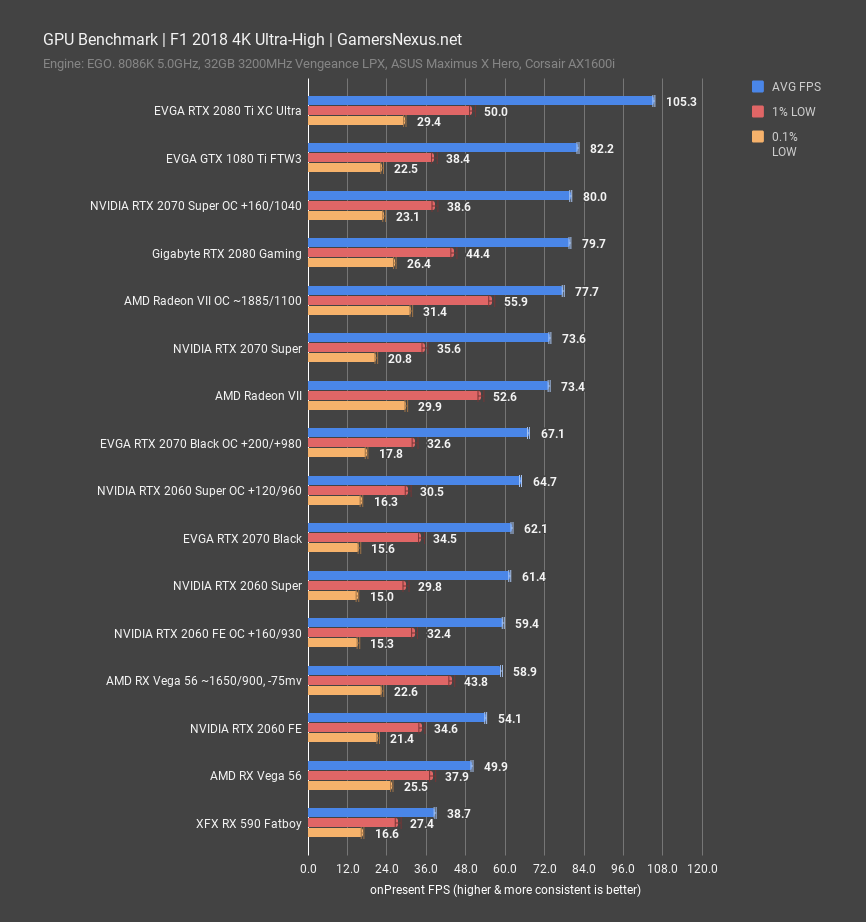
At 1440p, the stack remains largely the same: AMD GCN architecture has always posted stronger low performance in this game than the others, and that’s illustrated again with Radeon VII’s frametime consistency. By averages, the 2070 Super is functionally tied with Radeon VII, but Radeon VII’s frametimes are more consistent. That said, it’s also about $180 more expensive. The 2080 holds a lead of 7.6% over the 2070 Super, which is a gap closed when overclocking the 2070 Super. The 2060 Super is roughly tied with the 2070 Black.
Shadow of the Tomb Raider Benchmarks – RTX 2060 Super vs. RTX 2060, 2070 Super
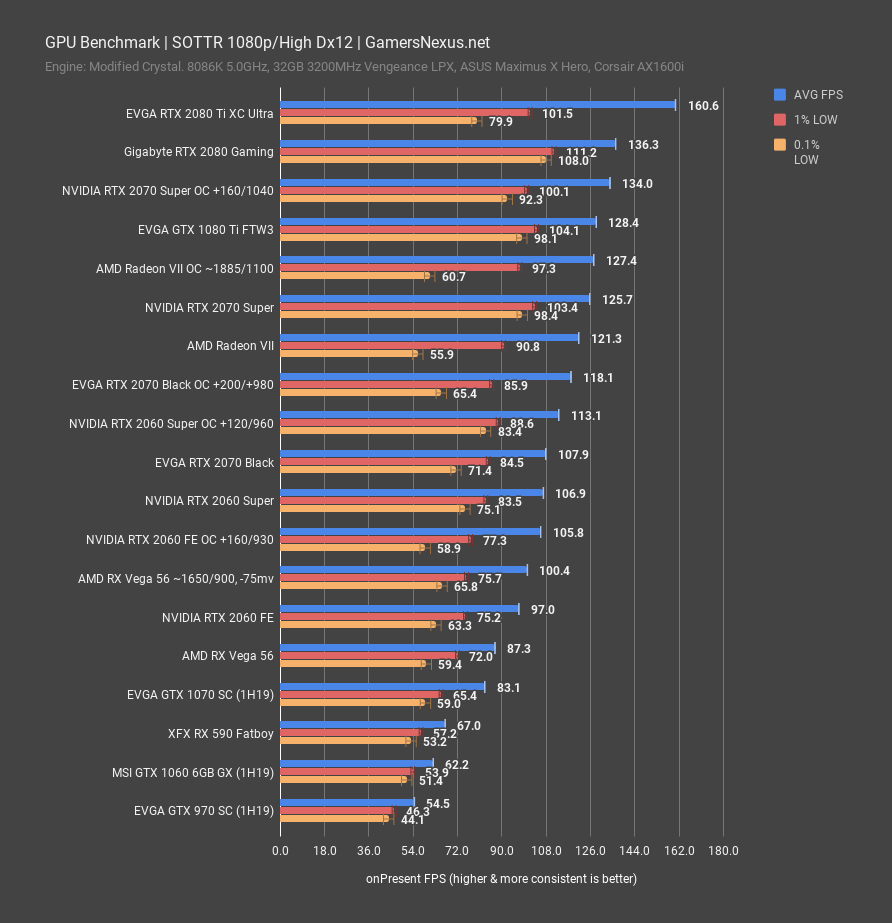
Shadow of the Tomb Raider with Dx12 puts the RTX 2070 Super at 126FPS AVG with very consistent frametime performance, positioned ahead of Radeon VII in both averages and lows and nearing the 1080 Ti. The RTX 2080 still manages to hold a lead of 8% over the 2070 Super card. The 2060 Super ties with the 2070 Black and 2060 FE overclocked cards, but holds a lead of 10% over the stock 2060 FE.
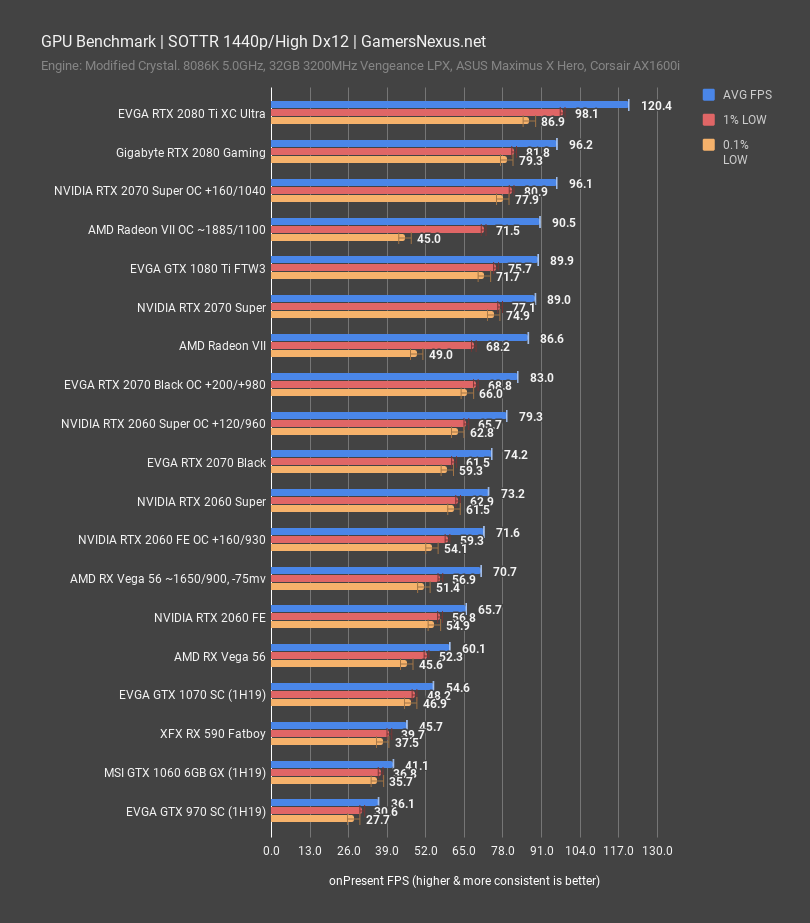
At 1440p, the scaling remains similar, so we won’t repeat all of that. More importantly, the 2060 Super is well-equipped to play this game at 1440p with High settings, running at 73FPS AVG and again tying the non-A SKU 2070. The 2060 FE can also manage, but the Super card holds a lead of 11%, which may justify the $50 price tag.
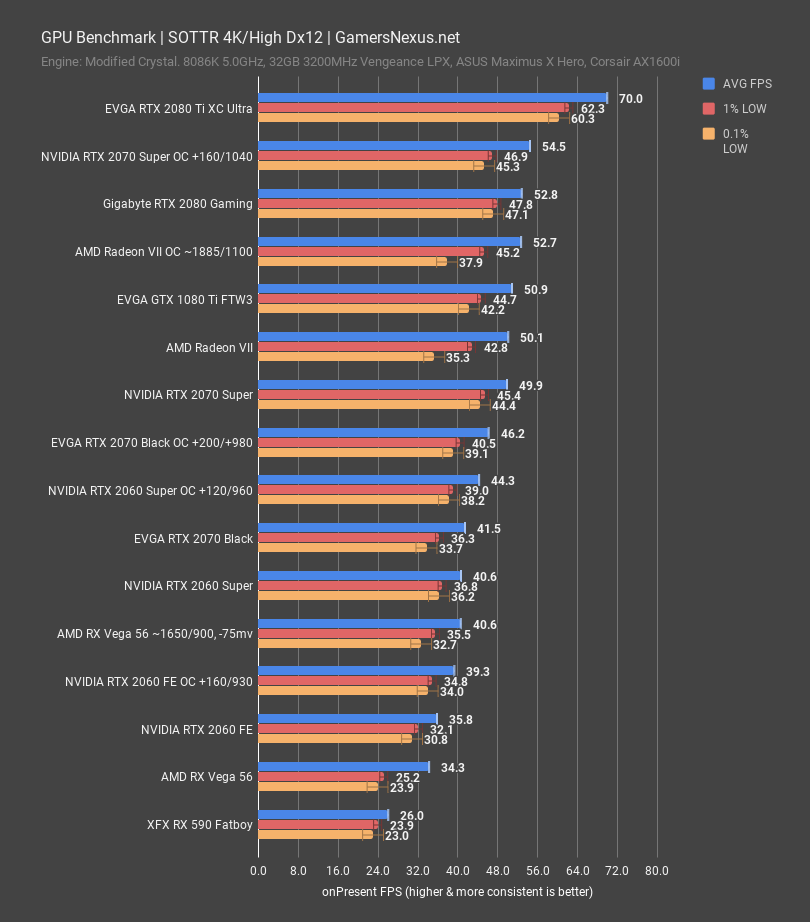
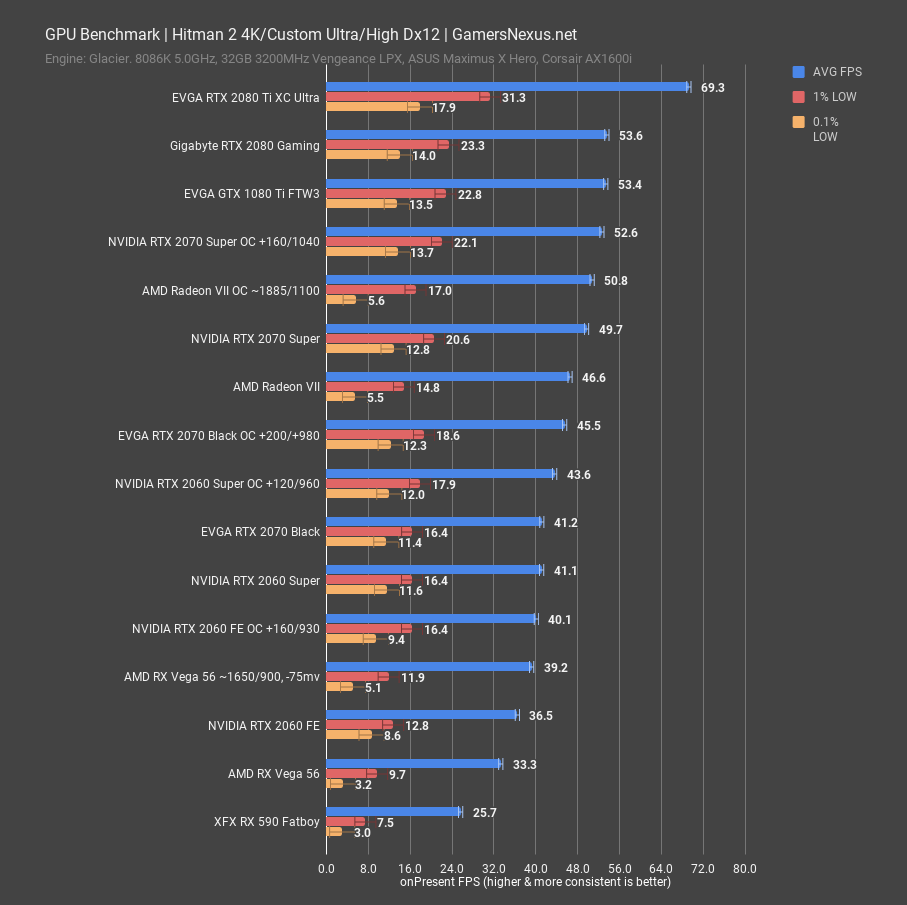
We also decided to check 4K. At 4K, the 2070 Super holds at 50FPS, with an overclock allowing it to push 55FPS AVG. This could be made do-able at 60FPS with some settings reductions, like by dropping a few GPU-intensive settings to medium while leaving GPU memory-intensive settings, like texture resolution, at higher qualities. The 2060 Super’s 41FPS AVG and 44FPS OC mostly relegate it to 1440p and below for Tomb Raider.
Hitman 2 Benchmarks – DirectX 12 vs. DirectX 11
Hitman 2 is up next. For this one, we’re testing both DirectX 12 and DirectX 11 to illustrate how each architecture scales APIs, similar to Strange Brigade. Note that we turn down the CPU binding settings (like crowd simulation and audio simulation), as running them maxed will result in a hard CPU bottleneck and therefore less usefulness for GPU testing.
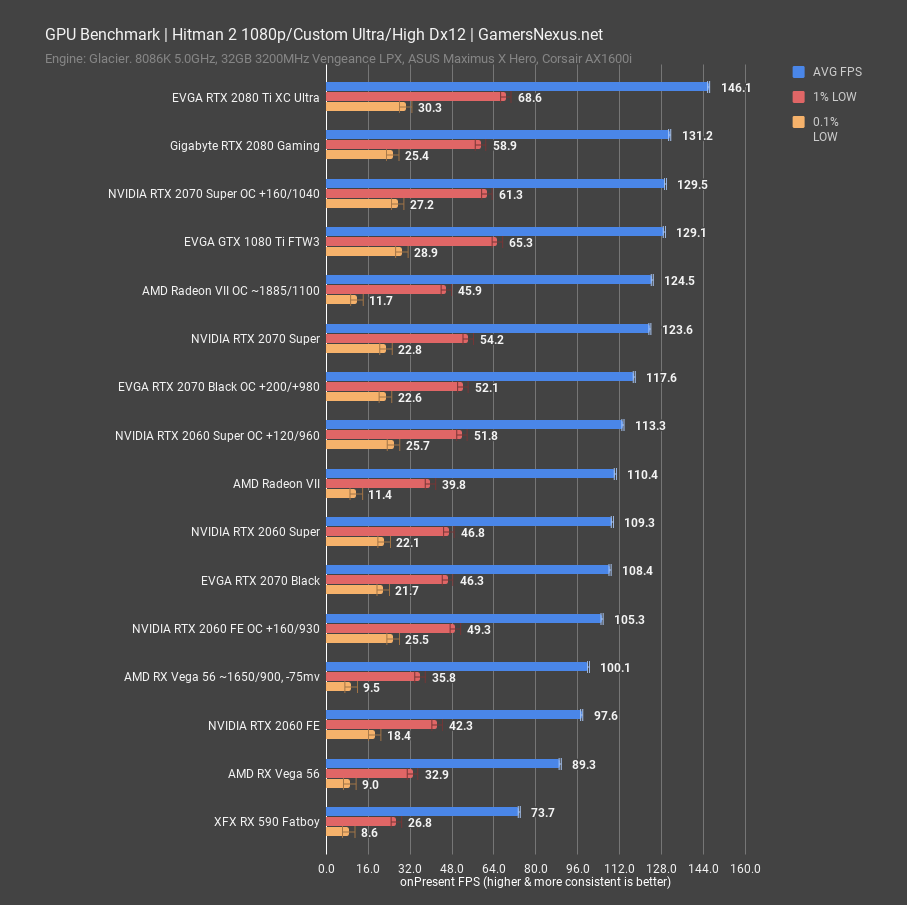
First, at 1080p and with Dx12, the RTX 2070 Super stock card ends up at 124FPS AVG, roughly tied with AMD’s Radeon VII when overclocked. The 2070 Super additionally maintains better low performance and frametime consistency. Overclocking the 2070 Super puts it about where an RTX 2080 or 1080 Ti place when stock. The 2060 Super card roughly ties with the 2070 Black, therefore also roughly tying the Radeon VII. For reference, an overclocked 2060 Super at 113FPS manages 92% of the performance of a stock 2070 Super, meaning you could forego the latter for the former and get similar performance, though obviously overclocking the latter would create a wider gap. Note also that Hitman 2’s Dx12 implementation has some serious 0.1% low issues, which is why we originally used Dx11 in our CPU testing before commenters demanded Dx12. Well, this is why we didn’t use it. We now use both for GPU to illustrate the scaling issues.
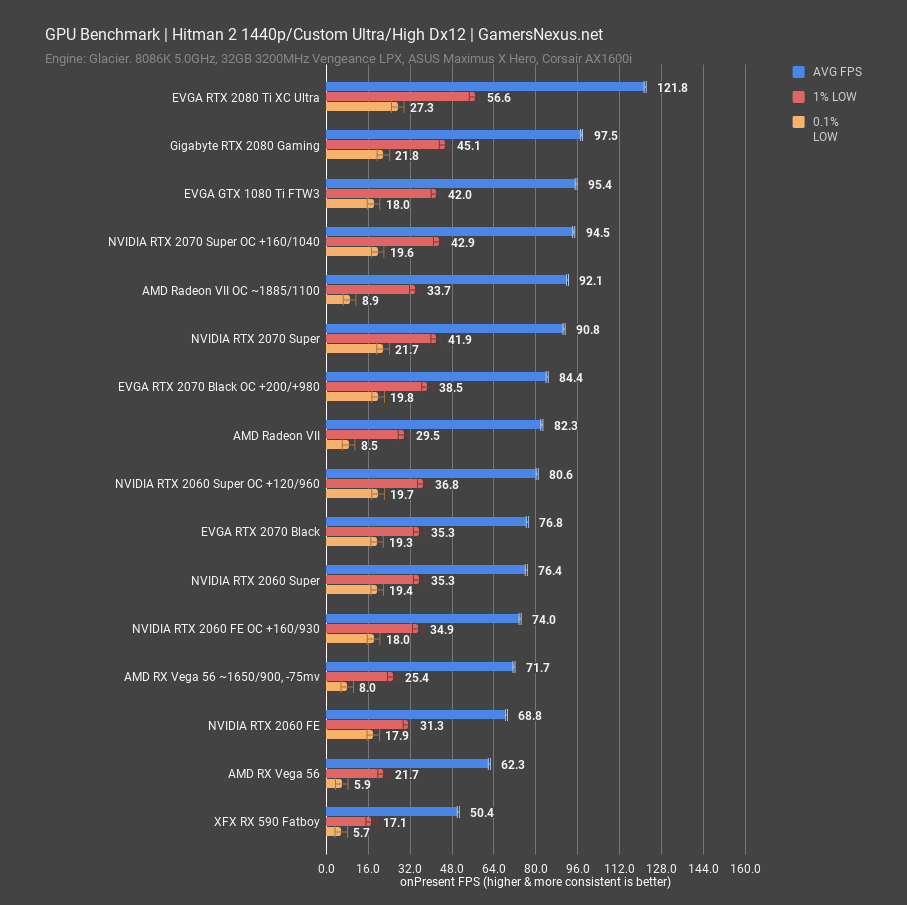
At 1440p, the RTX 2070 Super manages 91FPS AVG, the 2060 Super holds 76FPS AVG, and the 2060 FE runs at 69FPS AVG. This positions the 2070 Super as a bit better than an overclocked 2070, with an overclocked 2070 Super approaching a 2080 stock card, though not quite there.
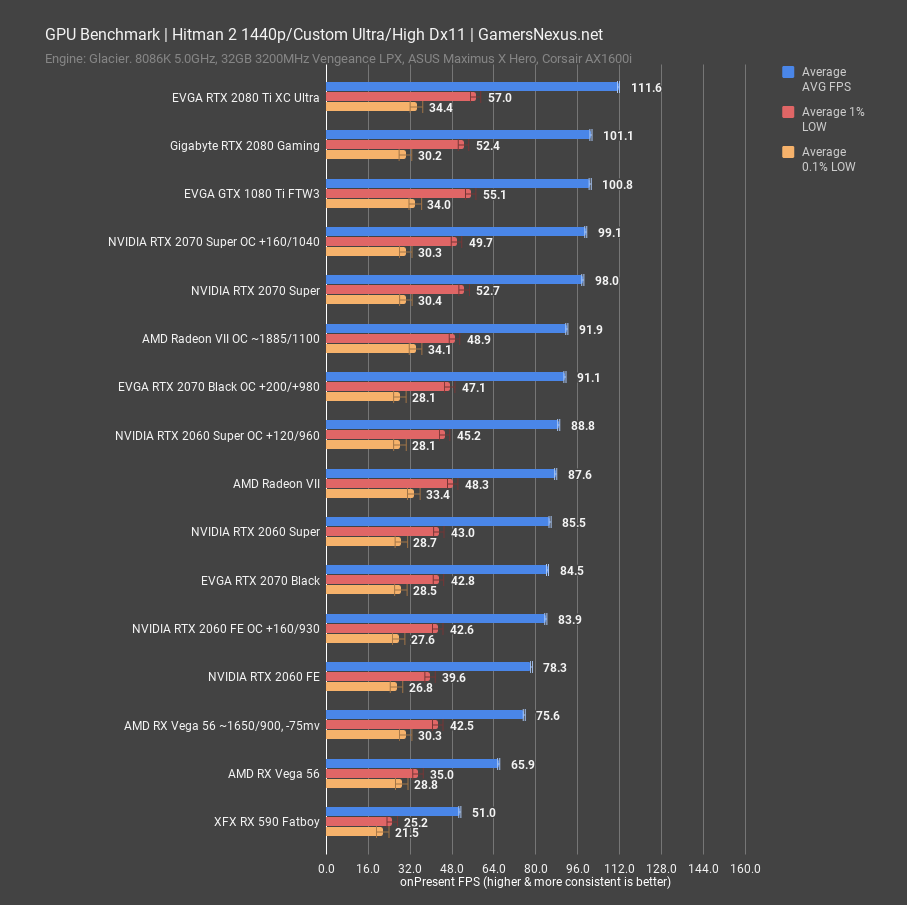
Here’s a chart of Hitman 2 with Dx11 and the same settings to compare. Everything in this game performs better with DirectX 11, with the one exception being at the very top-end with the RTX 2080 TI’s averages, although its lows are better with DirectX 11. The stack remains similar otherwise.
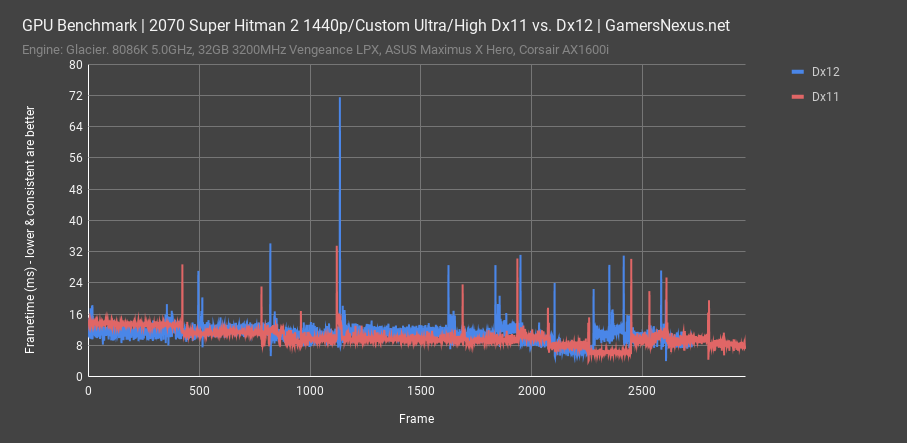
To fully illustrate the frametime consistency issue, here’s a 2070 Super card plotted with Dx11 and Dx12 runs in the same test. As you can see, the Dx12 line encounters hard frametime spikes throughout the test, but has an especially hard slam to about 70ms in the middle. This is repeatable and happens in every test, sometimes worse than others. Remember, lower frametimes are better, but it’s more important for them to be more consistent. In this instance of the 2070 Super, Dx11 is both more consistent and lower on average. For all the people who complained about our Dx11 use in Hitman in our CPU tests, this is why we chose it; also, DirectX is a graphics API anyway, but we did end up switching to Dx12 in CPU reviews by popular demand.
RTX 2060 Super & 2070 Super Power Consumption
Our GPU power testing has been completely overhauled. Instead of testing based on total system power draw and taking deltas, we’re now measuring power down the PCIe slot with a custom-built interposer and power at the PCIe cables. We could also measure 3.3V down the PCIe slot, but opted to just look at 12V power for now. At most, 3.3V tends to be about 10W. PCI-SIG allows for roughly 5.5A down the 12V lines in the slot, or about 66W max, plus some overhead for 3.3V. The total is roughly 75W down the slot. Although total system power consumption has a place, measuring only video card power for a GPU review is much more accurate and reduces our margin of error significantly. It also allows us to directly see how much power the video card takes without the noise of the system, so you can more easily figure out how much extra power you’ll need to account for.
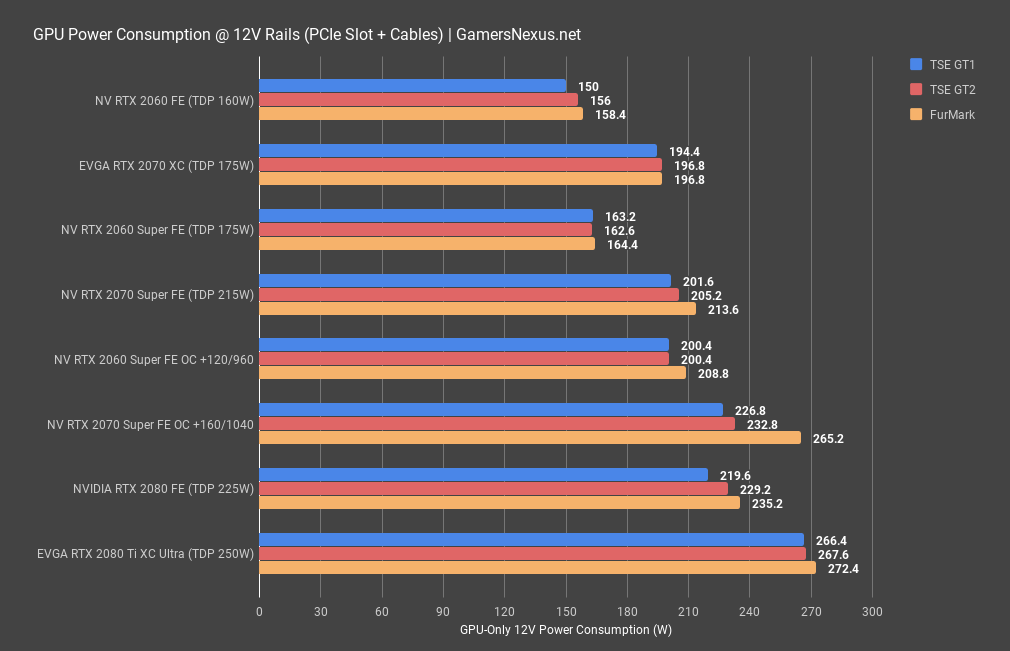
The first set of data is from some synthetic loads, although we also have a few gaming tests. 3DMark’s TimeSpy Extreme gives us a look at a GPU-heavy scenario that is similar in some ways to game execution. The 2060 Super runs at about 164.4W max across 12V. That puts it at about 10W below TDP, and so we clamped 3.3V and found about 9W more power. This puts the 2060 Super at almost exactly NVIDIA’s advertised 175W TDP and also about 10W-15W higher than the 2060 Founders Edition. The extra 4 SMs, more populated GPU, and additional memory modules account for this change. The 2070 Super ran over TDP when running FurMark, although to be fair, that’s a power virus workload. We were about at spec with TimeSpy Extreme, running around 200-205W across 12V for the Super. The other 10W, again, comes from 3.3V. We don’t have a 2070 reference card to test, so matched against the 2070 XC by EVGA, we see power as higher than the RTX 2070 XC card. The 2070 XC lists a TDP of 175W, but this is based upon the reference spec and doesn’t account for EVGA’s changes to the VBIOS and VF tables. The 2070 Super is closer to a 2080 FE in power consumption, which runs about 220-235W. That makes sense, seeing as the 2070 Super uses the same GPU as the RTX 2080 card, just with some binning done and frequency tuning. Overclocking the 2060 Super puts it at about the same power consumption as a 2070 Super, which is something to remember for later. Overclocking the 2070 Super puts it above the RTX 2080 stock power consumption. We also noted a hard spike with FurMark in this configuration, bringing us up to 265W for about 15 seconds of the test, then oscillating down to about 240W, then back up again.
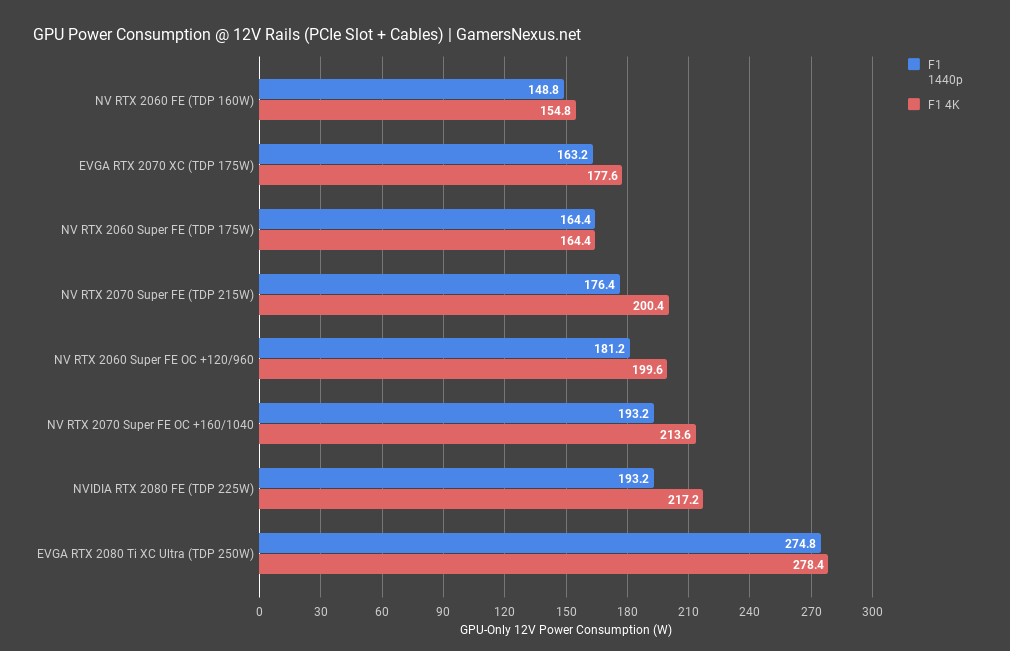
The second dataset is from a real-world gaming scenarios. The RTX 2060 Super operates at 164.4W down 12V for F1 2018 when at both 1440p and 4K, hitting a power hard power limit in VBIOS. Overclocking the 2060 Super puts it at nearing 200W with the 4K test, with the 2070 Super at about 176-200W stock. Again, the 3.3V line accounts for the rest. Overclocking the 2070 Super puts it at around 2080 levels.
RTX 2070 Super Thermals
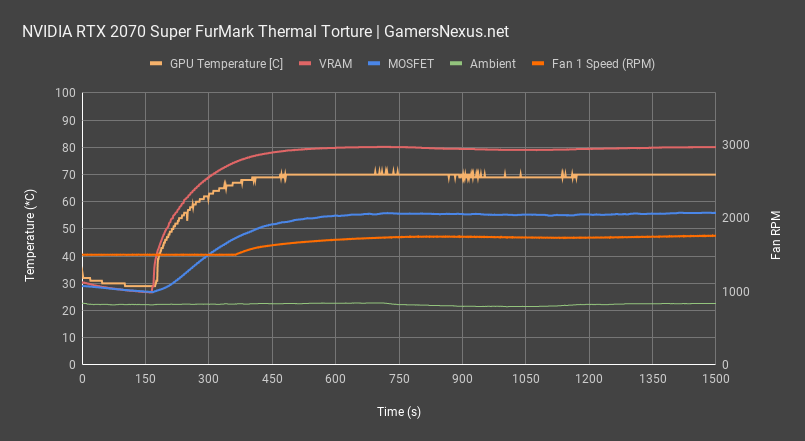
As for how the cards behave, here’s an RTX 2070 Super with thermocouples placed on the memory and the MOSFETs, giving us a read on the hotspots of the card. Thermocouples give much more accurate measurement than thermal imaging and allow us to test a cooler’s efficiency at its job. During this FurMark burn-in, the GPU temperature measured at about 70 degrees Celsius, which is about what VBIOS tries to target. The hotspot MOSFET measured at about 55 degrees Celsius, which is actually very good for a power component that can take at or beyond 125 degrees. The hotspot memory module we selected measured at around 80 degrees Celsius. This is on the warm side, especially considering that a hot case would push this toward 90 degrees, but it is still acceptable. We’d like to see improvement specifically to NVIDIA’s memory cooling, as using these cards in a closed-off case will easily push it toward the maximum acceptable temperature of about 95 degrees for GDDR6.
As for fan speed at these temperatures, the fans hit around 1700RPM and held there, producing a noise level around roughly 38dBA and 39dBA.
RTX 2060 Super & 2070 Super Founders Edition Noise Levels
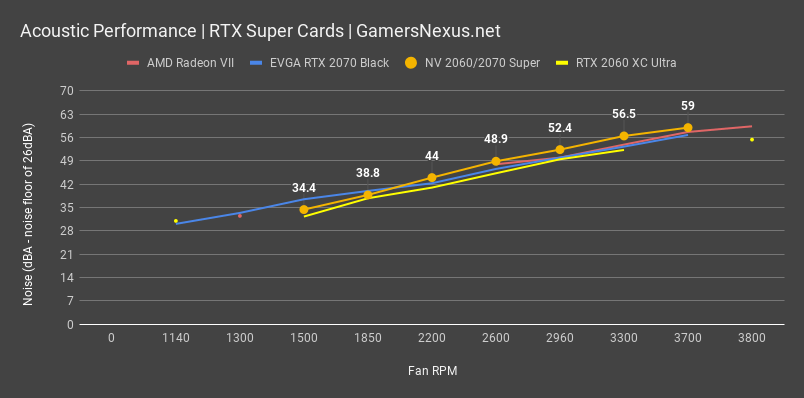
Because the 2060 Super and 2070 Super share the same fans and a similar fan curve, the only point that really matters is the RPM of the fans. The RPM will change based on your ambient and case ambient temperature, as VBIOS tries to follow a thermal target and adjust fans accordingly. In an ambient environment of about 22 degrees Celsius, we find that the fans tend to hover at around 1500RPM when idle, which is the minimum fan speed for FE coolers, and that they boost to about 1700RPM in a 22-degree environment to maintain a target of roughly 70C on the cards. Most people will likely operate closer to 30 degrees with a warm case, but the end result is that you can expect auto fan speeds to place the cards around 37-39dBA. This fan curve ramps noise levels a little more aggressively than others as it reaches higher RPMs.
Conclusion
The Super video card launch packs more punch for a refresh than we would typically expect, but it also moves the stack around in interesting ways. The 2060 Super has relatively large gains in performance that put it close to the original RTX 2070 in most instances and the 2070 Super is very nearly a 2080, although not quite. It has moved the 2070 SKU up to a TU-104 die from TU-106, though, and that’s significant.
At this point, we loop back to that same scenario: By pushing the Super cards and shuffling the price stack, even if it were purely competitive, NVIDIA has demonstrated that it has heard concerns. And if it hasn’t heard them, it very minimally has seen AMD’s Navi plans, and one of those two things makes for new products with comparatively lower prices when matched versus the phased-out predecessors.
Whichever path it was, the point is that NVIDIA ends up looking good for bringing higher-performing models down to lower prices, but will inevitably sour recent RTX buyers with a refresh. At some level, buyer’s remorse is silly – new stuff comes out all the time in this industry, and so being mad about a purchase when something new launches just doesn’t make much sense. That said, this is among the shortest refresh windows we’ve ever seen, so that’ll make some early buyers of RTX feel like the beta testers we always said they would be.
Either way, looking at the product in a vacuum of just performance. RTX Super is a compelling launch. It’d have been even better if NVIDIA started here, with RTX-ready games and better prices, but they’re here now. We’re primarily looking at rasterization performance because the RTX story has been told to death, and at this point, it’s just a matter of better implementation that’s more interesting and more widespread. Just for rasterization, performance is competitive against NVIDIA’s own cards, which does spell a difficult launch ahead for AMD’s Navi GPUs. We’ll have to come back to check on those.
Editorial, Testing: Steve Burke
Video: Josh Svoboda, Andrew Coleman