PowerColor RX 5700 Red Dragon Review: First of the Partners - Overclocking, Thermals, & Noise
Posted on
We’re finally looking at a non-XT version of the RX 5700, and the first one we received is the PowerColor RX 5700 Red Dragon, which comes with dual-VBIOS to match its dual-axial cooler. The card is a proper 2-slot design with a more muted, less gamer-y aesthetic, but more importantly, it should serve as a competitive alternative to the reference model and its cursed blower fan. The RX 5700 Red Dragon is priced at $360, about $10 over MSRP for the 5700 reference card, and comes in about $50-$60 under the 5700 XT partner models that we’ve recommended so far. Today, we’re looking at thermals, acoustics, and some gaming performance for the Red Dragon.
As we dive into this, a few notes: Like the RX 5700 XT reviews we’ve posted (Sapphire Pulse, MSI Evoke, Gigabyte Gaming OC), this will focus most heavily on thermals and noise. Because it’s the first non-XT that we’re reviewing, we’ll also look briefly at gaming impact versus reference, alongside overclocking differences. For the most part, though, we already know where the silicon performs (and you can check our Pulse review for the most up-to-date full suite of data), and so we just need to see how the cooler changes things. That’ll primarily be in noise, noise-normalized thermals, ands tock thermals.
The PowerColor RX 5700 Red Dragon is a dual-VBIOS card, with the OC VBIOS and Silent VBIOS modifying fan curve and power targets. The “Silent” option, not default, sets the power target to 155W, while the “OC” default option goes to 170W. Further, the OC VBIOS presently has some erratic fan behavior, but we’ve made PowerColor aware of the issue and the company is working on a new iteration. As this is a VBIOS issue, we aren’t concerned about PowerColor’s ability to fix this and distribute it.
As we ramp into the thermal, fan, and noise section, a few notes: AMD’s API and drivers are still buggy, and so fan reporting often exhibits erroneous spikes that do not reflect reality. When checked against an RPM gun, we see that the reported spikes to 3000 or 4000 RPM (when they’re one-second measurements) aren’t valid, and that the API is misfiring. When it’s held, that’s valid, but the one-off spikes are not. Another note, AMD’s API will also report the last-known fan speed when the fans are in zero RPM mode; although we can look at the card and see no fans are spinning, software may report “1200RPM,” for instance. Keep this in mind when looking at charts.
Test Methodology
We have overhauled the host test bench and had updated with new games. Our games selection is a careful one: Time is finite, and having analyzed our previous testing methodologies, we identified shortcomings where we were ultimately wasting time by testing too many games that didn’t provide meaningfully different data from our other tested titles. In order to better optimize our time available and test “smarter” (rather than “more,” which was one of our previous goals), we have selected games based upon the following criteria:
- Game Engine: Most games run on the same group of popular engines. By choosing one game from each major engine (e.g. Unreal Engine), we can ensure that we are representing a wide sweep of games that just use the built-in engine-level optimizations
- API: We have chosen a select group of DirectX 11 and DirectX 12 API integrations, as these are the most prevalent at this time. We will include more Vulkan API testing as more games ship with Vulkan
- Popularity: Is it something people actually play?
- Longevity: Regardless of popularity, how long can we reasonably expect that a game will go without updates? Updating games can hurt comparative data from past tests, which impacts our ability to cross-compare new data and old, as old data may no longer be comparable post-patch
Game graphics settings are defined in their respective charts.
We are also testing most games at all three popular resolutions – at least, we are for the high-end. This includes 4K, 1440p, and 1080p, which allows us to determine GPU scalability across multiple monitor types. More importantly, this allows us to start pinpointing the reason for performance uplift, rather than just saying there is performance uplift. If we know that performance boosts harder at 4K than 1080p, we might be able to call this indicative of a ROPs advantage, for instance. Understanding why performance behaves the way it does is critical for future expansion of our own knowledge, and thus prepares our content for smarter analysis in the future.
For the test bench proper, we are now using the following components:
GPU Test Bench (Sponsored by Corsair)
Component | Courtesy of | |
CPU | GamersNexus | |
GPU | This is what we’re testing! | Often the company that makes the card, but sometimes us (see article) |
Motherboard | ASUS | |
RAM | Corsair | |
PSU | Corsair | |
Cooler | NZXT | |
SSD | Plextor 256-M7VC | GamersNexus |
All memory timings are completely controlled for our new GPU testing, which has significantly tightened our error margins. Windows is version 1903. Note that some games, like GTA V and Hitman 2, have been manually tuned outside of a simple preset to ensure we have a proper benchmark. GTA V uses 2x MSAA in our testing, as it runs into engine frame limits at 187.5FPS and triggers engine-level bugs. Hitman 2 has crowd simulation and sound simulation settings that we tune back to the 4-core setting, as running higher than that creates a CPU bottleneck (and more of a CPU benchmark, as a result).
PowerColor RX 5700 Red Dragon Frequency Plot
Starting with a frequency plot will help us see how the RX 5700 non-XT compares to the XT model, but also how the reference non-XT compares to the PowerColor Red Dragon variant.
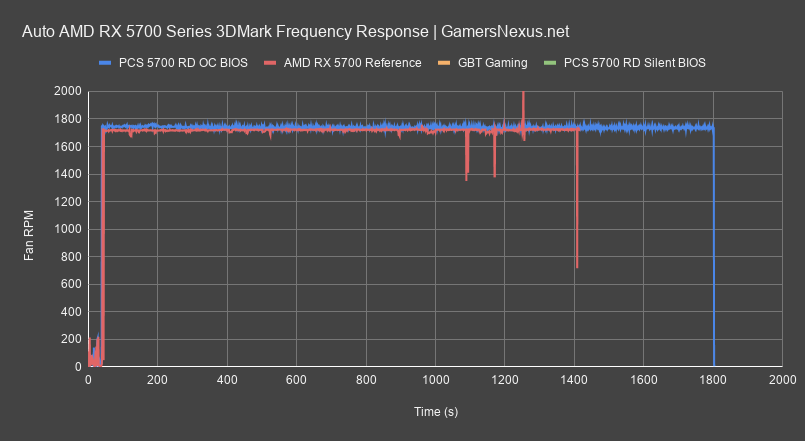
Plotting the reference line first, we can see that the RX 5700 reference model caps-out at about 1720MHz in 3DMark Firestrike Extreme. The spikes toward the end are reporting errors that occur in AMD’s API and can be ignored. The average frequency is about 1720MHz, but as we plot the PowerColor 5700 Red Dragon line, we can see that number improve toward 1740-1750MHz, offering a slight pre-overclock. The line is less consistent and fluctuates more, which is associated with bouncing off of some sort of limiter. This is typically thermal, but in the case of the Red Dragon, it’s more likely power or voltage.
Just for point of reference, we’ll also plot our most recently reviewed RX 5700 XT model, the Gigabyte Gaming OC. This card had roughly the same frequency as the Sapphire Pulse, which itself isn’t much different from the reference XT. The XT model plots at around 1880-1920MHz, a significant uplift that’ll show more in performance than the CU delta, in many games. There’s a reason AMD artificially locked the frequency, and that reason is product segmentation.
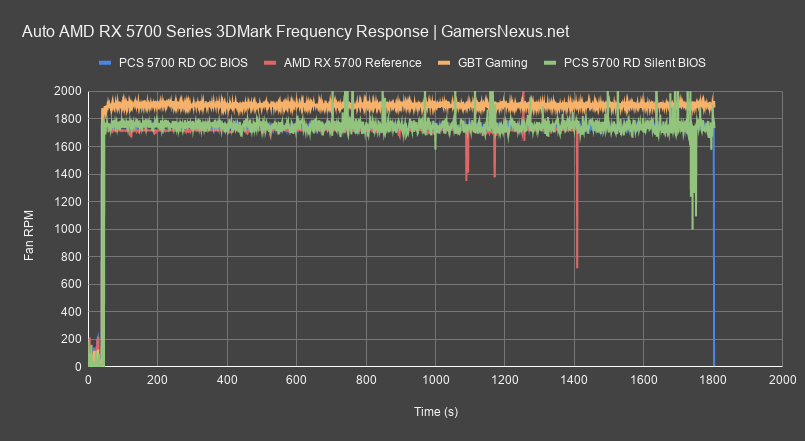
The silent BIOS fluctuates a lot more heavily and also has more erroneous spikes, but overall, ranges from 1689MHz to 1800MHz, with average frequency closer to about 1720-1730MHz. It’s not that much worse on average than the default OC BIOS, but does fluctuate more heavily and have a lower frequency floor.
PowerColor RX 5700 Red Dragon 40dBA GPU Thermals
Our noise-normalized testing is next. For the 5700 XT charts, this is starting to grow to a longer list of cards, but we’ve only just gotten our first 5700 non-XT partner model in. For now, it’s just reference and the Red Dragon.
Here’s the full chart.

Normalized to 40dBA to control for fan speed and test coolers for efficiency versus noise, the PowerColor Red Dragon Edge temperature ends up at 62.6 degrees Celsius average for the run, with the Junction temperature stretching to 75 degrees. As a reminder, Junction temperature is the maximum temperature on any single sensor across the thermal sensor network on the die, and so helps to illustrate potential mounting issues or weaknesses in the cooler. this 15-degree delta isn’t that bad when compared to some other cards we’ve tested, and overall, the Red Dragon is looking reasonable when tested in a vacuum. The world isn’t a vacuum, though, and until we get other partner cards in, we can at least add reference to the chart.
The AMD RX 5700 reference card runs a GPU Edge temperature of about 87.2 degrees Celsius average, whereas its Junction temperature hits 99 degrees Celsius average. The reference design is struggling to keep up when forced to lower noise levels than it would typically run under this load, and so where the PowerColor card is completely fine and well below spec, the reference card would be throttling in a case with a warm ambient. Remember that our ambient temperature is just 21 degrees Celsius, while a modern case could easily be in the 30s in our ambient temperature. If you’re in an area of the world where ambient is higher, that also needs to be factored in. The Red Dragon is superior here.
PowerColor RX 5700 Red Dragon 40dBA VRM & VRAM Thermals

Looking next at GDDR6 and VRM MOSFET temperatures under the same 40dBA noise-normalized configuration, the PowerColor Red Dragon GDDR6 measurement reads an average of 68 degrees Celsius, with the VRM MOSFET measurement at 57 degrees. This is way below spec and is well-cooled for both. The MOSFET can handle well over 100 degrees and the GDDR6 module can take a bit over 100, so we’re not even close to danger even in a worst-case chassis. The reference card reported a GDDR6 temperature of 88 degrees, with the MOSFET at 71 degrees. The GDDR6 modules are getting heated, here, and transplanting into an actual case would start to push the capabilities of the design if trying to retain a lower fan noise. If allowed to run Auto, yes, the 5700 blower cooler could handle it, but you’d also be looking at 50+dBA of noise at a 20” distance, by our measurements. In the end, it’s all about comparatives: The Red Dragon card, comparatively, is doing much better here. It’s just a question if other partner models beat the Red Dragon.
PowerColor RX 5700 Red Dragon Auto Setting Thermals
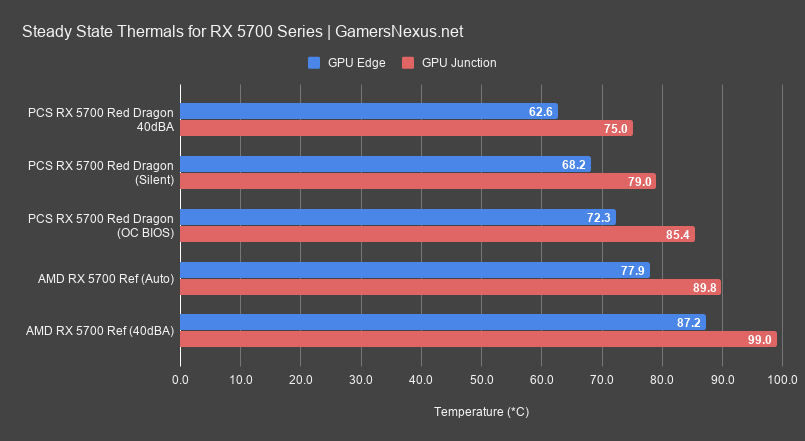
Finally, with regard to auto settings, this quick steady state chart shows thermals when the cards are allowed to operate automatically, unless otherwise noted. If you want XT thermals of the same variety, check our recent Gigabyte Gaming OC review for those.
For this one, the Silent VBIOS seems to stick the fan speed to around 1200RPM average while at 155W GPU power. The OC BIOS sticks closer to 1300RPM, but also has a power target of 170W. That extra 15W generates heat, naturally, and so we see the OC BIOS running warmer while retaining a similar fan speed to the original results. For comparison, 40dBA is about 1800RPM, so we’re increasing the noise level baseline on this card, but decreasing it on the reference model. The self-regulated fan speeds have the OC BIOS GPU Edge temperature at 72 and Junction at 85, while the Silent BIOS runs 68 degrees and 79 degrees.
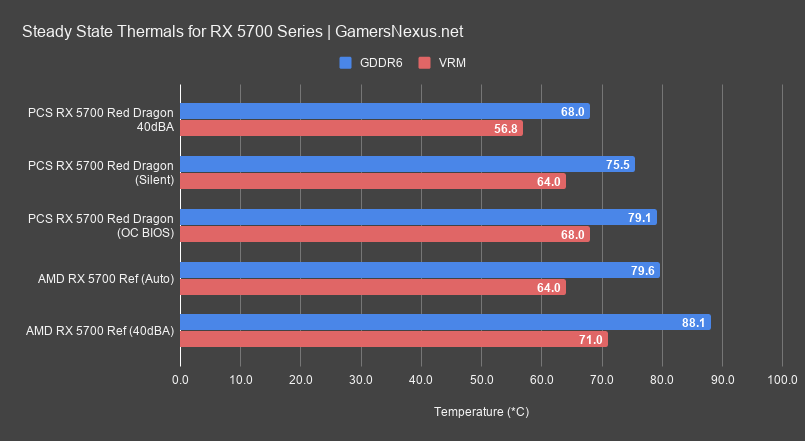
For GDDR6 and VRM MOS temperatures, the Silent model runs at around 76 degrees for GDDR6, thanks to the reduced heatload spreading from the GPU, while VRM MOS temperatures are at around 64. The OC BIOS sits closer to 80 degrees and 68 degrees, but doesn’t aggressively ramp fan speed, either. The reference card under auto settings averages about 80 degrees for GDDR6, for reference, but is significantly louder.
PowerColor RX 5700 Fan-Frequency Response
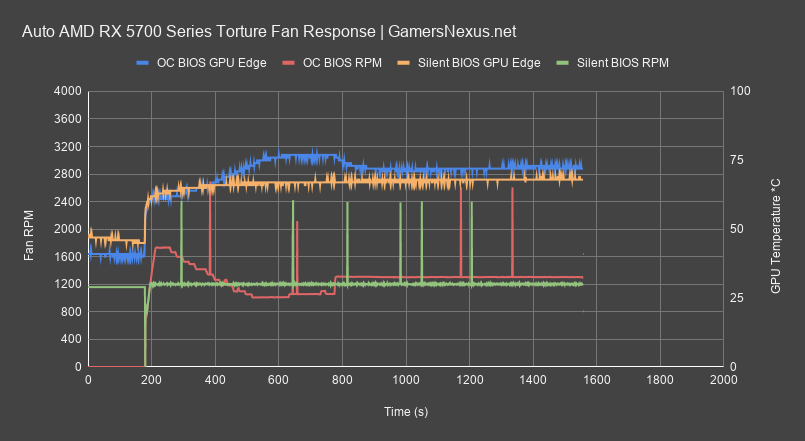
Fan behavior was a bit odd for this one. We retested the OC BIOS a few times because we had some issues where it sometimes wouldn’t apply or recognize properly, ultimately a fault of AMD’s drivers. Eventually, when it applied properly, we noticed that the fan curve doesn’t dictate ramping hard until about 90 degrees GPU temperature, which we didn’t reach during a FurMark workload. With temperature closer to 74, the fan only ever ramps to about 1300RPM. We also noticed that the fan pushed harder at the outset, exhibiting erratic behavior that was validated with physical measurement tools (reminder: the one-off spikes north of 3000RPM are invalid, but the sustained behavior is valid). This unpredictable ramp is being fixed by PowerColor in an upcoming VBIOS.
When we talked with PowerColor about the anomalous fan speed ramping at the beginning of the curve, something that shouldn’t be happening, the company noted that it has recently become aware of the issue and that it is likely going to re-issue a new OC BIOS version to conform the fan curve to a more normal behavior.
PowerColor RX 5700 Overclocking
As we’ve said before, overclocking is more dictated by the GPU and memory silicon than it is by the cards. This gets a bit different for the RX 5700 series, where AMD has artificially locked-down the memory and GPU overclocking alike; further, frustratingly for us, we’ve found our RX 5700 series cards overclock memory significantly better than our 5700 XT cards, which is more likely a luck-of-the-draw matter than anything else. Too bad it’s not easily swappable. Also, as a final note, these limitations can be bypassed with the MorePowerTool and we’ve done it in streams, but we’re not doing it here. We don’t see that as a part of the core review process and, if we do any unlocking of these cards, we’ll save it for a separate content piece.
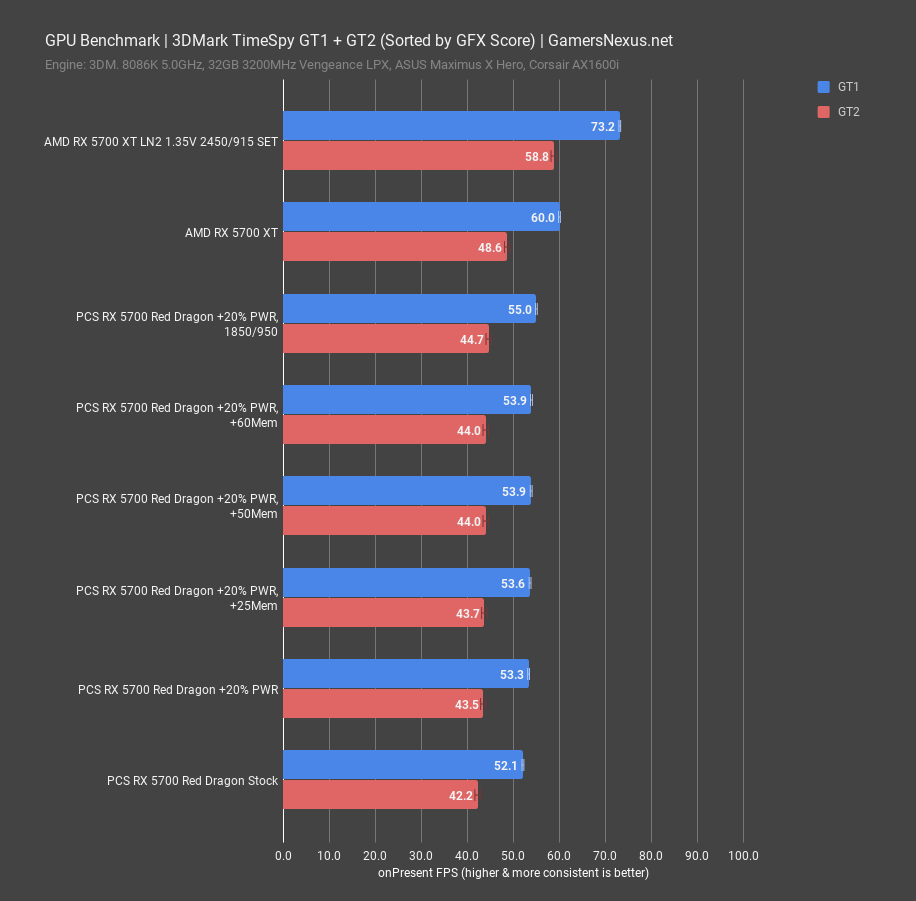
This chart shows 3DMark TimeSpy results for GT1 and GT2. We’re only going to show RX 5700 series scaling so that it’s cleaner and easier to see how the changes impact performance. For comparisons versus the RTX series, you can check some of our other recent reviews. We are sorting by total score, not shown here, as it’s a combination of the two GT scores. The RX 5700 Red Dragon ended up at 52.1FPS AVG for GT1 – the GPU core workload – when fully stock, with a 42.2 GT2 score stock. Adding +20% power allowance brings score up significantly, moving to 53.3 GT1 and 43.5 GT2. If 1FPS doesn’t sound like a lot, keep in mind that this is a synthetic test, and that every 1FPS becomes a big deal given its consistency in testing. The change in score, not listed here, is 7648 points to 7850 points averaged. That’s a 2.6% gain from just increasing power target. We were also able to bump memory all the way up to 930MHz and still see gains, at which point we’ll need MorePowerTool to unlock further overclocking headroom. With this configuration, we hit 53.9FPS AVG for GT1, or 44FPS on the more memory-bound GT2 test. The end result is a gain of about 4.3% performance just in the GT2 memory test, which is a large gain for only memory overclocking and extra power. Versus just the +20% power number of 43.5, we gained 1.2%. Overclocking the core and memory to final values got performance up to 55FPS GT1 and 44.7 GT2, posting a top-to-bottom change of 5.7% by the total scores. That’s a jump from 7647.5 points with the stock setup to 8081 points with the 1850MHz/930MHz setup. This is also why AMD locked-down these cards, because the gap between the stock XT and the non-XT with an overclock is about 9%, which we should be able to overcome with modding. Of course, you can always overclock the XT, too, so that CU advantage will benefit it eventually. Not every game cares, though.
PowerColor RX 5700 Gaming Results
We’re only going to show a few gaming results here. Again, for the full suite of gaming benchmarks, we’d encourage checking our RX 5700 XT Pulse review, as that has some of the most updated information. For this one, since we’ve already established baseline 5700 non-XT performance, we just need to show the average delta from the partner model PowerColor card. We’re also sticking to the higher-performing OC BIOS for these. The Silent BIOS drops 15W, and so will have reduced performance closer to the 5700 non-XT reference card.

The RX 5700 reference card ran at 110FPS AVG, with lows at 91 and 79FPS for 0.1%. The RX 5700 Red Dragon card with the stock BIOS position – that’d be the OC BIOS, but it’s not overclocked by us – operated a 113FPS AVG with picked-up lows accordingly. The gap is about a 2.4% improvement, which is similar to what we saw with the MSI Evoke RX 5700 XT card when tested against the RX 5700 XT from Sapphire and AMD. Overclocking the RX 5700 stock model to its limits did improve our averages to 114FPS, but we started dropping frames in the low department and experienced instability that caused more frametime deviation from the mean, thus creating a worse experience in spite of technically higher averages.
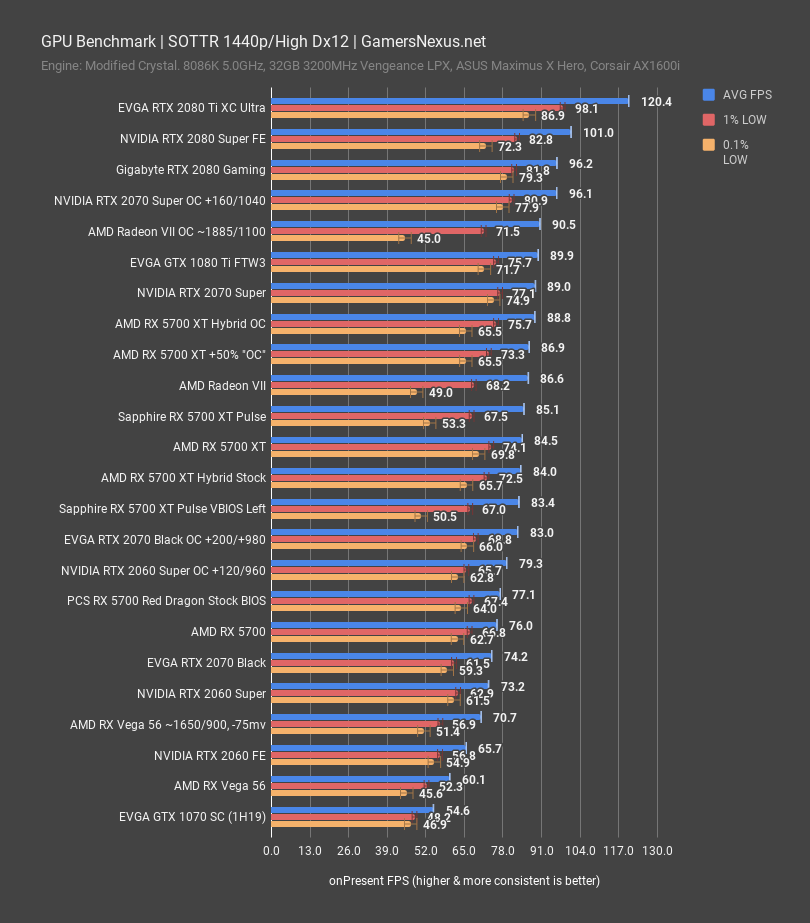
At 1440p in the same game, the Red Dragon card managed 77FPS AVG versus the reference 76FPS AVG, which isn’t quite within our run-to-run variance of 0.2FPS for this game, but it’s awfully close. Even if it’s not error, it’s still imperceptible and irrelevant. You’re not buying these cards for the extra frames out-of-box, you’re buying them for quality of life improvements to thermals and especially noise. We won’t bother going into 4K results here – it’s the same type of scaling, just a lot harder on this particular card.
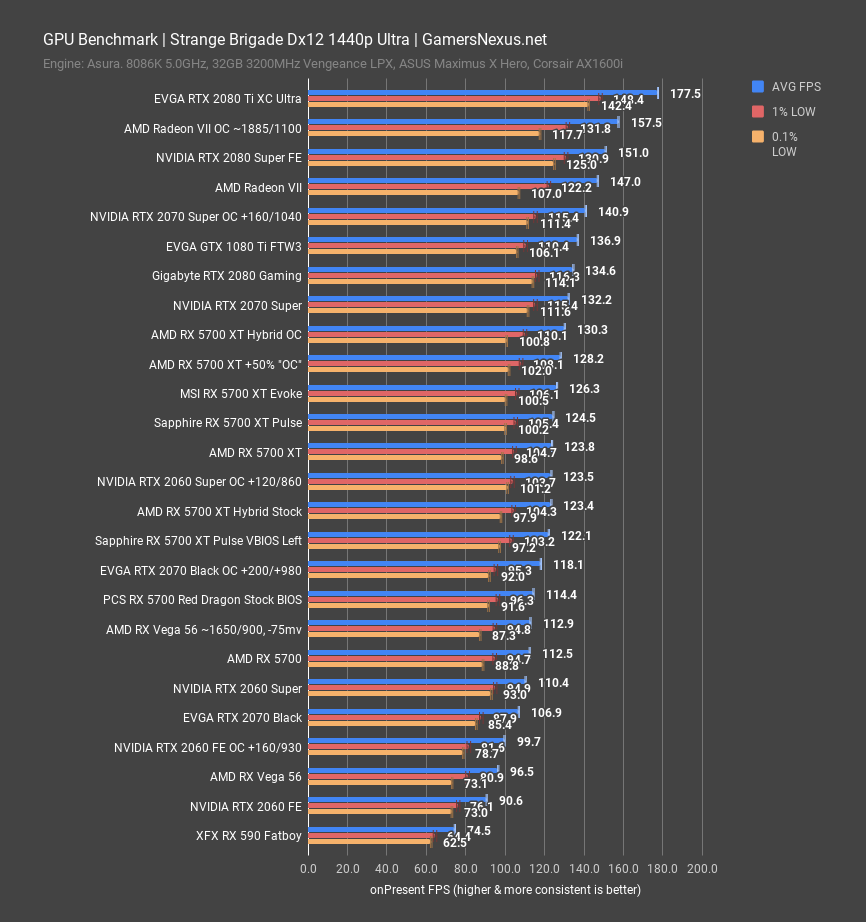
Strange Brigade is next. Although we do testing with both Vulkan and DirectX 12 for this one, we’ve shown that AMD sometimes has a slight advantage in Dx12 for this game’s implementation. Either way, it’s never more than a couple percent swing and typically favoring Dx12 for AMD cards. The RX 5700 non-XT reference model performed at 112.5FPS AVG, with lows reasonably close behind and within the pacing we’d expect for frametimes. The RX 5700 Red Dragon placed at 114.4FPS AVG, a gain of about 1.7% over the reference model. Overclocking will vary chip-to-chip, but obviously these could begin encroaching on RX 5700 XT levels with some overclocks, assuming you don’t also overclock the 5700 XT.
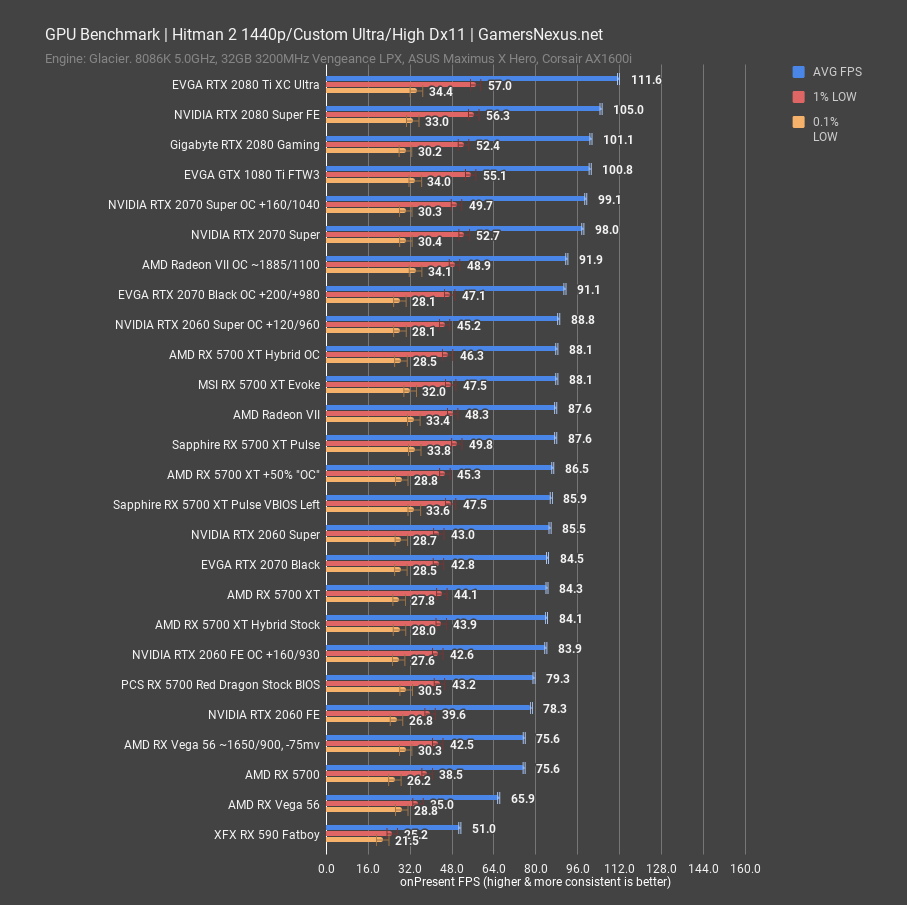
We’ll throw Hitman 2 with DirectX 11 in here as well. Hitman 2 runs like garbage on Dx12, something we’ve shown before, as its frametime consistency is all over the place. With Dx11, the 5700 ran at 75.6FPS AVG, with the Red Dragon at 79.3FPS AVG. The delta is about 4.8%, one of the bigger gaps we’ve seen.
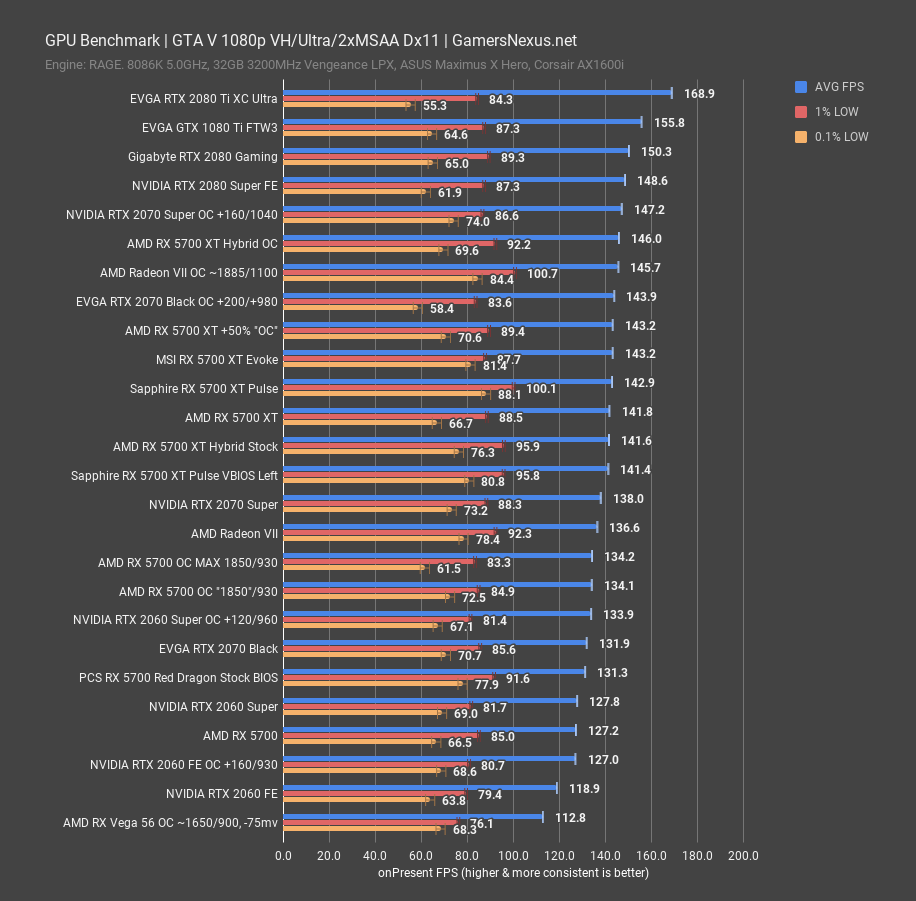
Finally, with GTA V at 1080p, the RX 5700 ran at 172FPS AVG, while the Red Dragon hit 131FPS AVG with improved lows. The overall gain is about 3.1%, which isn’t bad for just a card purchase. This is all out-of-box for both, so we should note that it’s possible to get the reference card up to this level without much work, but the reference cooler isn’t great anyway, so no point in defending it.
Conclusion
The PowerColor RX 5700 Red Dragon does well overall when compared to the reference card. Like the XT series, board partners don’t grant some magical, massive uplift to performance, and so the gains are primarily quality-of-life features. These include better thermals, better noise levels at those thermals, custom PCB designs, and potentially support services. PowerColor does offer a 1.5% to ~4.5% performance hike in games, but overall, this isn’t anything the reference card couldn’t also be made to achieve. It’s not the framerate we care about, it’s the thermal performance. In that department, PowerColor excels versus the reference design, and we see no issues outright with the thermal solution. A tear-down will be posted separately to our YouTube channel.
The biggest question now is whether other board partners do it better than PowerColor, and we’ll look into that as we receive more cards to review. It is certainly better than reference, and at the price, we’re OK recommending its purchase – though we do want to look around at other options to see if anything better exists at a similarly competitive price. Stay tuned for that.
Editorial, Testing: Steve Burke
Video: Josh Svoboda, Andrew Coleman