We’ve reviewed an onslaught of cards from the RX 5700 series, including the RX 5700 and XT reference models, the Sapphire Pulse XT, MSI Evoke XT, and RX 5700 Red Dragon by PowerColor. Today, we’re looking at another non-XT model: The Sapphire RX 5700 Pulse is going head-to-head with the PowerColor RX 5700 Red Dragon, with the AMD Reference card tagging along to provide some much-needed perspective that, although there will only be one winner between these two AIB cards, both are a massive upgrade over AMD’s blower design.
As a reminder that’s hopefully unnecessary, the real difference from one board partner card to the next hinges upon thermals and acoustics, not necessarily gaming performance. There certainly can be a gaming performance impact, but this is typically limited to less than 2% change in performance from baseline for the RX 5700 series cards. AMD already maxed the silicon as much as it could and boosting isn’t as sensitive as NVIDIA cards; further still, the AMD RX 5700 non-XT model is artificially limited (without modifications, which are possible) to a SET frequency of 1850MHz (not necessarily GET). This, along with maxing the silicon, relegates most changes from cards to what we call “quality of life” features, like significantly reduced noise levels, PCB designs that might be more accommodating to one case or another, and reduced thermals. VBIOS power limitations are also at play, where VBIOS changes can allow cards to draw more power than reference, but won’t necessarily yield performance benefits as a result. Finally, another useful feature present on both the Sapphire and PowerColor models is dual VBIOS, which allows a backup if the user botches a flash.
Test Methodology
We have overhauled the host test bench and had updated with new games. Our games selection is a careful one: Time is finite, and having analyzed our previous testing methodologies, we identified shortcomings where we were ultimately wasting time by testing too many games that didn’t provide meaningfully different data from our other tested titles. In order to better optimize our time available and test “smarter” (rather than “more,” which was one of our previous goals), we have selected games based upon the following criteria:
- Game Engine: Most games run on the same group of popular engines. By choosing one game from each major engine (e.g. Unreal Engine), we can ensure that we are representing a wide sweep of games that just use the built-in engine-level optimizations
- API: We have chosen a select group of DirectX 11 and DirectX 12 API integrations, as these are the most prevalent at this time. We will include more Vulkan API testing as more games ship with Vulkan
- Popularity: Is it something people actually play?
- Longevity: Regardless of popularity, how long can we reasonably expect that a game will go without updates? Updating games can hurt comparative data from past tests, which impacts our ability to cross-compare new data and old, as old data may no longer be comparable post-patch
Game graphics settings are defined in their respective charts.
We are also testing most games at all three popular resolutions – at least, we are for the high-end. This includes 4K, 1440p, and 1080p, which allows us to determine GPU scalability across multiple monitor types. More importantly, this allows us to start pinpointing the reason for performance uplift, rather than just saying there is performance uplift. If we know that performance boosts harder at 4K than 1080p, we might be able to call this indicative of a ROPs advantage, for instance. Understanding why performance behaves the way it does is critical for future expansion of our own knowledge, and thus prepares our content for smarter analysis in the future.
For the test bench proper, we are now using the following components:
GPU Test Bench (Sponsored by Corsair)
Component | Courtesy of | |
CPU | GamersNexus | |
GPU | This is what we’re testing! | Often the company that makes the card, but sometimes us (see article) |
Motherboard | ASUS | |
RAM | Corsair | |
PSU | Corsair | |
Cooler | NZXT | |
SSD | Plextor 256-M7VC | GamersNexus |
All memory timings are completely controlled for our new GPU testing, which has significantly tightened our error margins. Windows is version 1903. Note that some games, like GTA V and Hitman 2, have been manually tuned outside of a simple preset to ensure we have a proper benchmark. GTA V uses 2x MSAA in our testing, as it runs into engine frame limits at 187.5FPS and triggers engine-level bugs. Hitman 2 has crowd simulation and sound simulation settings that we tune back to the 4-core setting, as running higher than that creates a CPU bottleneck (and more of a CPU benchmark, as a result).
40dBA GPU Thermals EQ
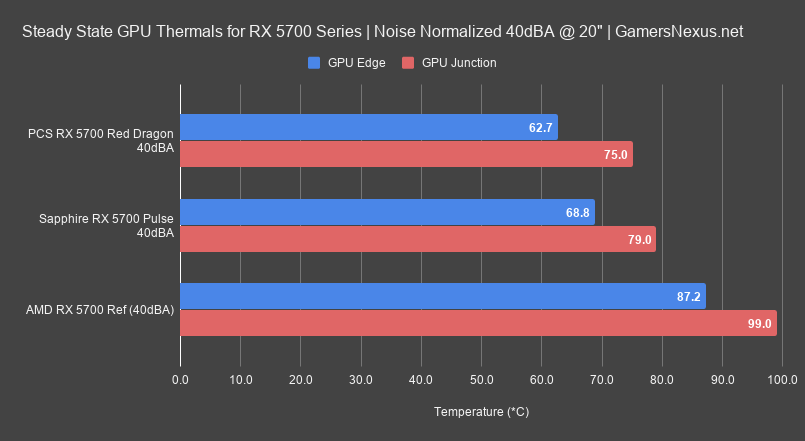
Noise-normalized GPU thermals are up first. We’re starting to fill this chart out now; it still needs more cards as they slowly come in for testing, but we can at least get started with thermals across the Red Dragon, Sapphire Pulse, and AMD reference cards. Our first chart will show all three devices as normalized to 40dBA at a 20” distance, thus allowing us to better understand the effective cooling efficiency of each cooler when configured to a fixed noise level. Without doing this, you’re really just testing the temperature target of each VBIOS, which means that whoever has the lowest temperature target – and likely the highest, loudest RPM – would “win” the chart. We’ll look at that too, as it’s an important test for the majority of users who leave their cards auto controlled, but this gives us a better idea of the best thermal solution designs overall.
Let’s get that chart on the screen. At 40dBA, the GPU-only thermals for the Sapphire RX 5700 non-XT Pulse have it at about 68.8 degrees Celsius for GPU Edge temperature. Note that, unlike our case and cooler reviews, this isn’t a Delta T over ambient value. Ambient temperature is heavily controlled to 21 degrees Celsius for these tests, with any deviation controlled for with modifiers. We log ambient temperature every second with a logging meter at intake, then account for ambient swings when necessary. At 68.8 degrees, the Pulse has a higher GPU Edge temperature and temperature target than the PowerColor Red Dragon did at the same noise level, positioning it warmer in Edge temperature and in the more important J unction temperature. The Junction delta is about 4 degrees between the two when configured to 40dBA. PowerColor is winning in this comparison, although Sapphire’s Pulse does hold a significant lead over the reference design, clearly, with a 20-degree gap at 40dBA versus Junction on the blower cooler, or a similarly high gap versus the Edge temperature.
40dBA VRM & VRAM Thermals
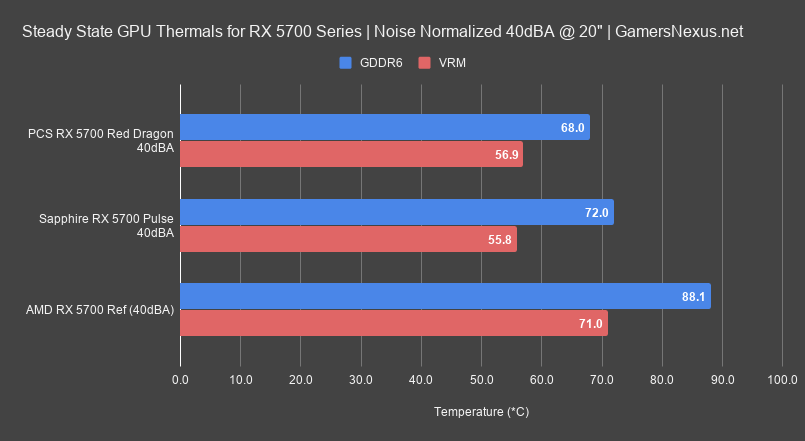
GDDR6 and VRM thermals are next. For this one, the Pulse and the Red Dragon are so far below the point of concern on either GDDR6 or VRM MOS temperatures that they have become functionally irrelevant. We look at these numbers to see if anyone seriously screws up the cooling on non-GPU components, as seen with thermal pad choices on some cards we’ve worked on in recent and distant past alike. In this instance, no one has screwed up and both improve over the reference design significantly. Our concern with reference is that it’s getting hot enough that use in a warm case, especially one where the CPU is also producing a heat load, could easily push the GDDR6 temperatures north of 100 degrees if bringing noise levels down with manual fan RPMs. The Red Dragon and Pulse aren’t anywhere close to danger territory. At 68 and 72 degrees Celsius GDDR6, the Red Dragon maintains a technical victory, but that’s all it is. It’s a technical win because it’s, well, technically superior, but it’s also a meaningless delta between these two. The delta versus reference is meaningful, and both hit that mark. Lower GDDR6 temperatures don’t give you better clocks, so all that’s important is that it isn’t high enough to go north of 100 degrees in a warm case and warm room ambient temperature. VRM MOS temperatures are so low that it’s completely irrelevant. These cards just aren’t pushing enough power to drive the MOSFETs that hard, and good cooling solutions further this. The Pulse holds a technical victory in this instance, although nearly error, but it’s not meaningful.
Fan-Frequency Response
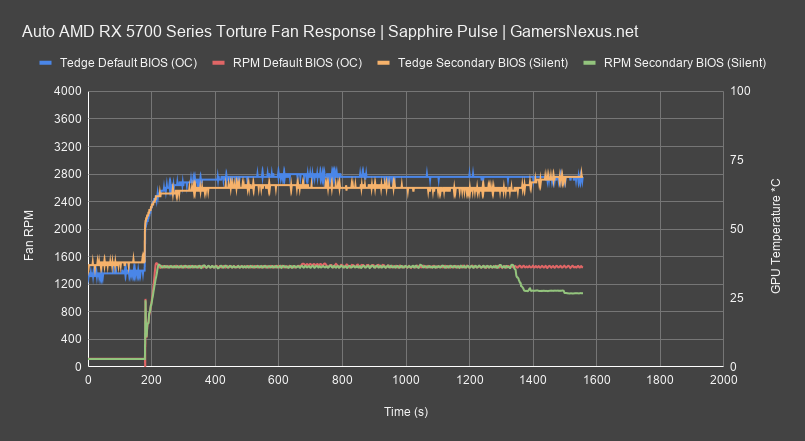
The fan response will help us better understand the differences between each VBIOS on the card. The default position is the higher power target VBIOS, toward the PCIe cables, whereas the position toward the back is the lower power target configuration.
In this test, we see that fan RPM on each is not any different – the Pulse ends up plotting at about 1450RPM for each VBIOS option when left to self-regulate versus power and GPU thermal targets. Fan curves will adjust based upon GPU temperature, so we like to run some tests without any eternally imposed controls to better understand stock behavior. With both fan RPMs at the same speed, one could postulate that GPU temperature is the same. In this instance, we see that it’s not – the higher power VBIOS plots at about 70 degrees Celsius on average, while the secondary VBIOS runs about 4-5 degrees cooler throughout the test, up until the end where the fan RPM spontaneously dropped-off. Upon further inspection, it looks like the temperature was sitting just below the threshold for the next fan speed hike, so maybe that caused RPM to drop since it wasn’t past the next temperature threshold. It could also be a bug between the drivers and BIOS – we’re not quite sure, but it fell from 1450RPM to about 1100RPM. This would make more sense for a “silent” BIOS setting anyway, but it did not seem to apply until late in the load cycle. It’d also make sense that thermals are set to the same 70-degree target, and so a lower power target and lower RPM target would combine to allow the same temperatures but lower noise, ergo “silent” naming for the VBIOS.
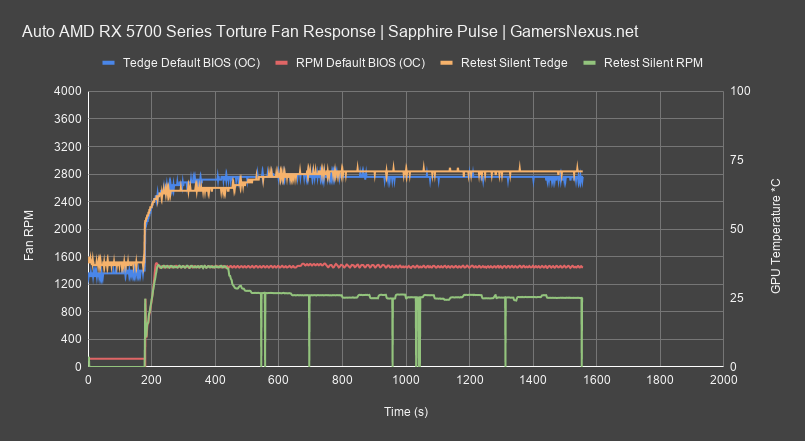
To research this further, we ran another test pass with silent and logged it again, just to see if it was a fluke. Behavior was similar at first – you can see the fan ramped to 1450RPM initially – but it fell to about 1000RPM after that. The dips to 0 are reporting errors in AMD’s API and should be ignored. The real take-away is that the retest shows it as once again closer to 1000RPM, but also repeats the boosted fan at the beginning. We also observed similar behavior with PowerColor’s card, so we’re not sure if this is an AMD issue or a BIOS issue, but we’re leaning toward VBIOS. The fan is ramping too aggressively at the beginning of the workload. GPU temperature is close to the OC BIOS result.
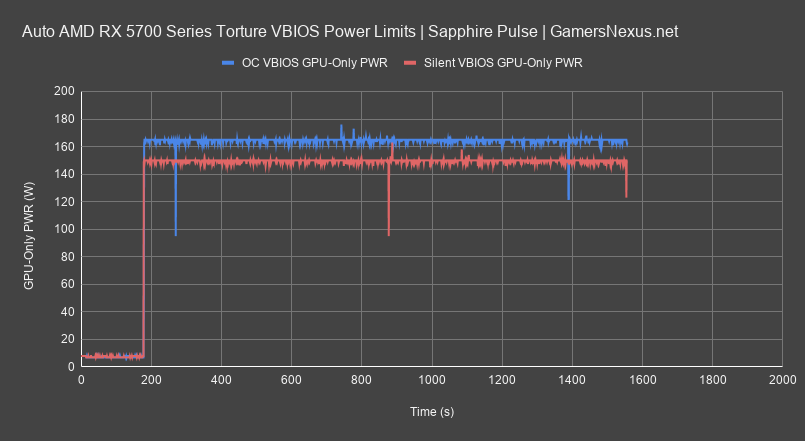
To explain why the temperature was lower at the same RPM, though, we can look at this plot of GPU-z logged power readings. We wouldn’t rely on this reading for card-to-card power consumption, as we can get more accurate numbers with our interposer setup, but critically, this is what the GPUs are looking at when running off of their own power limits. The OC VBIOS is allowed to draw 165W for GPU-only power, ignoring GDDR6 power and VRM efficiency losses, while the silent VBIOS drops down to 150W. This 15W gap is similar to the PowerColor card’s configuration, although PowerColor runs 170W for OC and 155W for Silent.
Auto Setting Thermals
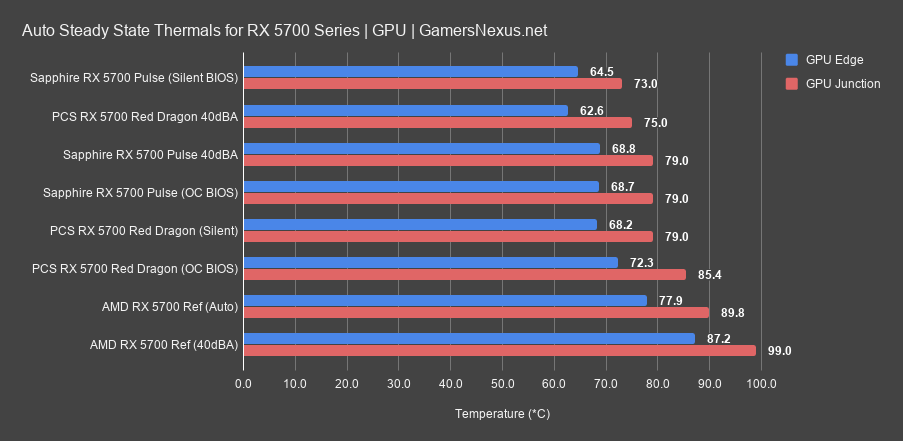
This thermal chart will give the full sweep of auto settings for each VBIOS on each of the two cards, plus some reference 5700 numbers and 40dBA numbers. Sorting by Junction temperature first, the Sapphire RX 5700 Pulse with Silent BIOS has the lowest GPU Junction temperature, but only when we average during the 1450RPM fan speed. If averaging after the drop to 1100RPM, it ends up the same as the OC BIOS thermals. Also note that the Silent BIOS is running at the lowest power target between all four permutations of the AIB partner cards, so it makes sense it’s coolest. Junction is at 73 for this, with GPU Edge at 64.5. The PowerColor Red Dragon at 40dBA is next, followed by the Pulse at 40dBA, but we already talked about those results. The Pulse with OC BIOS follows, at 79 degrees J unction and 68.7 degrees Edge. This is next followed by the Red Dragon with its Silent VBIOS, which lowers power target to 155W, then the Red Dragon with OC BIOS at 85.4 degrees Junction and a 170W VBIOS allowance. After all of these numbers, it’s the reference cards.
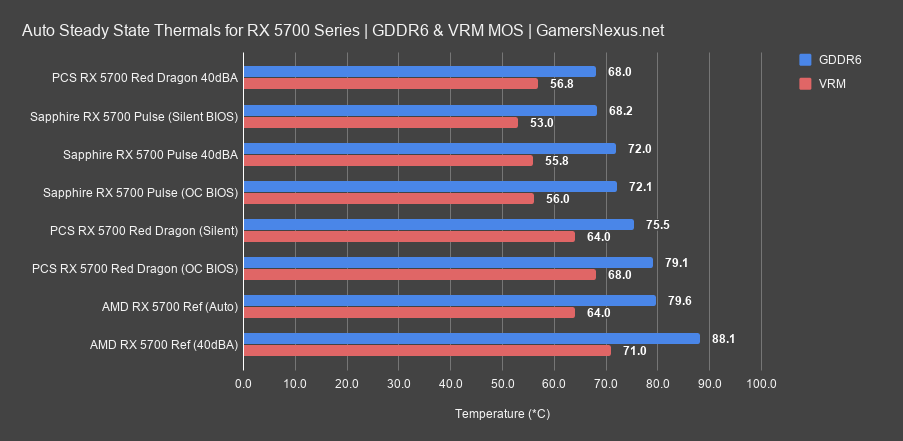
The GDDR6 and VRM thermals are next for the steady state averages. In this one, the only change to the stack is the Red Dragon at 40dBA and the Pulse with Silent VBIOS. Everything else stays in its original hierarchy. No one has exceptionally bad thermals on this chart, although reference is in “bad” territory with its 88-degree GDDR6 result. This will become worse, again, in a case or in a warm environment. The rest, though, is all sort of irrelevant.
Frequency
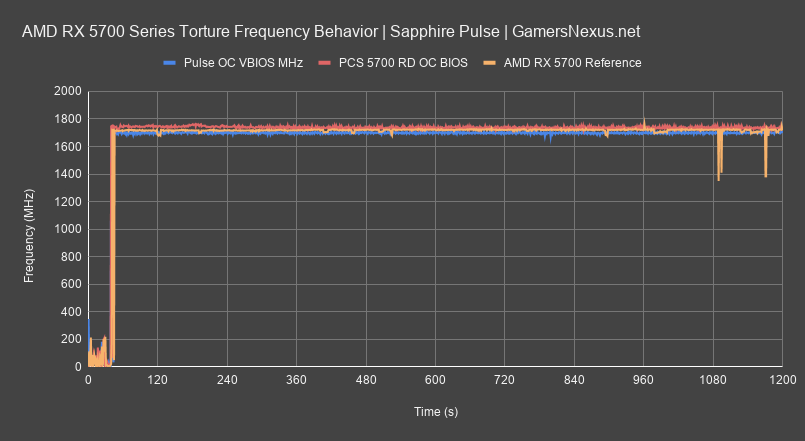

Frequency-over-time will be our last set of charts. First, we’re looking at just the Sapphire Pulse and its Silent versus OC VBIOS options. With the OC VBIOS, frequency averages around 1705MHz flat, whereas the Silent VBIOS runs at about 1670MHz average, sometimes hitting 1680MHz.
The next frequency plot will show comparisons to the reference card and the Powercolor Red Dragon 5700 card. The Sapphire Pulse OC VBIOS remains where it was a moment ago, as it’s the same data, but the PowerColor Red Dragon ends up at about 1730-1750MHz. That puts it about 30-45MHz higher on average, while the RX 5700 reference card lands roughly the same as the Pulse’s peak line, occasionally crossing over in either direction.
Conclusion
The PowerColor RX 5700 Red Dragon has a few technical victories over the Pulse in this testing (noise-normalized), although both cards are significantly improved over baseline and aren’t too distant from each other. Deciding between the cards should mostly be governed by the following: Price, availability in a region, then thermals (to a minor degree), and finally looks. If you’d prefer the slightly better thermals and ~1.5% higher gaming performance (the latter is irrelevant, frankly), then the PowerColor Red Dragon makes the most sense; that said, if the Red Dragon is unavailable in your region, the Pulse is completely fine as a stand-in. We aren’t bothered by either card and would buy based on price and availability. Assuming all is equal, the Red Dragon has a technical victory, so then it’ll come down to things like warranty coverage (varies by region – check for yours) and support.
Editorial, Testing: Steve Burke
Video: Josh Svoboda, Andrew Coleman