The most common component review request from our viewers over the past few months has been the RX 5700 XT Red Devil. Powercolor was never able to get stock to send us one, but we finally sniped one when it popped-up on Amazon. This will likely be the last 5700 XT we review, unless something major comes out – or a THICC III – so we’ll finally have a fairly full picture of how the entire stack aligns compared to the much-praised RX 5700 XT Red Devil from PowerColor. The Red Devil has easily been the most universally recommended in comment threads and for review, and so we’ll be benchmarking it for thermals, noise, and build quality in today’s review.
We bought the Powercolor RX 5700 XT Red Devil for about $440 on Amazon, which puts it into the most direct engagement with Sapphire’s Nitro+ or MSI’s Gaming X variants of the RX 5700 XT GPU. We’ll be looking at the PowerColor card for thermals, acoustics, power budget, and fan/frequency response.
Test Methodology
We have overhauled the host test bench and had updated with new games. Our games selection is a careful one: Time is finite, and having analyzed our previous testing methodologies, we identified shortcomings where we were ultimately wasting time by testing too many games that didn’t provide meaningfully different data from our other tested titles. In order to better optimize our time available and test “smarter” (rather than “more,” which was one of our previous goals), we have selected games based upon the following criteria:
- Game Engine: Most games run on the same group of popular engines. By choosing one game from each major engine (e.g. Unreal Engine), we can ensure that we are representing a wide sweep of games that just use the built-in engine-level optimizations
- API: We have chosen a select group of DirectX 11 and DirectX 12 API integrations, as these are the most prevalent at this time. We will include more Vulkan API testing as more games ship with Vulkan
- Popularity: Is it something people actually play?
- Longevity: Regardless of popularity, how long can we reasonably expect that a game will go without updates? Updating games can hurt comparative data from past tests, which impacts our ability to cross-compare new data and old, as old data may no longer be comparable post-patch
Game graphics settings are defined in their respective charts.
We are also testing most games at all three popular resolutions – at least, we are for the high-end. This includes 4K, 1440p, and 1080p, which allows us to determine GPU scalability across multiple monitor types. More importantly, this allows us to start pinpointing the reason for performance uplift, rather than just saying there is performance uplift. If we know that performance boosts harder at 4K than 1080p, we might be able to call this indicative of a ROPs advantage, for instance. Understanding why performance behaves the way it does is critical for future expansion of our own knowledge, and thus prepares our content for smarter analysis in the future.
For the test bench proper, we are now using the following components:
GPU Test Bench (Sponsored by Corsair)
Component | Courtesy of | |
CPU | GamersNexus | |
GPU | This is what we’re testing! | Often the company that makes the card, but sometimes us (see article) |
Motherboard | ASUS | |
RAM | Corsair | |
PSU | Corsair | |
Cooler | NZXT | |
SSD | Plextor 256-M7VC | GamersNexus |
All memory timings are completely controlled for our new GPU testing, which has significantly tightened our error margins. Windows is version 1903. Note that some games, like GTA V and Hitman 2, have been manually tuned outside of a simple preset to ensure we have a proper benchmark. GTA V uses 2x MSAA in our testing, as it runs into engine frame limits at 187.5FPS and triggers engine-level bugs. Hitman 2 has crowd simulation and sound simulation settings that we tune back to the 4-core setting, as running higher than that creates a CPU bottleneck (and more of a CPU benchmark, as a result).
40dBA Noise-Normalized Thermals – GPU
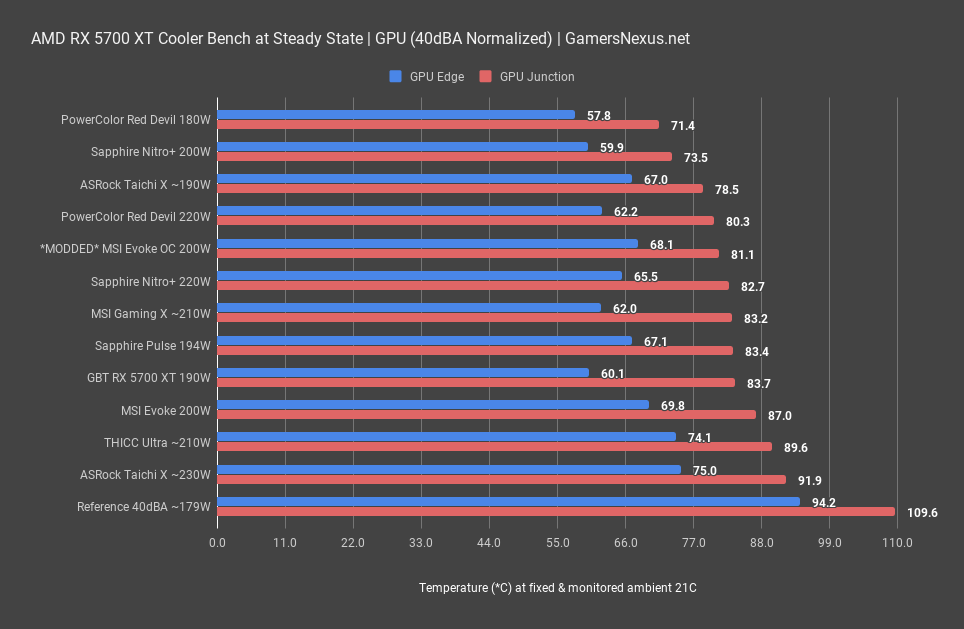
We’ll start with noise-normalized thermals, as this gives us the best look at cooler efficiency when all matched to the same noise level. Allowing coolers to run how they want is a different test, coming up later, but also means that anyone who brute forces high fan RPMs and noise can “win” the charts. That’s why we segment them. Results will mostly scale hierarchically, so if you have a 40dBA noise level, the hierarchy will mostly retain rank at, say, 44dBA. 40dBA is equal to or higher than what most coolers run stock, with most within 1-3dBA.
The Red Devil 180W Silent configuration runs the coolest. This isn’t a huge feat seeing as the power budget is also reduced, and so comes our next point: power must also be monitored, if not normalized. At 180W, this cooler is most comparable to reference at 40dBA -- a massive improvement – or perhaps the Sapphire Pulse at 194W and Taichi X at 190W. Even against the Taichi X, the closest at 79 degrees Junction, the Red Devil maintains enough of a lead that even a 10W reduction to the Taichi won’t equalize the two.
With the OC VBIOS, the Red Devil maintains 220W under this benchmark, allowing it to run better than the Nitro+ by about 2-3 degrees Celsius Junction. The Edge temperatures are also close. The Taichi X at 230W still runs the hottest of the partner cards, at 92 degrees Junction against the high power consumption VBIOS, and the THICC at 210W runs 90 degrees Junction. The Red Devil and Nitro+ remain the most efficient cooler designs, with the Gigabyte Gaming OC and Sapphire Pulse following-up in the more reasonably priced category.
40dBA Noise-Normalized Thermals – VRAM
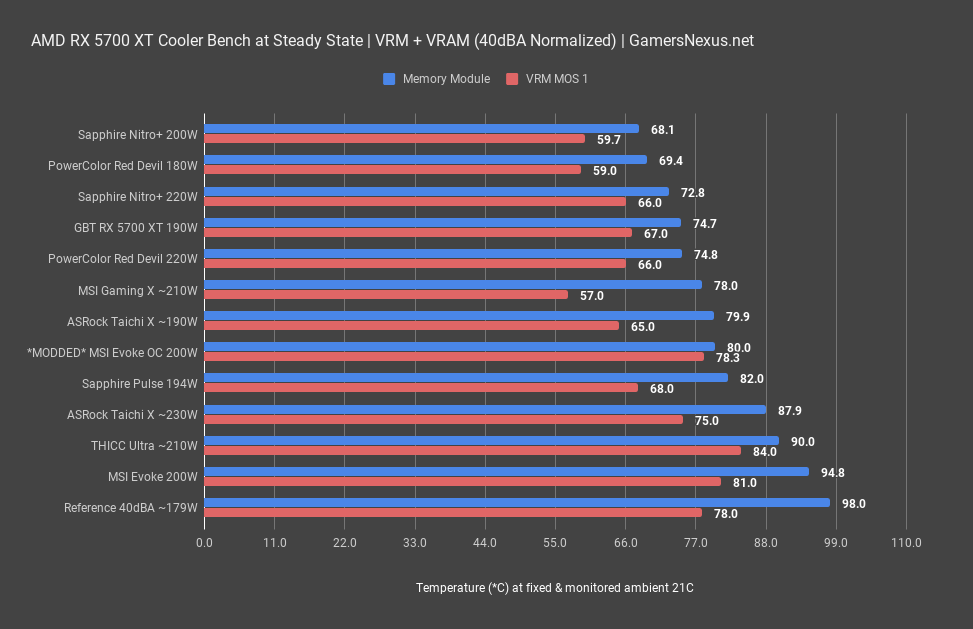
GDDR6 and VRM MOS thermals are next. As we said in the last one, VRM MOS thermals aren’t all that relevant here aside from ensuring nothing is horribly wrong. It doesn’t matter if one MOSFET is cooler than the other in terms of performance – at least, not until you’re at or above 125 degrees – but it does matter from a purely technical standpoint of cooler design. Memory is far more important, as the cards toward the bottom of this chart, like Reference, the Evoke, and the THICC, can all hit maximum memory temperatures of 105C+ when installed in a case with a higher ambient.
The PowerColor Red Devil’s 180W Silent VBIOS ends up second-place, behind the 20W-higher Sapphire Nitro+, when it comes to GDDR6 cooling. Both are so cool that it’s irrelevant who’s in the lead, as memory doesn’t boost based on GDDR6 thermals. That said, from a purely technical standpoint, the Nitro+ is the superior design for GDDR6 cooling, even with 20W more power budget. The Red Devil at 220W ends up again behind the Nitro+, retaining the scaling as the other test. With the two power budgets now equalized, we can see that the Nitro+ keeps about a 2-degree gap in GDDR6 thermals on the hottest module. In reality, both cards are performing well, and it doesn’t particularly matter which of the two you buy when it comes to memory or MOS thermals.
Disassembly
Check the video above for disassembly footage.
The cooler is fairly straight-forward, with most of its performance derived the old way: A lot of fans and a lot of metal. The finned heatsink has standard fin pitch and density and no fancy design elements, but if it works, that’s all that matters. Removing the heatsink reveals a separate aluminum coldplate for contacting memory, including some plus-shaped Phillips indents on the memory thermal pads. These screws help distribute the force of the aluminum plate, but aren’t the only thing connecting the memory plate to the heatsink. One of our concerns with some coolers is that it’s just a few screws contacting plates together, but the Red Devil takes the more traditional approach of welding the plate to the heatsink fins, then adding screws for additional support. We’re fine with this assembly.
There’s no direct conduction from the inductors to the heatsink, unlike the last card we tore apart, but this also isn’t important. The inductors are just copper coils inside of a shell, and they are capable of running at the highest temperatures out of every device on the card.
Thermal paste is well-spread on this card, and the heatsink has basically a perfect mount. We have completely even spread of compound across the die and outer edges, indicating even mounting pressure. As this was purchased retail, we also have some assurance in knowing it resembles what consumers buy.
There’s full contact of about 3 heatpipes to the GPU, with another 0.5 contact at the outer edges. Powercolor is using 6mm heatpipes, fairly standard for this generation, and has wide gaps between the heatpipes and the plate if looking under the hood. This is an area for potential in-fill and improvement, but not one which is all that relevant to performance.
Finally, the backplate on this card has no functional purpose. There aren’t any thermal pads connecting the backplate to the memory or rear of the GPU or VRM, and so it’s purely for looks. This is another area where Powercolor could undoubtedly improve if it felt the need.
Auto Thermals – GPU
Auto thermals are tricky to benchmark with this card. The PowerColor Red Devil behaves differently in FurMark than it does in 3DMark and games, which was true for another game that we tested previously. This means that unscrupulous testing in just one application wouldn’t give us a proper look at how the card performs; testing only in FurMark would mean a more aggressive fan curve, which doesn’t translate to real-world gaming scenarios, and so would paint the Red Devil as more capable than it truly is when auto. For this reason, we ran a second set of auto tests with the fan configured to follow the curve that’s used in games, then one that was configured to follow the curve in FurMark. The gaming curve will better represent scaling performance versus the other cards, in terms of establishing a hierarchy.
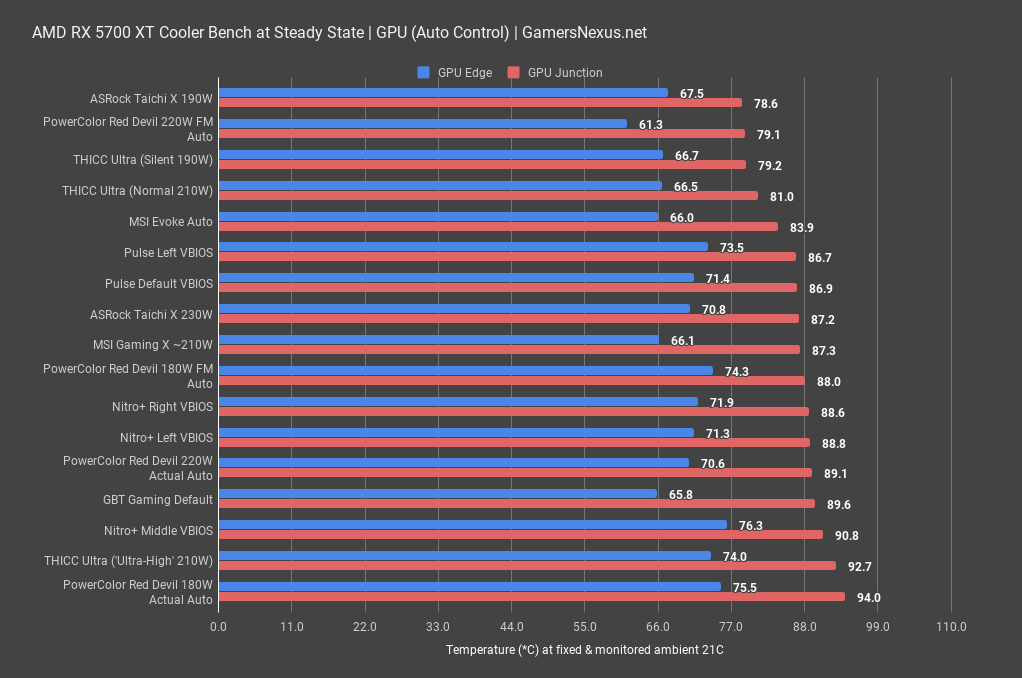
Starting with auto GPU temperatures. This allows us to see how the device performs when left to use its automatically configured VBIOS tables for both FurMark and gaming. The Red Devil at 220W with its FM profile is now among the chart-toppers, ranking alongside the Taichi X at 190W and XFX THICC Ultra at 190W. The THICC managed this performance by blasting fan speeds faster than most others, whereas the Taichi X was simply running lower power budget than some of the others.
The Red Devil ends up at its 80-degree Junction temperature with a 1750RPM fan speed, which is very close to our 40dBA measurement. That said, this isn’t actually how the fan behaves in gaming, despite how it behaves in FurMark. For gaming, it’ll spin at 1340RPM with the OC VBIOS and 1000RPM for the Silent VBIOS. This chart tells us that PowerColor has configured a fan curve that’s in the middle when in FurMark: When the THICC is running closer to 44-46dBA, depending on scenario, the Red Devil sits around 40dBA, and a lot of these other cards fall within 37, 38, or 39dBA marks. The difference is that the others, shown here, would also stack-up the same in 3DMark or a game, whereas the Red Devil would drop dramatically. If we highlight the 180W Actual Auto ranking, the Red Devil now ends up last, at 94 degrees Junction and 76 Edge, next to the Thicc with its terrible Ultra-High VBIOS. That doesn’t mean the cooler is bad, it just means the fan isn’t aggressive enough with silent mode. With the 220W Actual Auto rank, we’re near the Gigabyte Gaming OC and Nitro+, down around 90 degrees. That’s a big drop from the FurMark auto setting, and is more of where you should expect the card for regular use.
Again, all this really means is that the auto results could be improved upon by manually setting a fan curve. PowerColor’s cooler is fine when normalized, but doesn’t run aggressively enough, we think, under gaming conditions.
Auto Thermals – VRAM
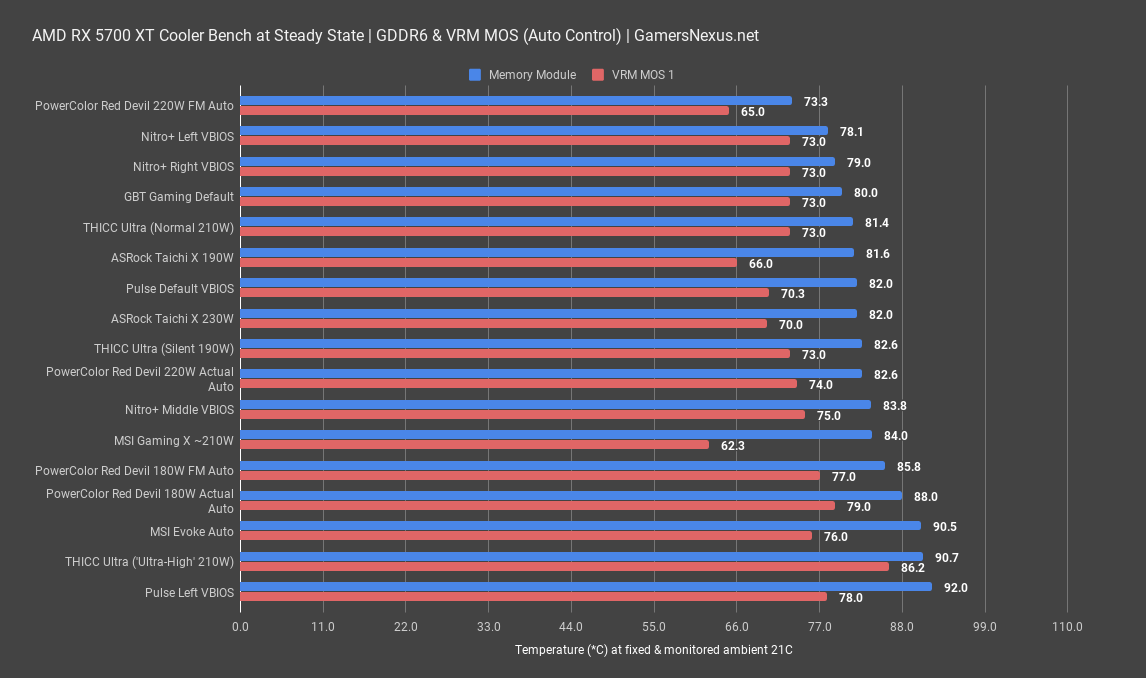
GDDR6 thermals are up now, this time with auto settings. The Red Devil with its FurMark Auto settings ends up topping the chart, running its fans at 40dBA and outperforming the louder THICC without any issues at all, despite a higher power consumption. The Nitro+ is also outperformed here, but runs a quieter fan speed – hence the need to noise-normalize, as we did earlier. The FM Auto 180W test had us down near the Gaming X and Evoke with auto settings, pre-mod. As for applying the fan speeds used in games, the Red Devil ends up near the MSI Gaming X at 210W, although slightly advantaged. It’s middle of the pack, otherwise, and not particularly strong in its auto configuration.
Fan/Frequency of Red Devil RX 5700 XT
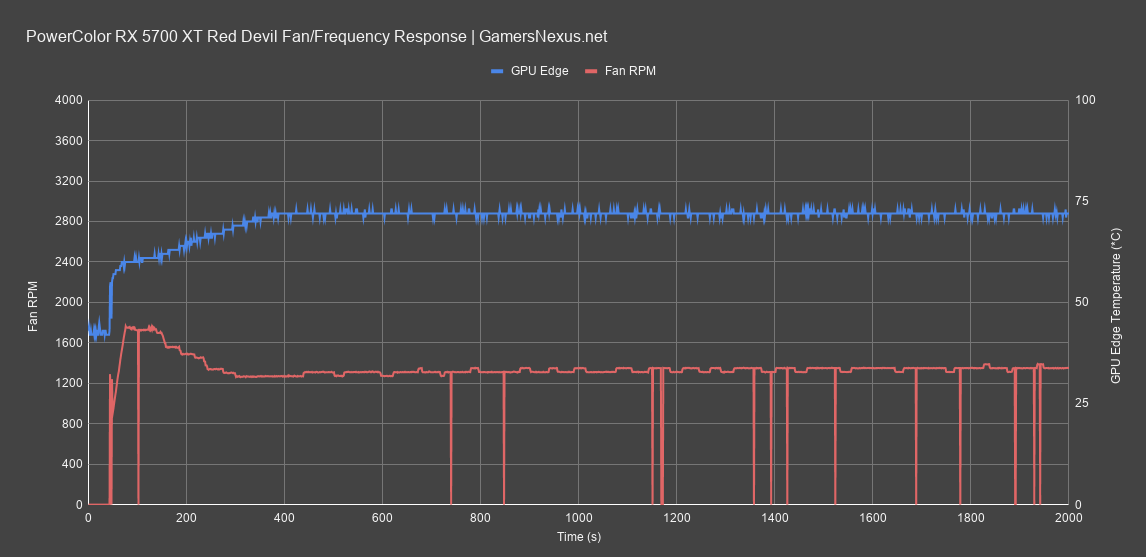
We’ll get the RPM plots for 3DMark on the screen now, representing performance for gaming workloads. Plotting fan RPM and GPU Edge temperature first, the OC VBIOS tries to sustain a GPU Edge temperature of about 72 degrees Celsius, which pushes an RPM of about 1300-1350. There’s a hard falloff at the beginning of the test from about 1700RPM down to this resting speed.

Looking next at frequency response, we can see that the OC VBIOS averages about 1950MHz during the course of the 3DMark workload. The Silent VBIOS is able to carry its lower fan RPM in part thanks to the 1830MHz average frequency, a significant reduction versus the OC VBIOS.
Frequency vs. Others
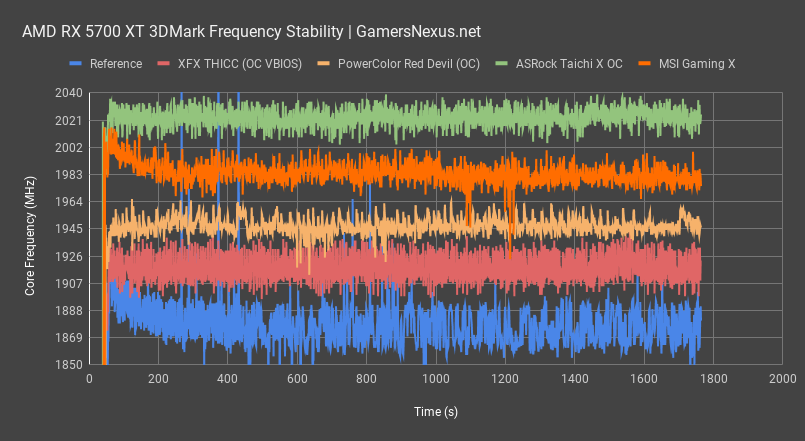
Here’s a super zoomed-in look at some other cards. We can’t fit all of them, obviously, but it’ll give you a good idea of the upper and lower limits. The Taichi X and its 230W VBIOS still holds claim of the highest out-of-box frequency, in the 2020MHz range and above everything else. The MSI Gaming X is next, then the Red Devil, then the THICC and Reference card. The AVG FPS delta between Reference and something like the Red Devil would be about 2-2.2% on average, for reference, so there’s not a big performance range here. Highest frequency isn’t a metric by which we judge value when the deltas are so low, especially when considering it can all be equalized in software. Also, this scale is 1850MHz to 2040MHz, so everything is blown-out to get a better view. It’d all be on top of each other if left with a normal scale.
Noise Levels
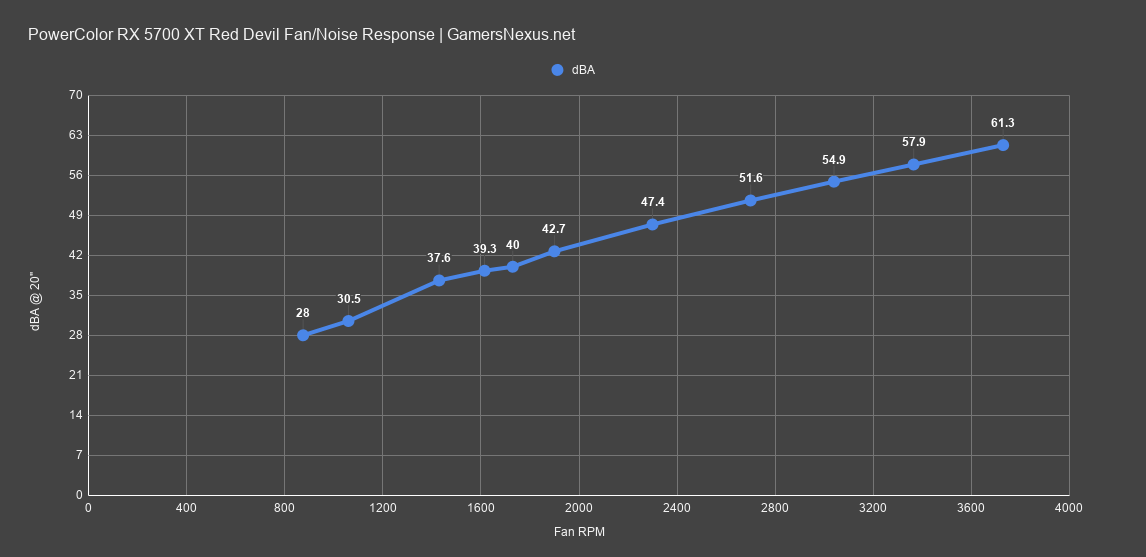
Here’s a plot of noise levels at a given RPM. The curve isn’t as linear as some others we’ve seen and tops-out higher, giving some additional headroom at the high-end for cooling if desired. That said, at over 60dBA, not many people will want to venture this high in RPM. It’s also just genuinely not necessary, as the card remains well within operating bounds when pegged around 40dBA. The only use would be on-air heavy overclocks and powerplay table mods for competitive overclocking, but you’d be better off with a water-cooled card for that.
Conclusion
The Powercolor RX 5700 XT Red Devil is similar in performance to the Sapphire Nitro+, with the two trading places depending upon which benchmark is used. We’d assign a slight advantage to the Nitro+ (although the Red Devil has the second-best PCB we’ve looked at), but at the level of performance that both these cards achieve, it doesn’t matter too much which of the two is purchased. For a more affordable 5700 XT, the Gigabyte Gaming OC still makes the most sense. For one of the higher-end ones, we like either the Nitro+ or the Red Devil, and would pick according to looks, fitment, price, and availability in your region. Whichever is cheaper or readily available would be fine.
The Red Devil has some clear avenues for improvement, like utilization of the backplate as a heatsink via thermal pads for the memory, but is overall above average for coolers on the RX 5700 XT series. The Red Devil was heavily hyped over the past few months, but we have the advantage of looking at it last. Without the context of some of these other cards, like the strong Gaming OC and Nitro+ performance, the Red Devil would have a clear victory. With, however, the context of most the other relevant cards, the Red Devil fits in relatively equally with some of these others.
Editorial, Testing: Steve Burke
Video: Josh Svoboda, Andrew Coleman