Today we’re reviewing the AMD R3 3100 and Ryzen 3 3300X, but we have a dedicated content piece for the AMD R3 3300X because we added benchmarks for the two CPUs at the same frequency, exposing the latency difference between them. For this specific article and video, we’re focusing all of our attention on the AMD R3 3100 CPU at $100, potentially a high-volume part for budget PC builds. That includes overclocking, power consumption, gaming benchmarks, frequency analysis, production workloads (Premiere, Photoshop, compile, et al.), and more. Our AMD Ryzen 3 3300X review will post within a couple of hours on this one (on YouTube, at least, if not also on the site), and that’ll feature head-to-head 4.4GHz overclocks on the R3 3100 vs. R3 3300X, where the 3300X’s 4+0 core CCX configuration can be tested for its real-world latency impact versus the 2+2 3100.
Writing this review, it felt like we were writing a review script from the same era as the 7700K, and not just because AMD is positioning itself against the 2017 CPU. Back when we reviewed the 7700K, all the comparisons were to the 6700K, the 4790K, the 2600K – the theme was that it was all intra-brand competition. The same is happening now, where we’re throwing a few Intel names out there as comparisons, but until the 10-series, AMD really is just competing against itself. It’s fascinating in a way, because from a reviewer and editorial standpoint, it really does feel like dejavu – except it’s a different company in 2020. The new AMD Ryzen 3 3100 and 3300X CPUs have a release date set for May 21, 2020, with the Intel 10th “Gen” release date set for May 20, 2020.
NOTE: Our AMD R3 3300X review is now live as well. The video went live first, the article will go live shortly on the home page of this site.
Intel remains the chart-leader and overall competitive at the high-end, like with its 9900K, and its new parts look like they could be seriously competitive across the stack again. Today’s review comes out before those parts, though, and AMD is out there alone in the $100 field. It’s faced only with the i3-9100F part that’s rarely justifiable to begin with.
We’re not going to sit and regurgitate a spec sheet to you (you can go to AMD’s website for that), so the quick differences are these: The R3 3100 and 3300X are both 4C/8T CPUs at $100 and $120, respectively, and the clocks are 3.6GHz to 3.9GHz on the 3100 or 3.8/4.3GHz on the 3300X when stock. Literally everything about them is the same from a spec sheet standpoint, so if it were like the 3600 and 3600X, you could overclock the 3100 to equate 3300X performance.
It Doesn’t Work That Way This Time
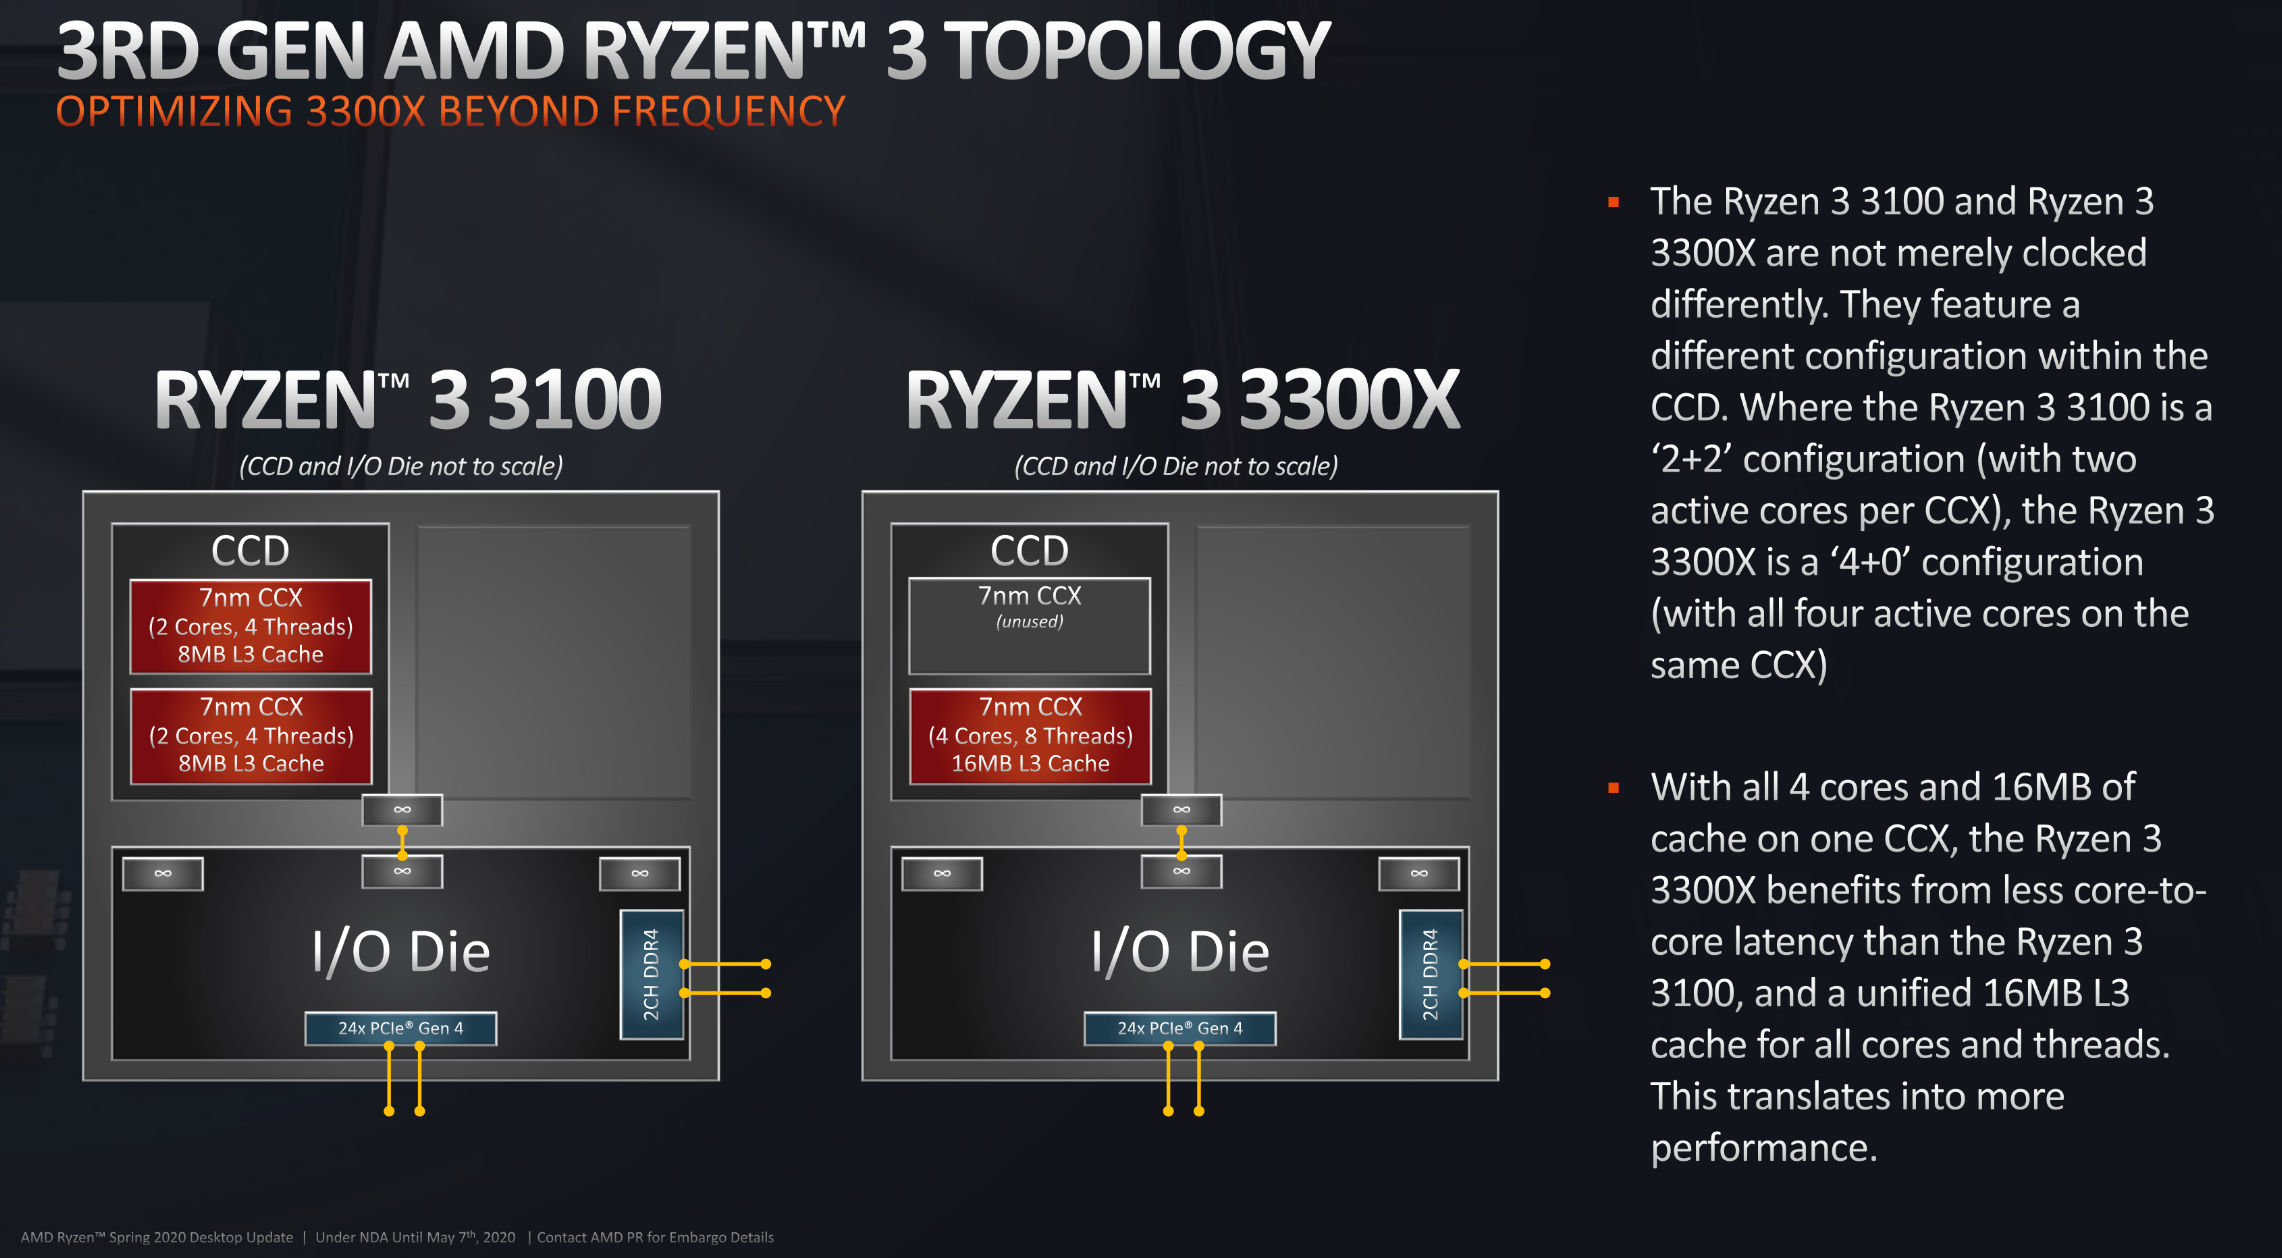
As seen in this block diagram of the topology from AMD’s R3 series, only one CCD is active on each CPU, as expected, but the active CCXs are different. The 3300X loads everything into a single CCX, so it’s a 4+0 configuration for the cores, while the 3100 splits it into two CCXs for a 2+2 configuration. This means more latency involved in the latter under compile or gaming workloads, and so it won’t be as simple as overclocking a 3100 to equate 3300X performance. Anyway, more on that in the dedicated 3300X content later today (and if you don’t see it on the website, check our YouTube channel -- we sometimes run on a delay with articles due to limited time).
Another note before starting the benchmark charts: We’ll return for Infinity Fabric overclocking in a special OC video dedicated to these CPUs (using normal cooling), then later an overclocking stream with liquid nitrogen as another instalment.
Testing Methodology
If you’d like to read our testing methodology for all of this, we’ve published a detailed one-pager GN CPU testing methodology 2020 article over here. If you prefer videos, you can watch that below:
AMD Ryzen 3 3100 Frequency Log - Cinebench
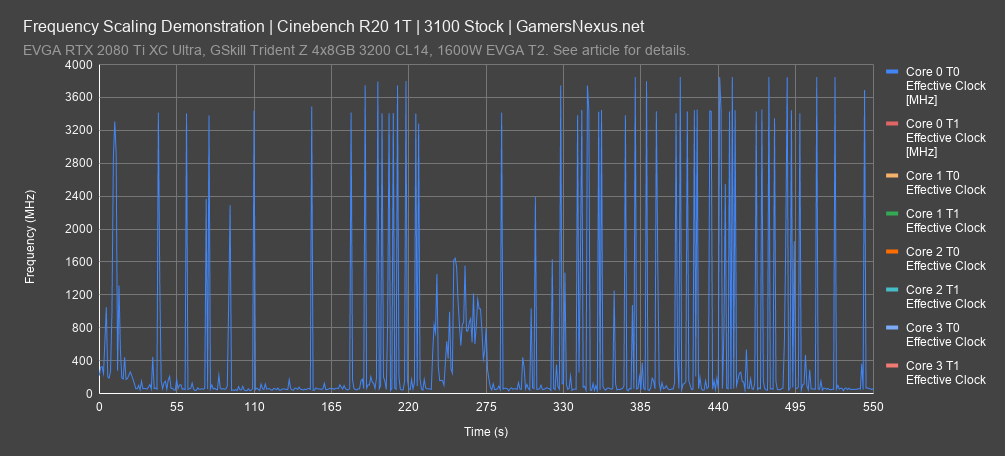
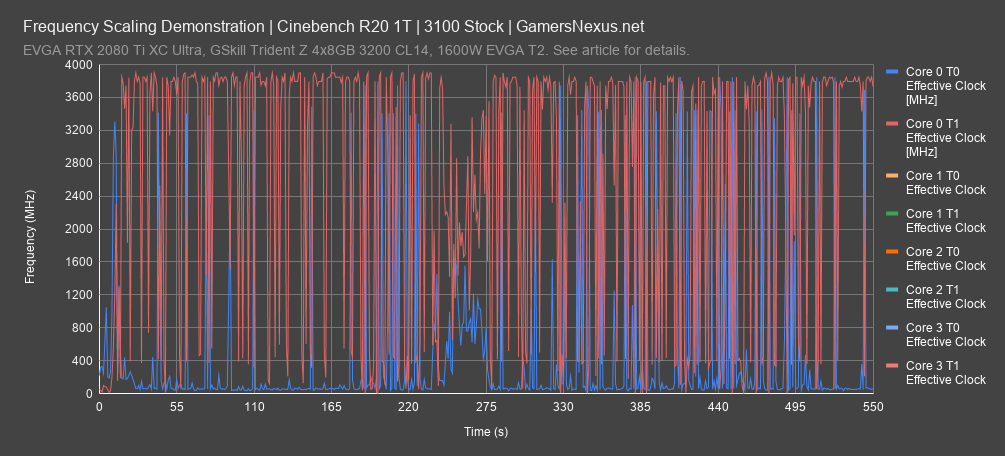
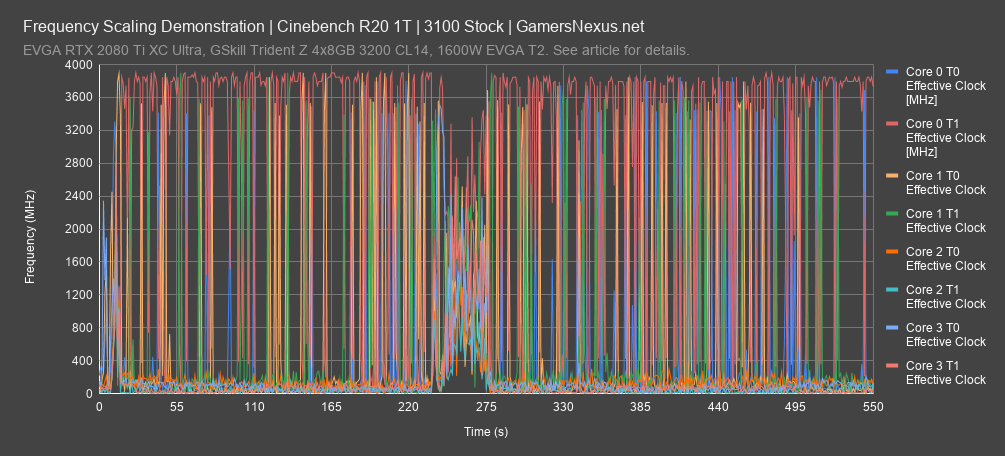
We need to understand how the processor works before we start analyzing its performance in games and benchmarks. For AMD, the best way to do this is to look at single-threaded frequency behavior under load, as this helps demonstrate the boosting ceiling. For the 3100 stock with Cinebench R20 single-thread running, the maximum boost is usually about 3900MHz -- or just slightly under -- with the heaviest load applied to Core 0, Thread 1. Other threads, like Core 2, Thread 0 will come in occasionally and at similar clocks. The frequency is very consistently between 3800MHz and 3900MHz all-core, which is what the advertised boost is. AMD is actually hitting boost regularly this time, although we do have it under our standardized 280mm CLC. If you use a worse cooler, Precision Boost 2 will bring down clocks accordingly.
AMD Ryzen 3 3100 Frequency Log - Blender
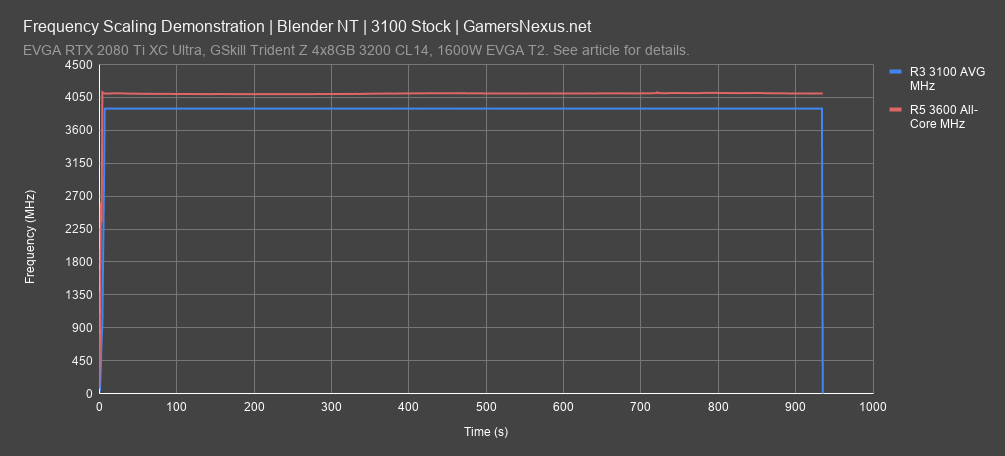
Our next frequency chart is Blender with an all-core, all-thread workload. This is the opposite of the previous one. For this, we’re looking to see if the frequency line ever deviates from a single target of 3900MHz. The average all-core frequency is about 3890MHz, so AMD’s advertising on this one appears to be accurate to the boost expectations under all-core and single-thread loads. The temperature is low enough that it’s sustaining the Precision Boost 2 maximum clock; were we to run on a warmer cooler, we’d experience some frequency dips as have been previously explained in our thermal scaling videos.
Blender Zoom
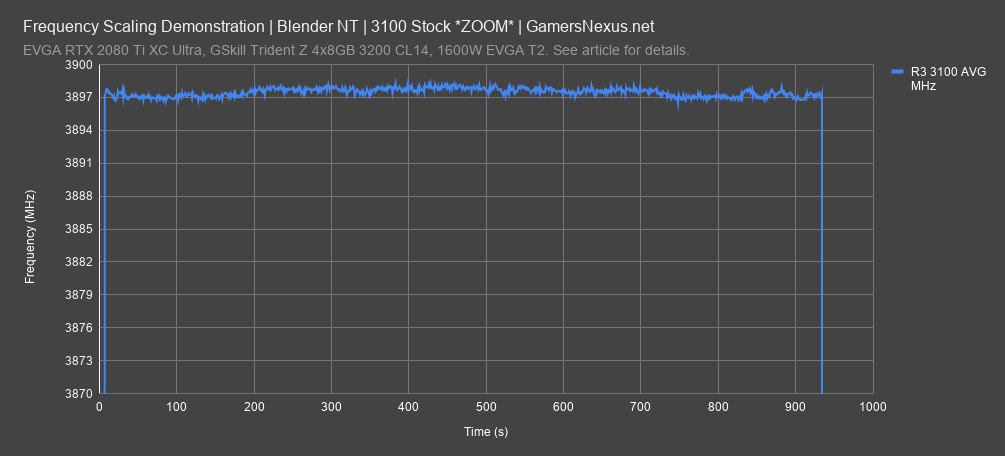
If we zoom into this chart a lot, we can better show the frequency variance. It’s extremely consistent here, with the range about 3894 to 3898MHz. There’s almost no fluctuation in temperature, which means it’s running at maximum advertised boost due to thermal allowance, since power is not being hit here.
Total War: Three Kingdoms Battle (1080p)
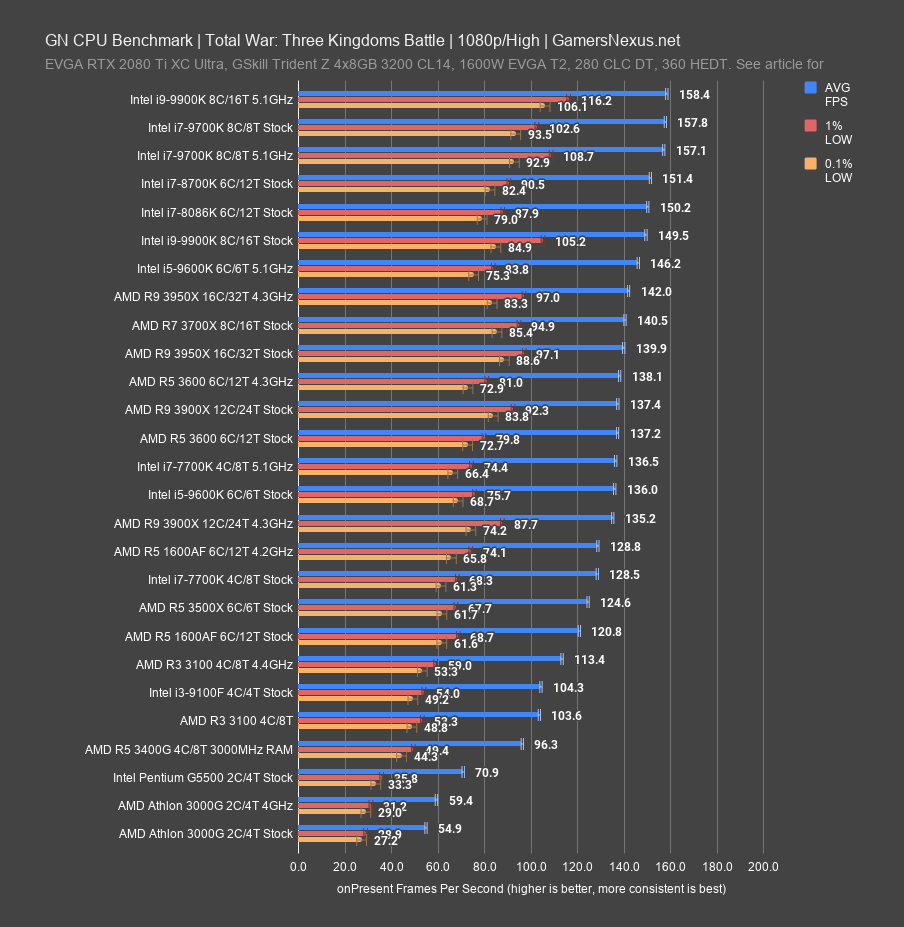
Total War: Three Kingdoms and the battle test are up now, starting at 1080p. This game positions the 3100 at 104FPS AVG, with 1% and 0.1% lows spaced proportionately behind as compared to surrounding CPUs, including the 9100F and 3500X. The 9100F is within 1FPS AVG here and we have a standard deviation in this game of about 0.5 for the average. The 9100F and 3100 are functionally equivalent. There is no perceptible difference between either in this benchmark, including in frame-to-frame consistency. The 1600AF runs at 121FPS AVG, a lead of 16.6% over the 3100 stock CPU. As for the 7700K that the 3100 is supposed to match, in this particular title, that doesn’t seem to be the case – it needs more frequency, something our overclock can illustrate in a moment. The 7700K stock leads the 3100 by 23%, and overclocking the 7700K boosts it an additional 6%. The 3100 OC pushes it to 114FPS AVG; interestingly, in our 3300X review that we’re still finalizing at time of writing this one, the latency impact from the CCX layout change has a big benefit for the 3300X. The 3100 OC won’t actually just equal a 3300X, unlike how AMD laid-out CPUs like the 3600 and 3600X. We’ll talk about that more in our video later the same day this one goes up – check back in a couple hours for that. The OC gain is about 9% on the 3100. We’ll return for Infinity Fabric overclocking in a special OC video dedicated to these CPUs, including a stream.
An extra $80-$100 pushes to the 3600 at 137FPS AVG from AMD, or the 9600K – which we’d advise against, with its upcoming 10-series soon tested – from Intel. We should plot frametimes to get a better understanding of things.
Total War: Three Kingdoms Frametimes
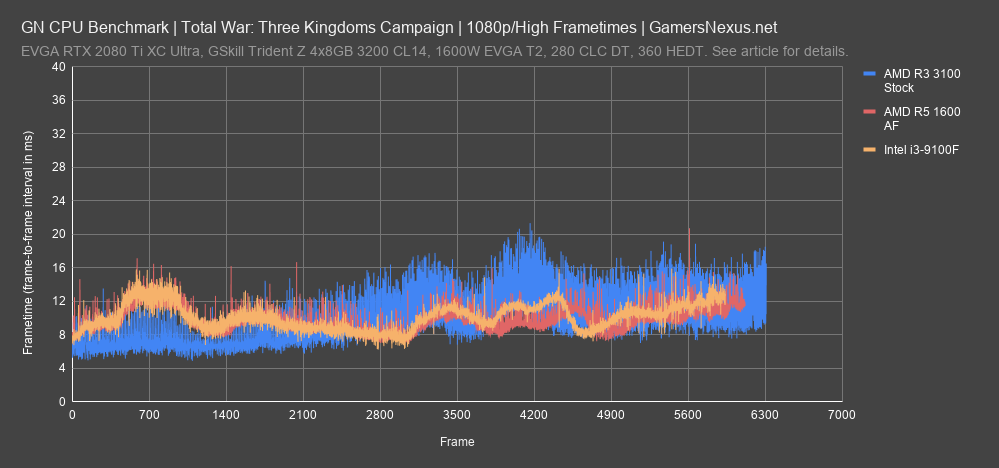
Here’s the frametime plot. As always, lower is better, but more consistent is best. This shows the most accurate numbers-based depiction of player experience we can muster, showing frame-to-frame intervals required to process the next frame. Remember that the 3100 was about the same in all metrics to the 9100F, but because of the frametime range on the 3100, the averages don’t reveal the whole story in the previous chart. In this game, the R3 3100 bounces up and down more sporadically, with frame-to-frame excursions anywhere between 5-7ms, with a lot of swings +/-4-5ms. That’s not a deal-breaker and not particularly noticeable in play since the overall frametime is so low, but it does mean that AMD’s frametime consistency, despite looking equivalent in averages, is actually technically worse than Intel’s. As we plot the 9100F, you’ll see that. If there’s one area AMD really needs to work on for its future products, it may be either working with developers on code or working on smoothing-out this chart. We’re not suggesting an i3 purchase, seeing as it sucks in almost any other scenario, but this is a good example that more threads doesn’t just automatically mean a trimmed frametime plot.
Total War: Three Kingdoms Battle (1440p)
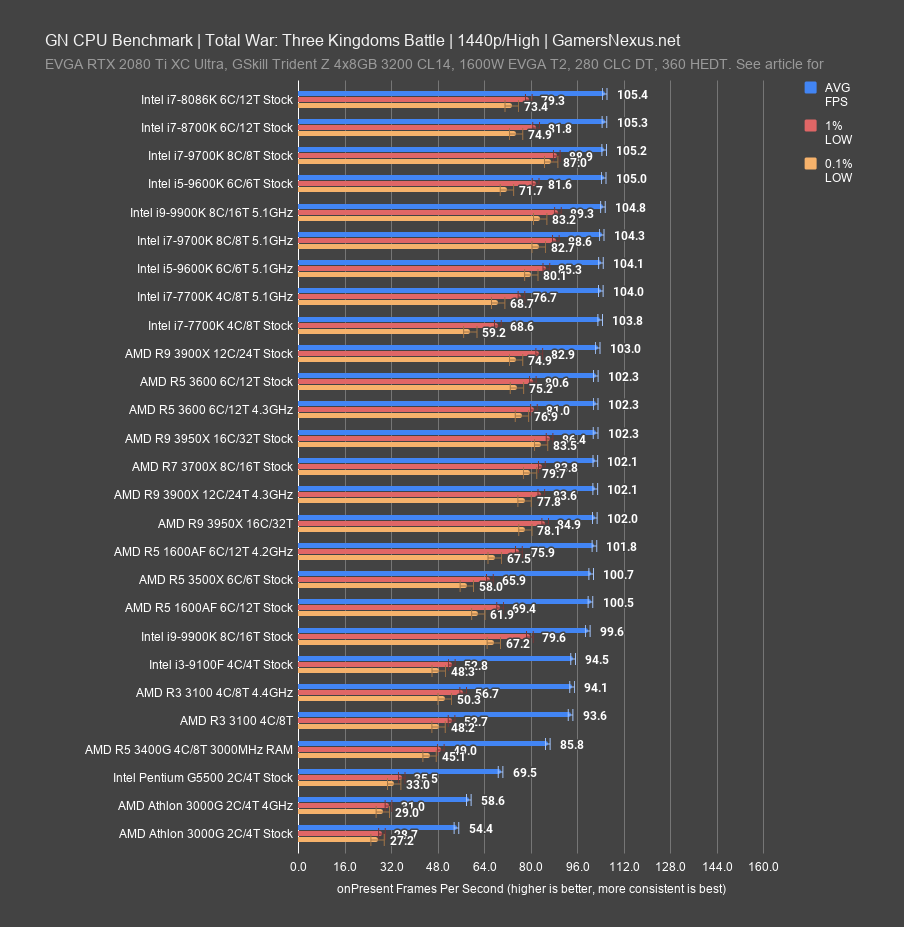
1440p is next. This one shows us that the chart truncates toward the upper two-thirds or so, to the extent that we no longer have test resolution to see the difference between a 9900K and a 3600, 8086K, or 9700K. This is because of a GPU limitation at this point, and faster CPUs have the added bonus of becoming CPU-bound in lower GPU-load sections, while the GPU universally is bound in lower CPU-load sections. Higher resolutions are creating this division, but lower-end parts like the Athlon 3000G need not worry about limiting similarly low-end GPUs – the CPU is still a limiting factor. For the 3100, although it’s not against the hard limit of 100-108FPS AVG, it’s still hitting it sometimes. This CPU doesn’t do as well in frametime consistency as some of the higher-end parts at not-so-distant framerates, but it’s also not that different overall in the average. There’s enough of a bottleneck that it doesn’t matter as much, and although this isn’t a great way to show a CPU hierarchy, it is a good way to show the reality of a GPU-constrained game.
Total War: Three Kingdoms Campaign (1080p)
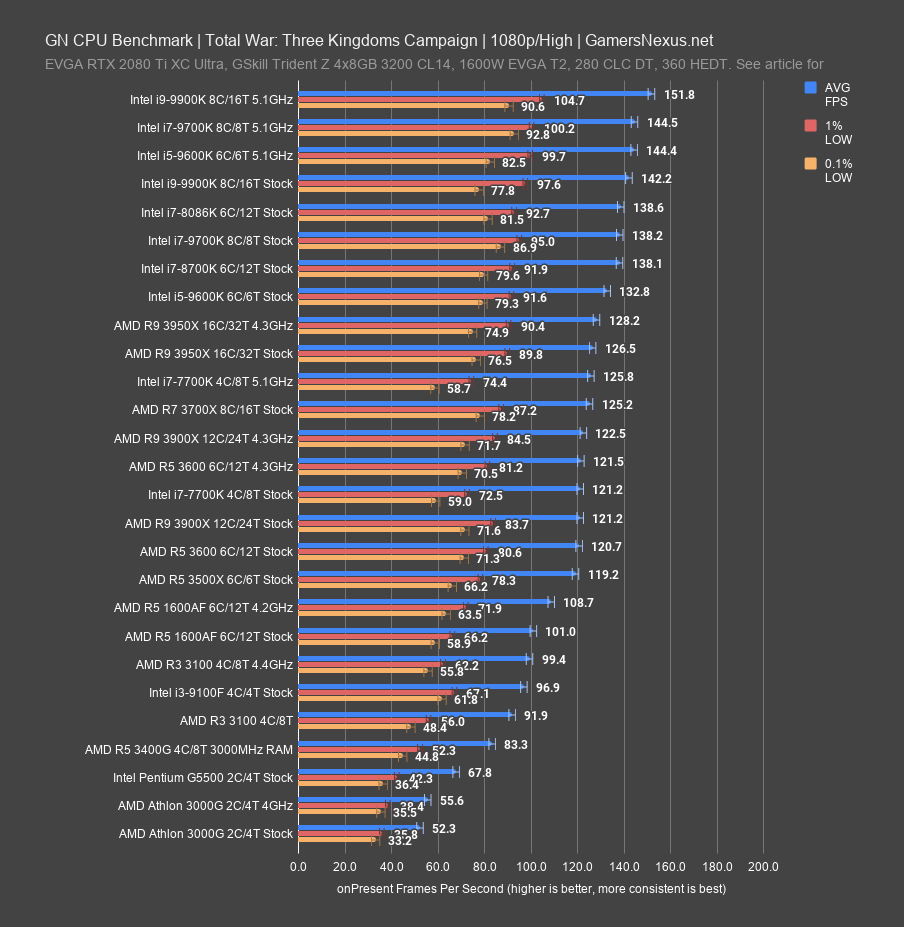
The Three Kingdoms Campaign benchmark is next, before moving to Red Dead after that. For the Campaign benchmark at 1080p, the stock 3100 runs 92FPS AVG, lows at 56 and 48, and outperforms the 3400G by 10%. Remember that the 3400G is (1) targeted towards a different use case, and (2) still overpriced even in most of those deployments. The 9100F outperforms the 3100 in both framerate and frametime consistency, at 97FPS AVG, a measurable but imperceptible increase of 5%. The 1600AF outdoes both in average framerate and is within run-to-run variance of the 9100F. As for the 3100 overclock, that one runs 99FPS AVG, limited again by its intra-CCD latency from CCX to CCX. The 7700K stock CPU runs at 121FPS AVG, for reference to Intel’s 2017 flagship, and the 7700K OC barely moves any higher in this test. The OC gets the 3100 closer to 1600AF stock performance.
The Division 2
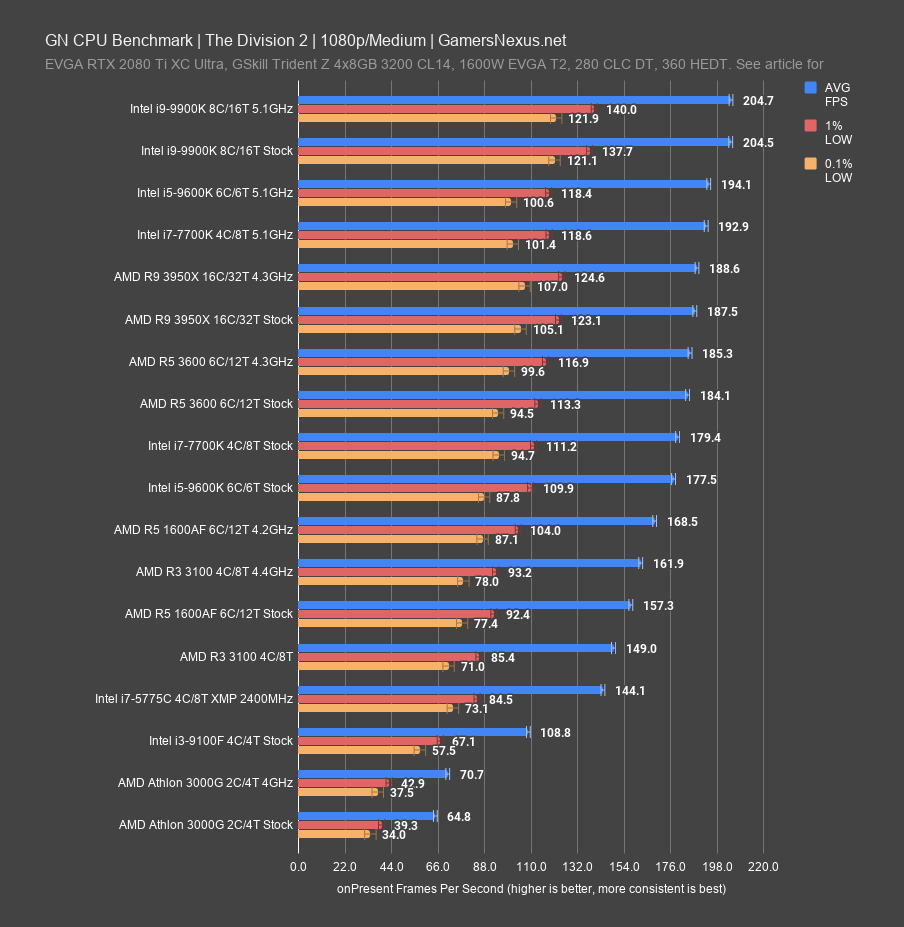
The Division 2 looks more favorable for AMD, something we learned in our budget CPU round-up recently. For this benchmark, remember that our methodology piece highlighted a reconfiguration to medium settings, which means we’re starting with a truncated table since we only just added this graphics setting to the benchmark. Many CPUs still need to be filled into the chart. Give us time on that.
The 3100 runs 149FPS AVG with medium, encountering a CPU bind before a GPU bound. If you ran high settings, you’d be GPU bound almost assuredly. The 3100 runs a significant and somewhat remarkable 37% ahead of the 9100F AVG FPS. That’s a big jump, especially considering the previous game had the 9100F technically ahead. This also speaks to our previous result of the 1600AF’s leadership in this particular title, where it runs 157FPS AVG to the 9100F’s lower framerate. As for the 7700K, credit to Intel where it’s due – the old flagship still runs 179FPS AVG stock, a lead over the 3100 stock CPU of 20%. The 7700K OC posts an additional 8% gain over its stock score. We cap in the 9000 series and hit a GPU limit. The 3600, for reference, is about 24% ahead of the 3100 and encroaches on the 7700K. It’s a meaningful upgrade. As for the 3100 OC, that boosts to 162FPS AVG over 149FPS AVG, a jump of 8.7%.
Red Dead Redemption 2 (Vulkan, 1080p)
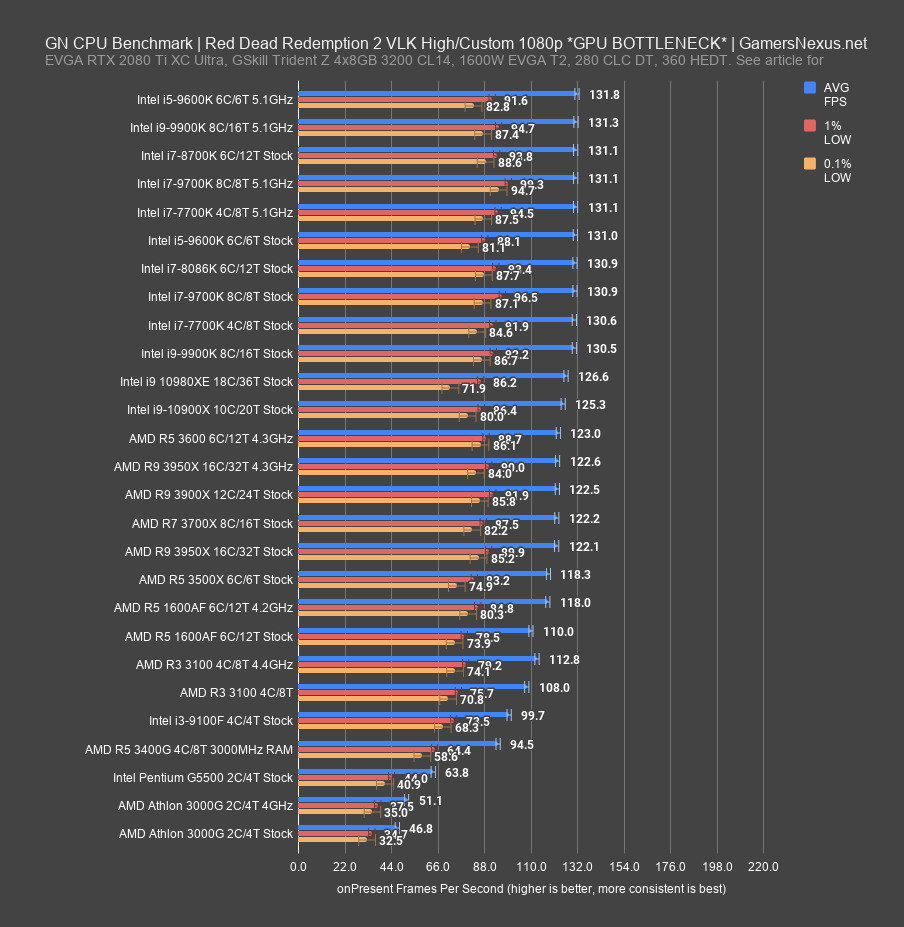
Red Dead Redemption 2 is next, starting with 1080p and Vulkan. This chart tops-out really hard, as you can see from the 130 to 132FPS AVG range. We don’t have the ceiling to establish meaningful differences between the higher-clocked parts – including the 7700K at 5.1GHz – but we’ve added 1080p/medium testing to help accommodate some of that.
The 3100 is far away from this limit, fortunately for our comparison: At 108FPS AVG, it’s about the same as the 1600AF and about 8-9% ahead of the 9100F, with 1% and 0.1% lows within error and run-to-run variance of both. The 7700K stock is clipping against the GPU limit, so from all we can gather, there’s minimally a 21% lead with this API and these settings, but potentially more if the GPU limit were lifted. Overclocking the 3100 gets it to just a few ticks higher at 113FPS AVG, with lows marginally improved. This will jump more with the 3300X, where we ditch the CCX-to-CCX transactions.
Red Dead Redemption 2 (1080p, Medium)
We’ll skip the Red Dead 2 medium chart since this CPU is already CPU-bound, not GPU-bound, so the results are about the same. In our 3300X review later today, this chart will become much more relevant and we’ll display it then.
F1 2019 (1080p)
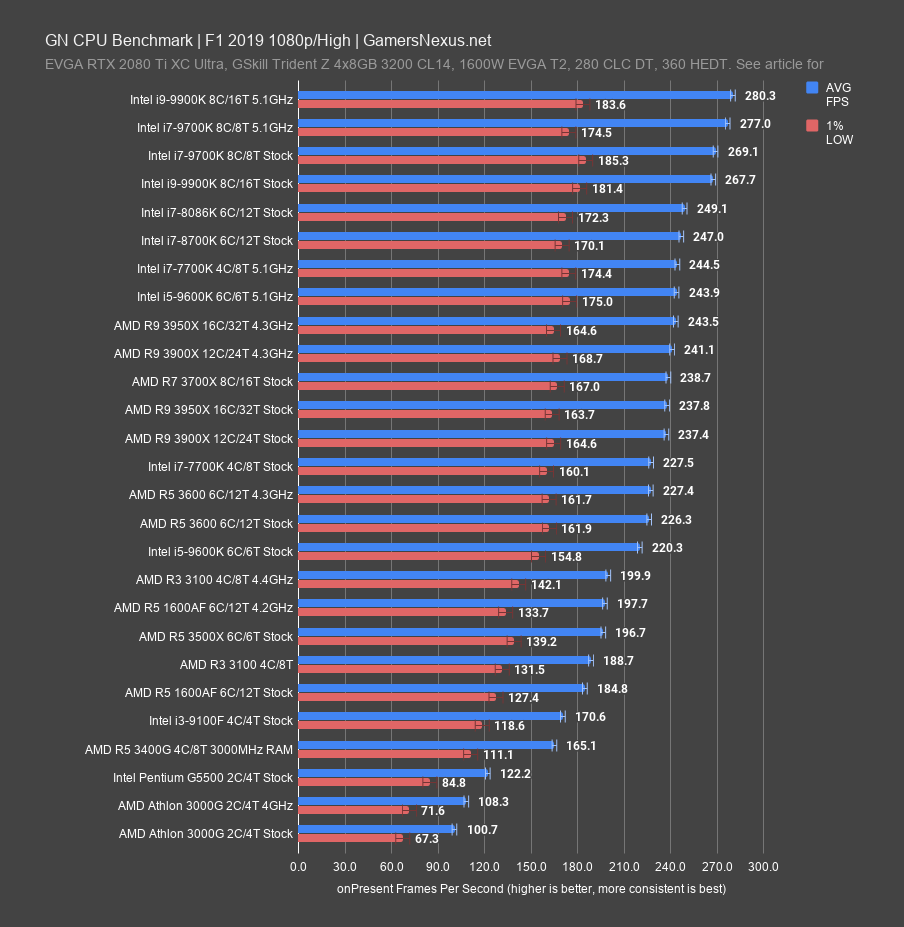
F1 2019 at 1080p plots the AMD R3 3100 at 189FPS AVG, with lows measurably behind the 3500X and averages not too distant. The 1600AF technically plots below the 3100 here in both AVG FPS and lows, another nod to the frequency delta. The 9100F allows the 3100 a lead of 11%. The 7700K stock CPU isn’t close to the 3100, leading it by 21% in AVG FPS and also leading in frametime consistency. The 7700K OC’s 245FPS AVG leads the 3100 OC by 22%. The 3100 OC at 200FPS AVG is only a 6% jump, but the 3300X OC should be the more interesting of the two to look at. That test is running while we’re voicing this script.
F1 2019 (1440p)
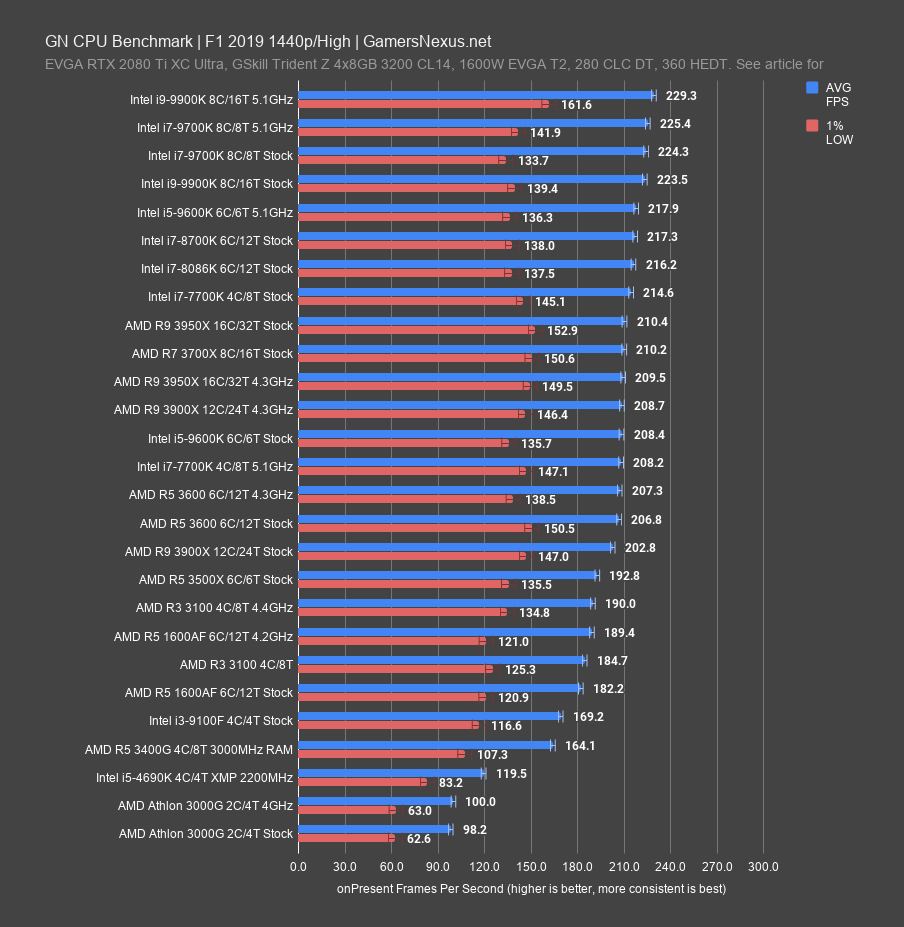
At 1440p, the results are now squashed by a limited GPU ceiling, and so the scaling shrinks. The 7700K still leads at 215FPS AVG, a gap of 17% rather than the initial 21% at 1080p. The 1600AF is close enough that there’s not any meaningful difference between the two, and the 9100F is still led by the 3100. The 3100 OC runs 190FPS AVG.
Shadow of the Tomb Raider (1080p)
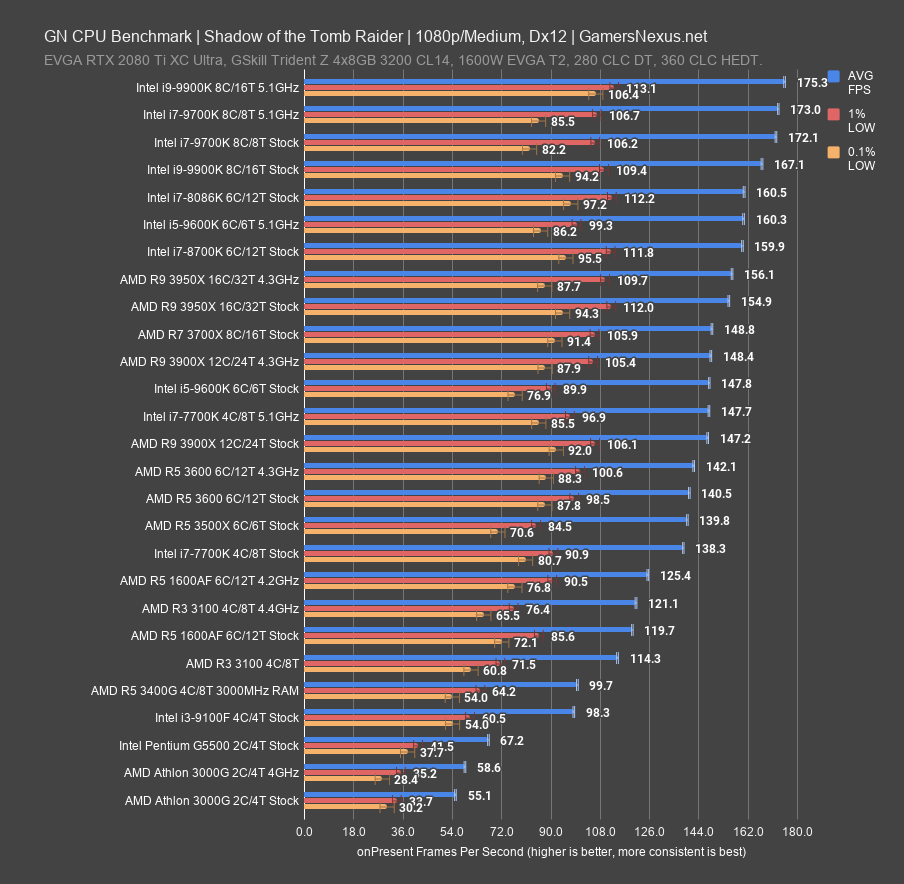
Shadow of the Tomb Raider is next. For this one, the R3 3100 runs 114FPS AVG, again flanked by the 1600AF stock and OC, with technically worse frametime consistency, but not in a meaningful or particularly noticeable way. The 9100F drags behind, allowing the 3100 a lead of 16%. The stack doesn’t look that different, so we can bring the game benchmarks to a close shortly as we’ve established a pattern. The 7700K leads at 138FPS AVG, a 21% jaunt over the 3100, with an overclock pushing it to 148FPS AVG. That lands the 7700K OC about 22% ahead of the 3100 OC. As for the 3600 reference point, that’s at about 140FPS AVG stock, so slightly higher percentage scaling to the 7700K stock.
Civilization VI
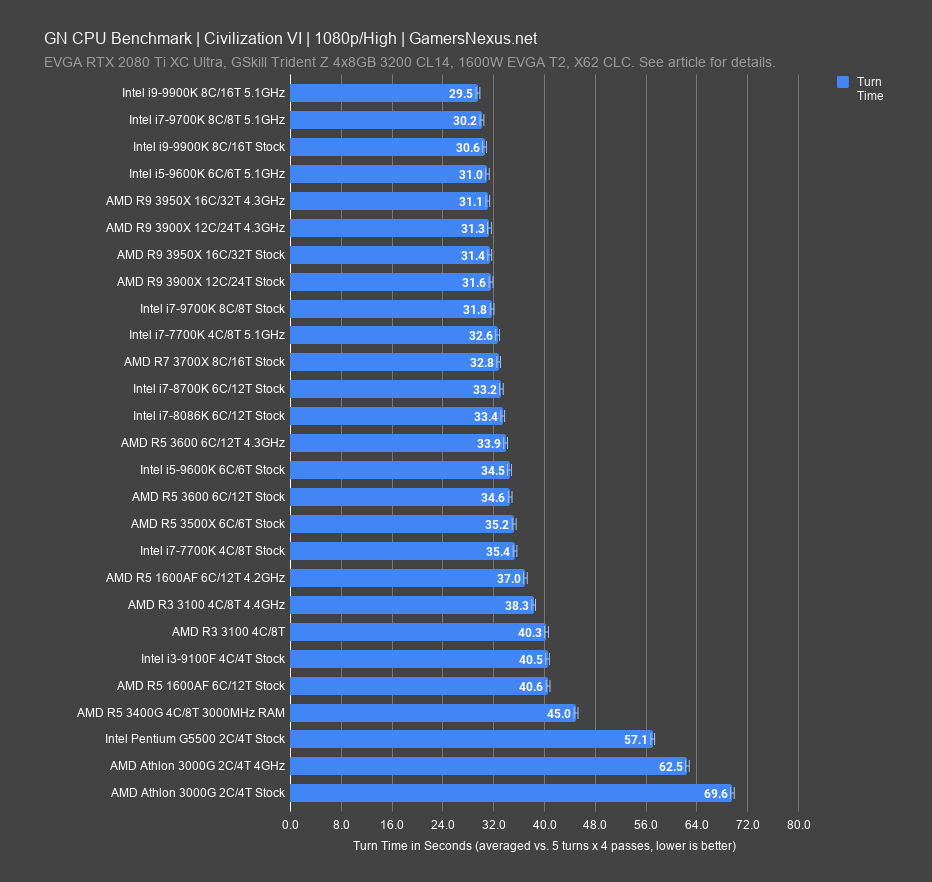
Civilization VI is up now, a turn time benchmark to determine AI turn processing time on a grand strategy map. The R3 3100 requires 40.3 seconds per turn to process across 5 AI players taking 4 turns each, which has it roughly equal to the 9100F and 1600AF stock CPUs. The 1600AF OC leads by a few seconds, a reduction of 8%, while the 3100 OC reduces time required by 5% against the 3100 stock numbers. The 7700K runs at 35.4 seconds – not that impressive, but a drop nonetheless of 12% versus the 3100 stock CPU. The R5 3600 posts diminishing returns to some extent, at least for the price gap, as this game is more frequency-dependent than it is core dependent. The 3100 OC allows us to closer approach the 1600AF OC result, although it required a much higher frequency than the 1600AF.
GTA V (1080p)
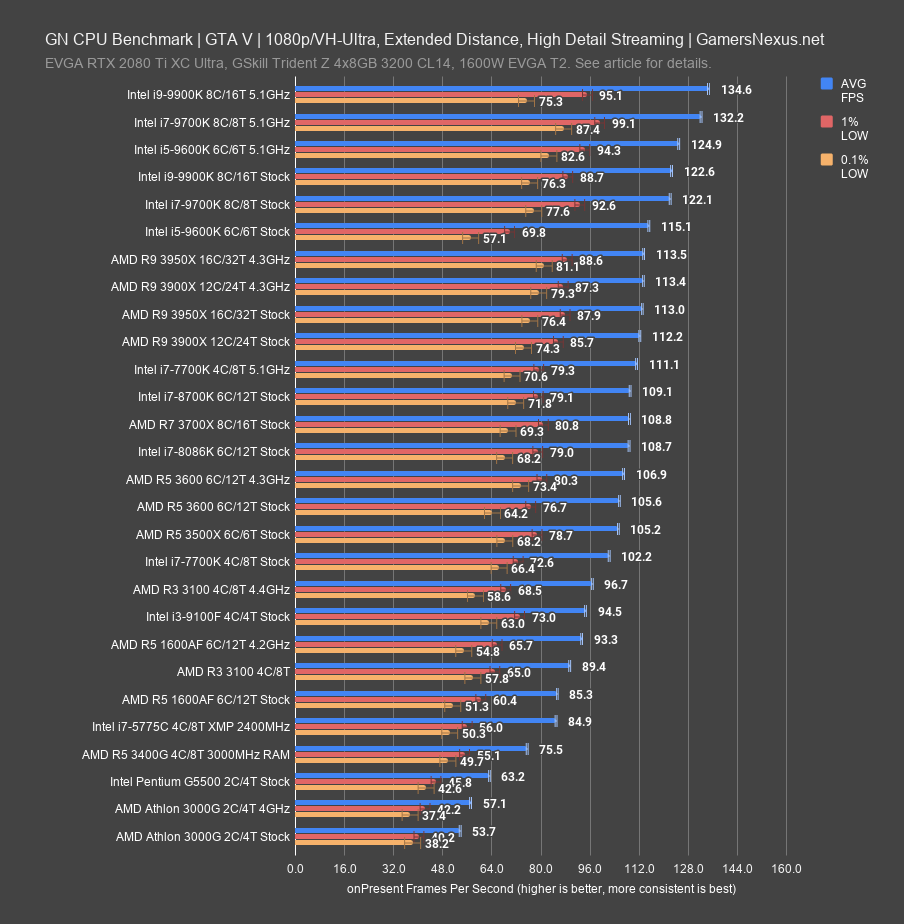
GTA V will be our last one. We also have Hitman 2 numbers and a couple other games, but need to leave airtime for the production and power benchmarks next. GTA V gives us a good look at a lower-end, older title on Dx11 that’s still among the most played worldwide. At 1080p, the R3 3100 places again between the 1600AF stock and OC, with the 9100F in a technical albeit imperceptible lead. This is one of those instances where you should be basing the purchase on the aggregate of the data: The Division 2 is an outlier in AMD’s favor as GTA V is an outlier in the 9100F’s favor, and neither is representative of the whole, but both are real games that are at least individually representative. Overclocking the 3100 puts it at 97FPS AVG, while the 7700K runs 111FPS AVG overclocked and 102FPS AVG stock.
PRODUCTION BENCHMARKS
Blender 2.81 – Monkey Heads
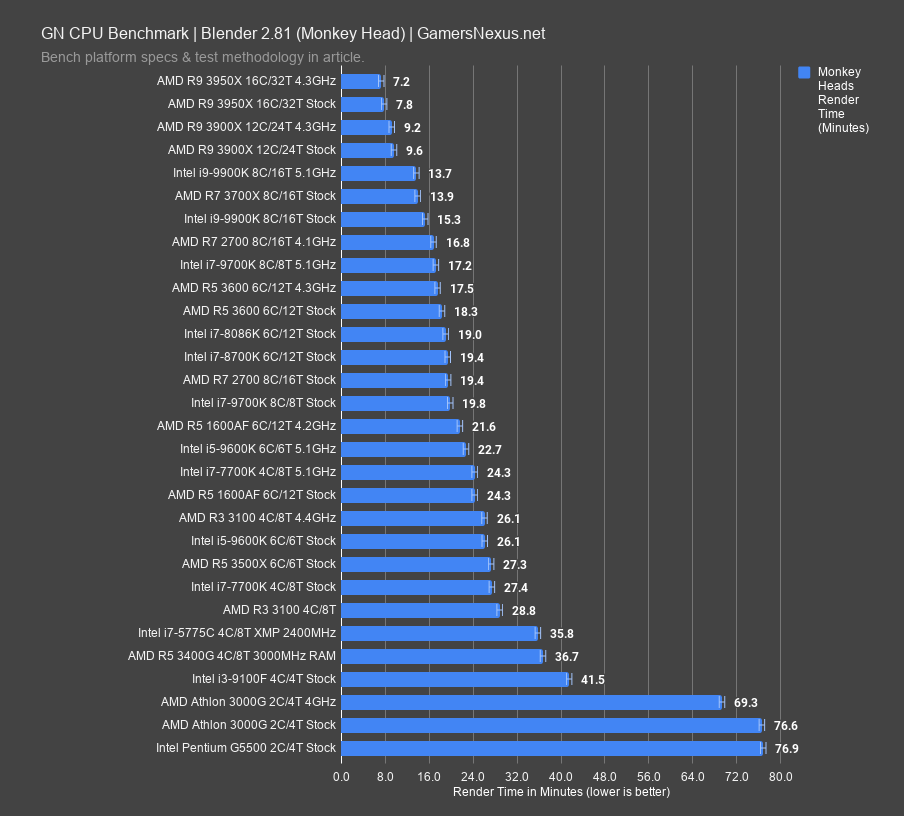
We’re moving into production benchmarks now, starting with Blender 2.81 for a tile-based renderer that deploys each CPU thread as a tile to be independently rendered in our specially-crafted benchmark scenes that we built in-house. Blender is tested in minutes to complete a render, so lower is better. Remember that animations often involved 24, 30, or 60FPS, and so each one of these frames rendered is but a small part of the whole. That means a reduction in time against one frame has significant knock-on effect for longer animations.
The first is the GN Monkey Head render. In this one, the AMD R3 3100 stock CPU requires 29 minutes to complete the render. That puts it just behind the Intel i7-7700K stock, which requires 4.9% less time to render. Overclocking the AMD R3 3100 gets it to 26 minutes, next to the 9600K and 1600AF, whereas the Intel i7-7700K 5.1GHz OC – which was a pretty huge OC for its time – landed at 24 minutes. Other budget chips include the 1600 AF – which is basically a 2600 – at 24.3 minutes, tied with the 7700K OC. That makes it better than the stock 3100 by 15.6%. The improvement with an OC is even greater, assuming you can ever find a 1600 AF to buy for under $100 again. The 9100F is left far behind and the 9600K is behind the 1600 AF stock, so we’ll need to wait for Intel’s next round for a bump.
Blender 2.81 – GN Logo
![]()
For the GN Logo render, the 3100 stock CPU completes in 36 minutes, about tied with the 7700K stock CPU. The 9600K barely outperforms both at around 2x the price, with a 3100 overclock landing it at 32.1 and 7700K overclock landing at 31 minutes. The 1600 AF remains the unicorn here, because we’re uncertain of if it’s even still in production and if it’ll ever be available at the $85 price it was at in January. That’s going to be the CPU that got away for a lot of people.
Adobe Premiere – 1080p
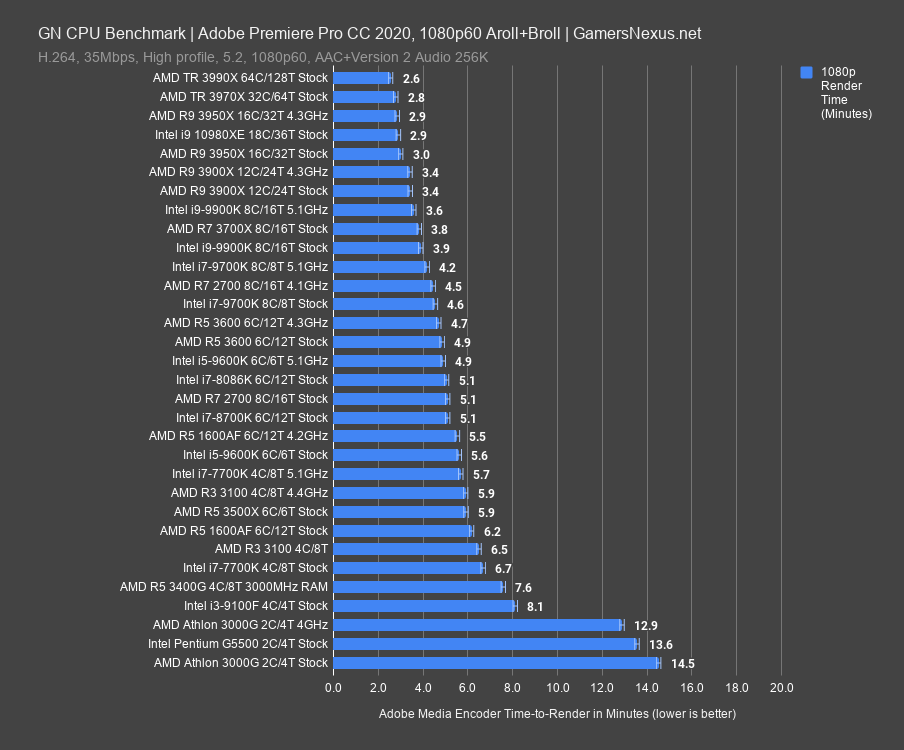
Adobe Premiere is next. This is a render benchmark using real videos we’ve made for our channel, including a 1080p60 convention video and a 4K60 set of broll. If you do work on YouTube and your videos are somewhat similar to ours in concept, you can easily draw conclusions from our results.
The 1080p video is easier to render, and the 3100 stock finishes in 6.5 minutes, just ahead of the 6.7-minute result of the 7700K stock (although the 7700K jumps to 5.7 minutes at 5.1GHz, a reduction of 15%). The overclocked 3100 manages to complete the same render in 5.9 minutes, a noteworthy reduction of 9%. The 1600AF runs at 6.2 minutes, just ahead of the 3100 with thanks to additional threads, and the i3-9100F is still generally inadvisable for this type of workload given its thread and frequency deficit. It’s low power, but without an IGP, there’s not much hidden value in the CPU beyond that, and low power doesn’t count for much when you’re talking about maximizing performance for the dollar.
Adobe Premiere – 4K
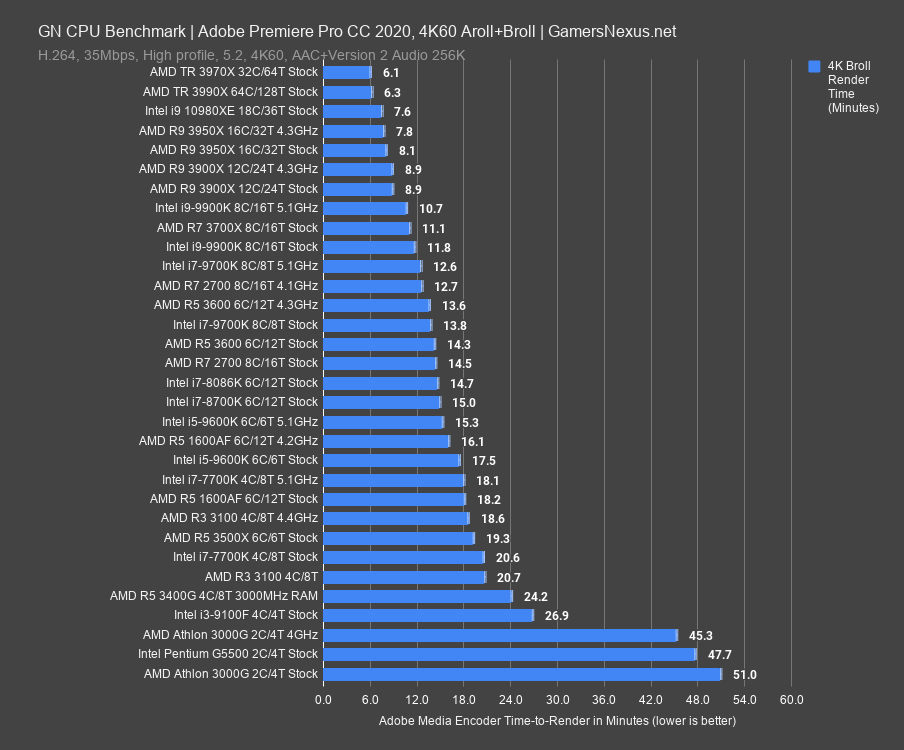
Our 4K render is much more time-intensive for these lower-end CPUs. The 3100 completes the render in 21 minutes, which has it about tied and within variance of the 7700K stock. The 3500X 6C/6T part is outperforming the 4C/8T 3100 once again, and if you’re wondering why, it’s because of the 4.1GHz boost frequency over the 3100’s 3.9GHz stock boost. The 3500X isn’t commonly available outside of China, so this isn’t much to consider other than for intrigue. Ultimately, even at 8 threads, this workload ends up on the brutal side for the 3100 stock CPU, which suffers from lower frequencies. The R5 3600 at 4.3GHz is a good example of what one tier up will get you, if an extra $80 is in the budget. As for the 3100 overclock, that’s at 18.6 minutes, a reduction of 10% versus stock.
Photoshop
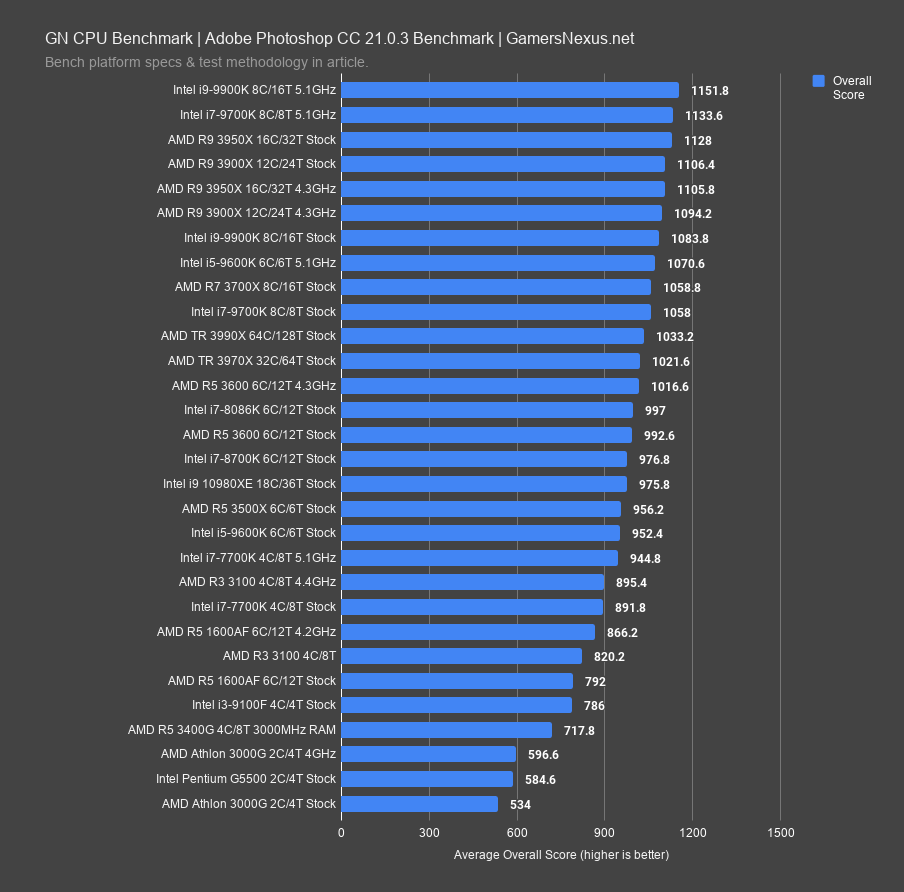
Photoshop will appear quickly. For this one, we test transforms, filters, blend layers, and a lot of other features, and we’ve found that the new Photoshop is still largely dependent on higher frequencies. We always point to the 9700K and 9900K OCs to prove this. The 3100 is flanked by the 1600AF on either side, thanks to its higher boost frequency natively, and the 7700K leads by about 9% stock-to-stock. The 9100F isn’t too far back, but is led by the 3100 by 4.4%. None of these are great CPUs for advanced users of Photoshop or those who may do this as any form of income. A jaunt to the 3600 for versatility or higher-clocked 9000-series parts would be worthy of consideration if justifiable in the work budget. The 3100 OC pushes to 895 points, between the two 7700K entries.
7-Zip
7-Zip is next. This one tests decompression and compression workloads. We’ll start with decompression, scored in millions of instructions per second, or MIPS.
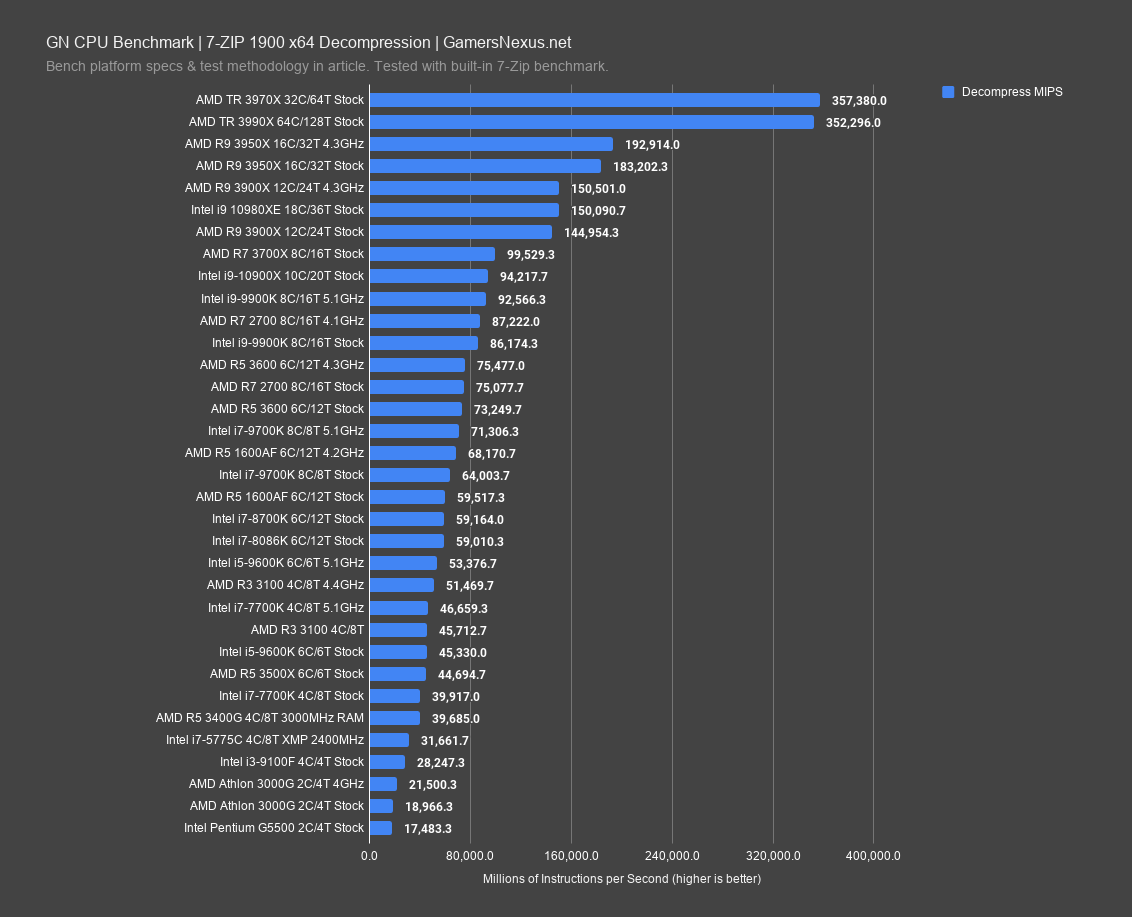
The AMD 3100 stock CPU scores 45.7K MIPS, putting it just behind the 7700K 5.1GHz OC at 46.7K MIPS, and ahead of the 7700K stock performance by 15%. The CPU is similar to the 9600K, which we’ve never particularly recommended, and that CPU slips further with its 2x price-point for equivalent performance.
The 3500X does well at keeping up, while the 1600AF outpaces the 3100. If you’re debating between spending $100 and $180, given current 3600 prices, then the extra $80 would gain you about 65% more performance in this application. That’s a big jump for $80 and would be worth considering for anyone more bound by the CPU. At this point, AMD really is only competing with itself in these lower price points. As for the top of the chart, remember that Threadripper is, we think, bouncing off of bandwidth limitations. As for a 3100 OC, that gets us to 51K.
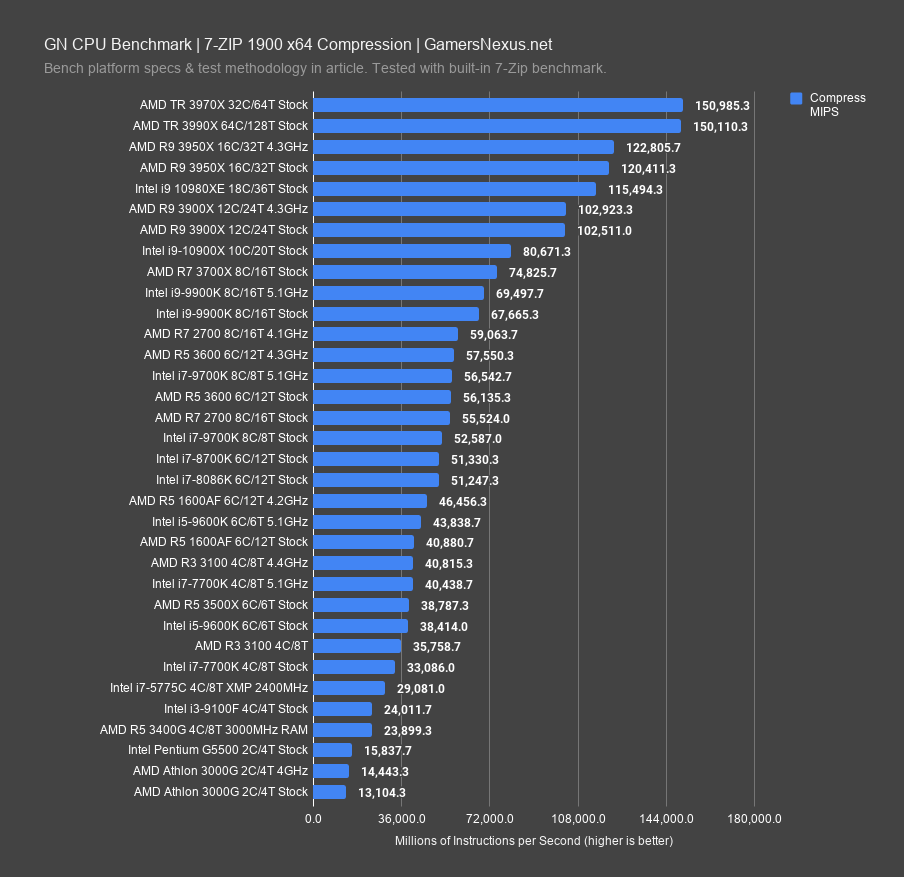
Compression is next. For this one, the 3100 runs 36K MIPS, right between the 9600K and 7700K stock CPUs. The 7700K hasn’t aged well stock, clearly, but overclocking does gain meaningfully and push it to just below the 1600AF stock CPU. Once again, were it to still exist, the 1600 AF would be the best deal – but we’d be surprised if AMD makes enough of those to sate demand now that it has a more expensive part. In the face of AMD’s under-the-radar 2600 re-fresh as a numerically reduced part, the 3100 looks disappointing, but it’s still objectively a good performer at the price point – just not as good. The 3100 OC puts us at about 41K.
Chromium
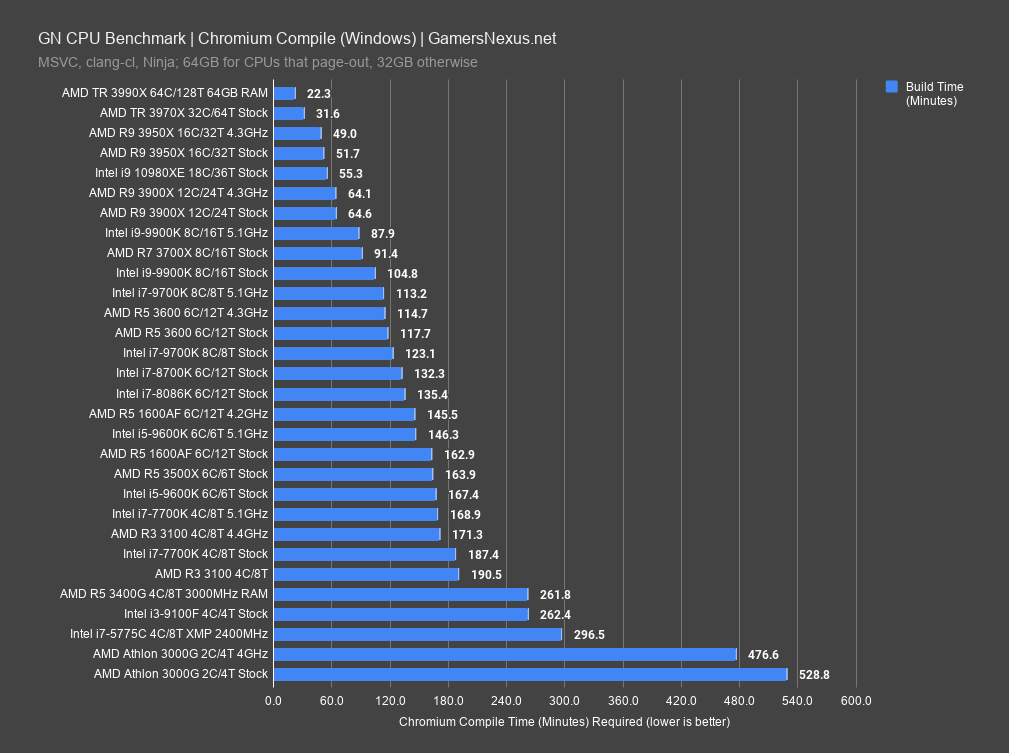
Chromium is the last production benchmark we’ll look at today. This is a code compile benchmark, so out of what the 3100 is sold to do, but certainly something it can do. The AMD R3 3100 required 191 minutes to build Chromium, positioning it as unremarkably different from the 7700K, allowing the 9600K a reduction of about 12%, and allowing the 1600AF a time reduction of about 13%. It’s certainly miles better – about 27% reduced time – than the 9100F, but we already considered that a CPU that almost no one should buy, so that’s certainly no revelation. This is a workload where extra threads help, but frequency does come into play if sufficiently changed: The 9900K stock and OC are evidence of this. AMD is competing against itself. The 3100 OC, for reference, improves with a 10% time reduction. The 3000G really blows out the scale and we probably should have removed it from the chart just for that reason, but it’s also sort of a funny reference point, so we left it there.
Power Testing
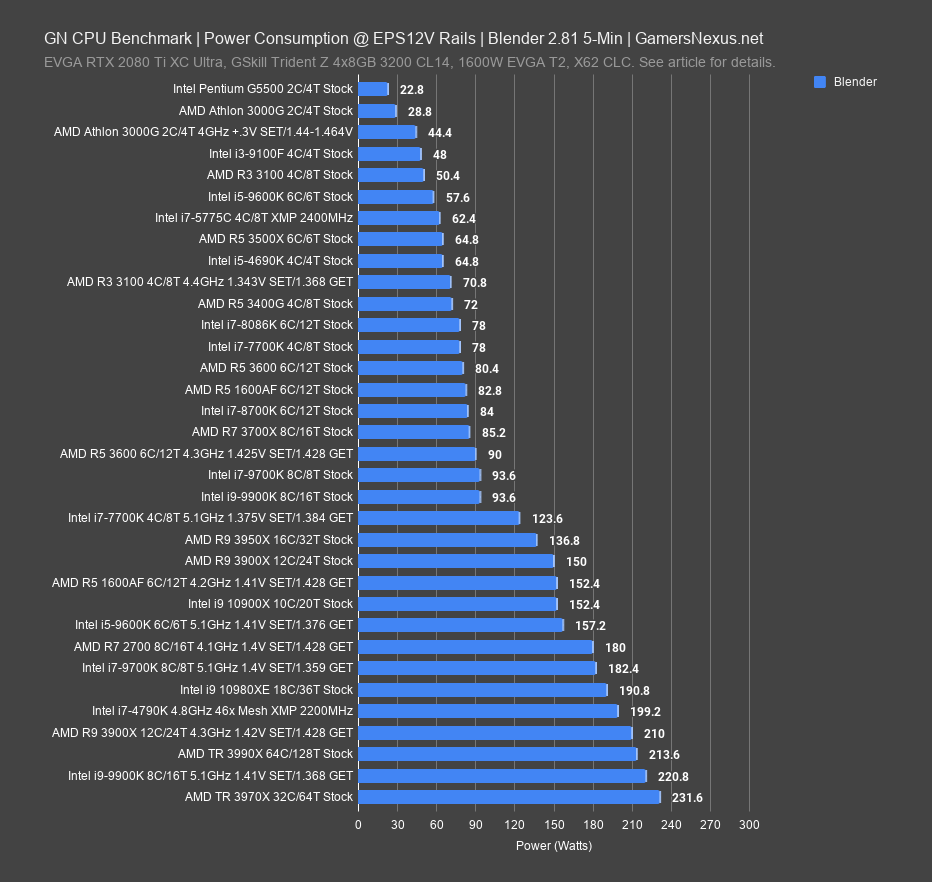
Our power testing is done at the EPS12V cables, not the wall, and so you’re looking at CPU-only power plus VRM efficiency losses. In a Blender all-core workload, the R3 3100 stock CPU consumes about 50W, comparable to a 9600K or even 9100F. It’s the latter comparison that makes the 3100 look impressive, since the 9100F was already a low-power part. The overclock adds about 21W on top of that, pushing us to around 4690K levels of power consumption and not distant from the 8086K. The voltage for the overclock was controlled and ended up more efficient in some instances than the auto voltage.

Cinebench R20 power is interesting just because it shows inside the turbo boost time limit of Intel’s CPUs, but the R3 3100 looks about the same in power consumption. The i7 and i9 CPUs, as expected, run significantly higher in these tests as a result of being measured during the maximum point of turbo boost.
Conclusion
In the face of AMD’s under-the-radar 2600 re-fresh as a numerically reduced part -- that’d be the AMD R5 1600 AF -- the R3 3100 almost looks disappointing, but it’s still objectively a good performer at the price point. It’s not as good as the $85 1600 AF, but not much will be for a long time and, as we said in these reviews, that’s going to be the CPU that got away for a lot of people. AMD is still moving the 1600 AF into retail channels, but whether or not you can grab one before the scalpers is questionable. Assuming a world where the 1600 AF is unavailable, then, the 3100 is still positioned well, it’s just that we became spoiled with the $85 12-thread CPU that managed such strong gaming performance. It’s bizarre writing about these new AMD Ryzen 3 parts, because it really does feel like ~4 years ago during our review period of the 6700K and 7700K CPUs. Intel just doesn’t have any direct competition, and so the only thing we can question for value is whether AMD’s newest launch is able to justify its existence against AMD’s other nearby products. In this instance, we’re not so sure about the 3100. It’s fine, really, but as you’ll see in our 3300X review in a few hours (it’s mostly done at time of writing this), the 3300X is really the part to pay attention to. That extra $20 gains a lot, and we’ll show that next. The R5 3600 is worthy of consideration for those with extra budget.
If you really can’t afford the $120 3300X, then no worries -- the 3100, barring the availability of the 1600 AF at $85, is worth the buy in the budget class of CPUs. The 7700K outperforms it in many instances, but it’s not like people are buying 7700Ks now, and those who do will get gouged on eBay for one, anyway. The Intel i3-9100F isn’t even competition to consider, the 3000G and 3200G fulfill different market segments (people who need an even cheaper CPU or who need an IGP), and the rest of Intel’s lineup is either too expensive to consider or not worth considering. We look forward to the 10-series testing to keep this fresh.
If you like our work and want to support it, consider buying one of our PC building modmats or supporting us on Patreon.
Editorial, Testing: Steve Burke
Testing: Patrick Lathan
Video: Keegan Gallick, Andrew Coleman