Intel Core i9-10900K CPU Review: Gaming, Overclocking, & Benchmarks vs. AMD Ryzen
Posted on
Intel’s continuing to bring the heat, literally and figuratively, and is now leveling its new 10C/20T part squarely at AMD. We have a separate in-depth review coming up on the 10600K, which has interesting implications for the R5 3600 and the realm of gaming, but for launch, we need to start with the flagship 10900K. That’s not the 10900X, mind you, but the 10900K, which is the part socketable for LGA1200 and Z490 motherboards. We’ll be looking at whether Intel’s die sanding worked for leveling-off thermals, benchmarking games, initial overclocking on the ASUS Max XII Extreme, production workloads versus the 3900X, and more.
UPDATE: Intel i5-10600K review is now live: https://www.youtube.com/watch?v=iQVBlCfb72M
We're not going to recap the intro entirely in text, so if you want that, watch the video above. Unfortunately, our time is extremely limited these days and getting the articles live is tough work at the end of a 24-hour review cycle.
For key specs on the 10900K, check our introductory article. That contains info on die sanding, the IHS, die height, substrate proximity to the peak of the die, and specs for the Intel i9-10900K. The i5-10600K review will go up later today for us, so you can check back on YouTube for that. We have some complaining about BIOS maturity in the beginning of the above video as well.
Benchmarks continue below.
CPU Test Methodology
To learn more about how we do our CPU testing, you can read our in-depth CPU test methodology post here.
Major Thermal Improvement
Intel i9-10900K Core-to-Core Deltas
We should test Intel’s new die sanding technique to see how it impacted thermals. We previously showed a delidded 10900K and explained that the silicon has been brought closer to the IHS, and that the IHS is also thicker as a result. We remarked that this should improve core-to-core deltas, which would improve overclocking potential by lowering limits encountered from thermal headroom. Of course, this will also vary chip-to-chip from soldering differences. The link in this paragraph leads to photos of a delidded 10900K and more information on the reduced silicon height, the amount of reduction, and the thickness of the IHS.
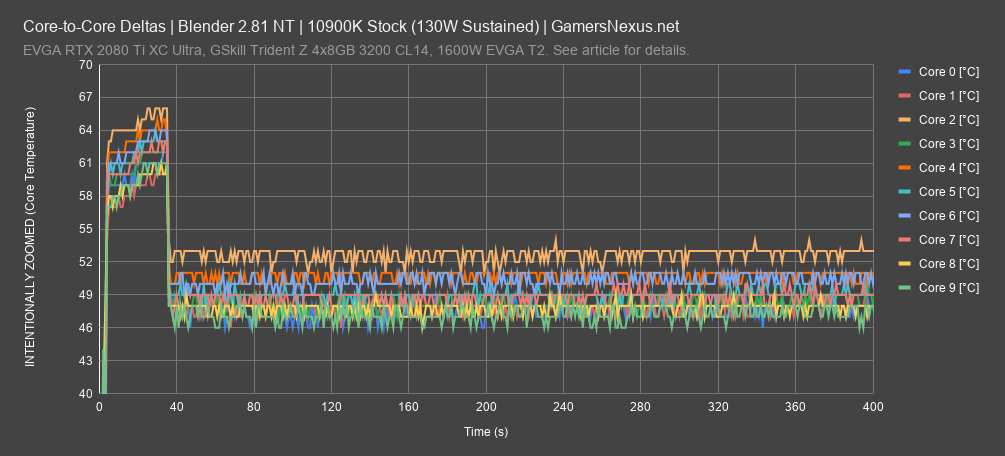
If we plot the individual cores and then zoom the chart to a 40-70 degree range, we can get a closer look at core-to-core deltas in the 10900K. This zoom is to help with visibility; we realize that it’s suboptimal for data presentation, but for this style of chart, we need the granularity. The range isn’t as bad as we saw in the 9980XE, which plotted upwards and beyond 30-40C core-to-core in our testing. Here, our max range is 53C to about 46C, with the average closer to 53 and 48. That’s only a 5-degree core-to-core range, but for perspective, we need more charts.
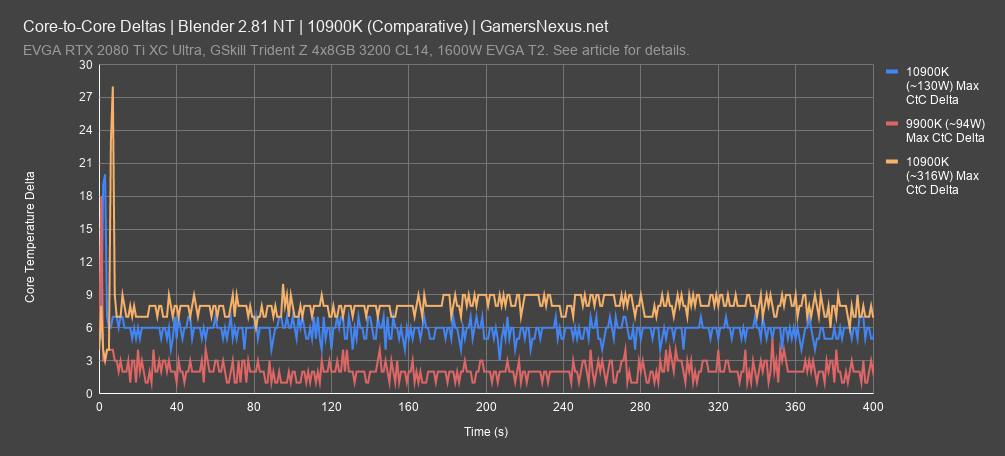
In this one, we’re adding the 9900K stock -- sustained at 94W after Tau expiry -- and the 10900K OC at about 316W from the EPS12V cables. That’s roughly our max overclock without using exotic cooling. The 10900K’s maximum range is the data from the previous chart. The 9900K plots below that, unsurprisingly, because it’s at a low power load. The 10900K with a 316W overclock has it at a maximum core-to-core delta of 9 degrees, which is insane. In our experience, we’ve run into chips ranging between 16C and 40C for core-to-core deltas, depending on the SKU and the CPU. Some of this 9C gap is probably thanks to Intel’s improvements, although we could have also gotten lucky.
Intel i9-10900K Expected Behavior & Turbo Boost
AMD and Intel CPUs have gotten advanced to the point of it being confusing whether they’re running at official spec lately. “Official spec” is also confusing, since there often really isn’t one -- there’s official “guidance” for motherboard manufacturers, but as far as spec, our definition is that we run Intel within PL1, PL2, and Tau (or Turbo time expiry) as defined by Intel. We do similar for AMD, although terminology changes.
We obtained a tool through our contacts that helps verify if the CPU is actually running at full Intel stock settings, because you could otherwise end up testing in a scenario which blasts the power limit and ignores Tau, at which point it’s no longer a valid test.
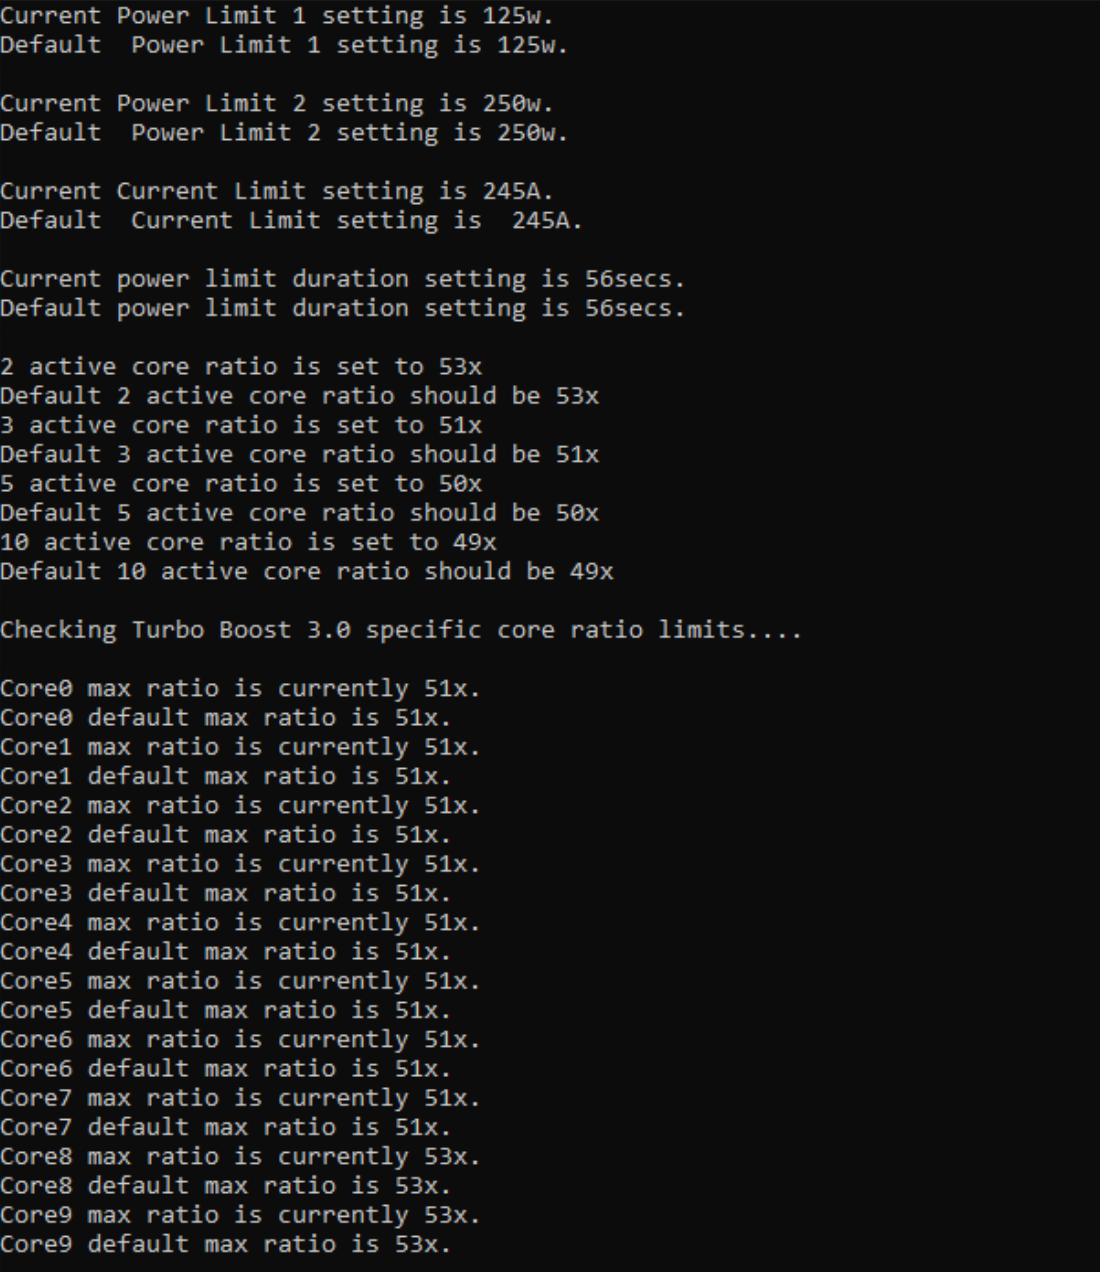
Here’s what that command line tool spits out.
This is with the i9-10900K under stock CPU settings. The only thing we’ve tuned is our RAM to fit our standardized CPU review timings and speeds. The target result is under each line, so we see PL1 is 125W, PL2 is 250W (or 1.25x PL1), Tau is 56 seconds, and we see that only Core8 and Core9 should hit 5.3GHz under full boost allowance.
Intel i9-10900K Frequency Log - Cinebench
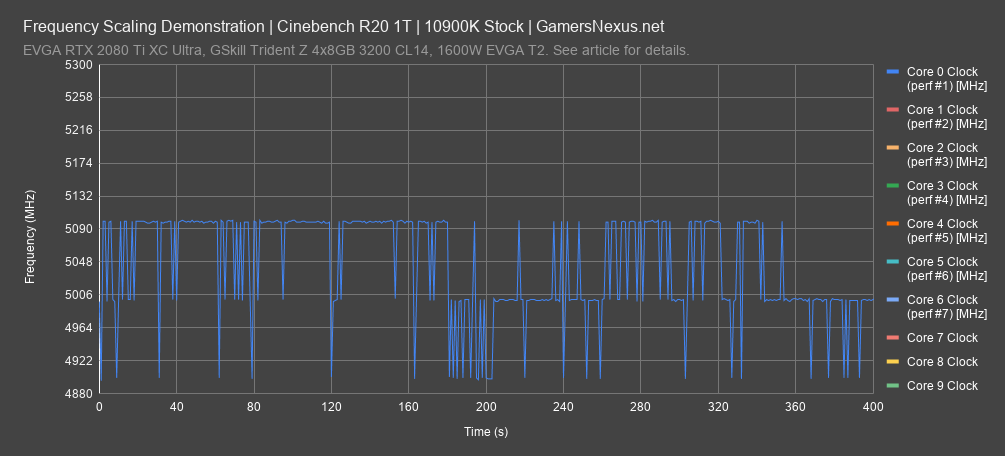
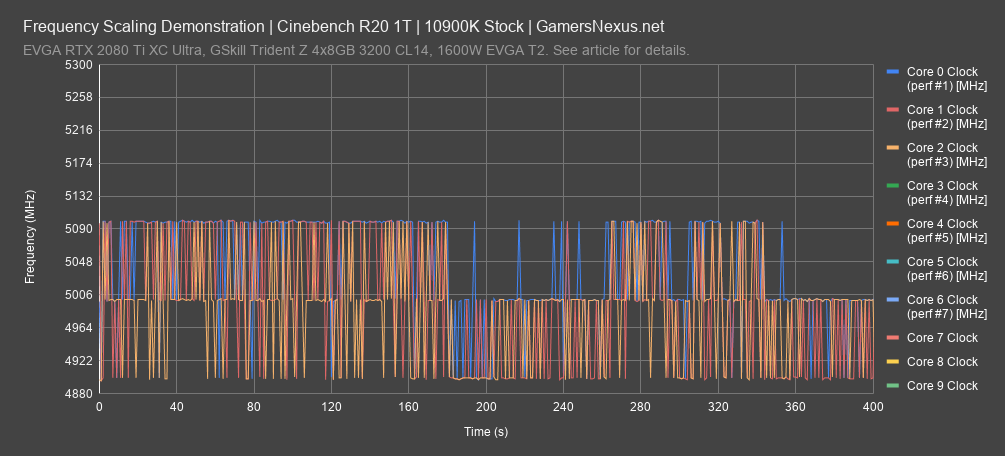
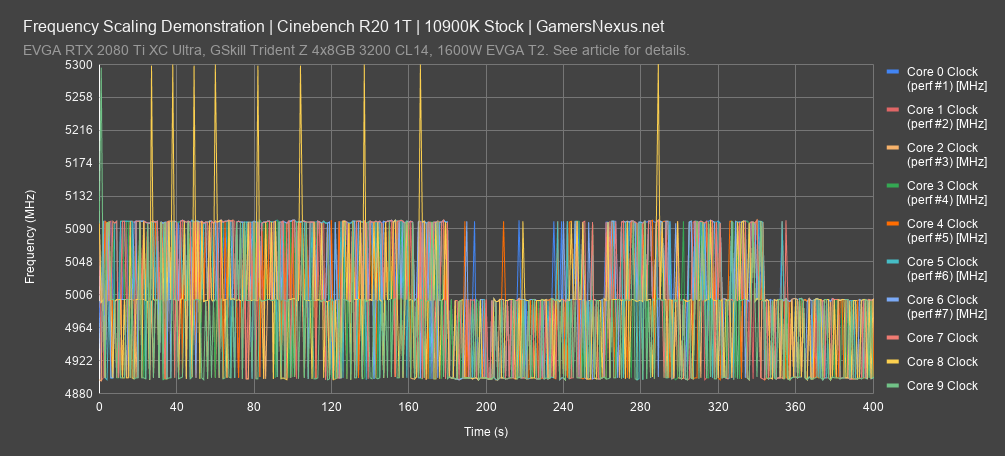
We need to make sure this CPU is working as expected prior to continuing, so we’ll begin with Cinebench R20 mapped against each core to evaluate its peak clock under a single-threaded workload. We’ll show a simplified version of this nigh-illegible chart in a second. These charts will all be zoomed-in drastically to help make the data peaks more legible.
In this one, you can see that the base clock is running at 4.9GHz for the 10900K in our Maximus XII board. Boost is often hitting about 5100MHz, with a few spikes to 5300MHz under TVB parameters. The average sustained clock is 5.1GHz boost, while the TVB 5.3GHz frequency is executing occasionally. Only Core 8 and Core 9 hit 5.3GHz, which is what the Intel spec dictates for at least this specific CPU. We’re not sure if other CPUs may reassign the two TVB cores based upon silicon quality. Note that R20 uses AVX, so this limited reach to TVB is expected.
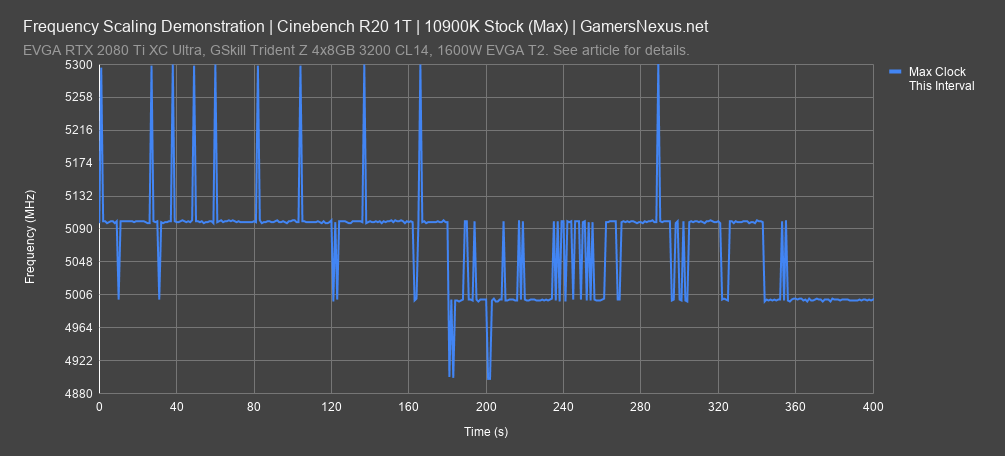
Here’s a simplified chart. This one shows only the maximum frequency of any given core during the workload. As shown, we’re closer to 5.1GHz average with AVX Cinebench R20 1T, with spikes occasionally to 5.3GHz.
Intel i9-10900K Frequency Log - Blender
Our next chart is for a Blender all-core workload. We’re showing the average all-core frequency, because this is a tile-based renderer that loads each thread with one tile, and so we’re in a 100% CPU load scenario. The result is an average all-core frequency of about 4156 to 4170MHz. For reference, we’ll plot the 9900K as well. The 9900K held an average of about 3973 to 4000MHz all-core, so this is an all-core frequency bump of about 150-170MHz on an additional 2 cores and 4 threads, which is a significant improvement when considering Intel left its pricing alone for the 10900K. We’ll see how retail lines-up.
Time to get into some games.
Total War: Three Kingdoms Campaign (1080p)
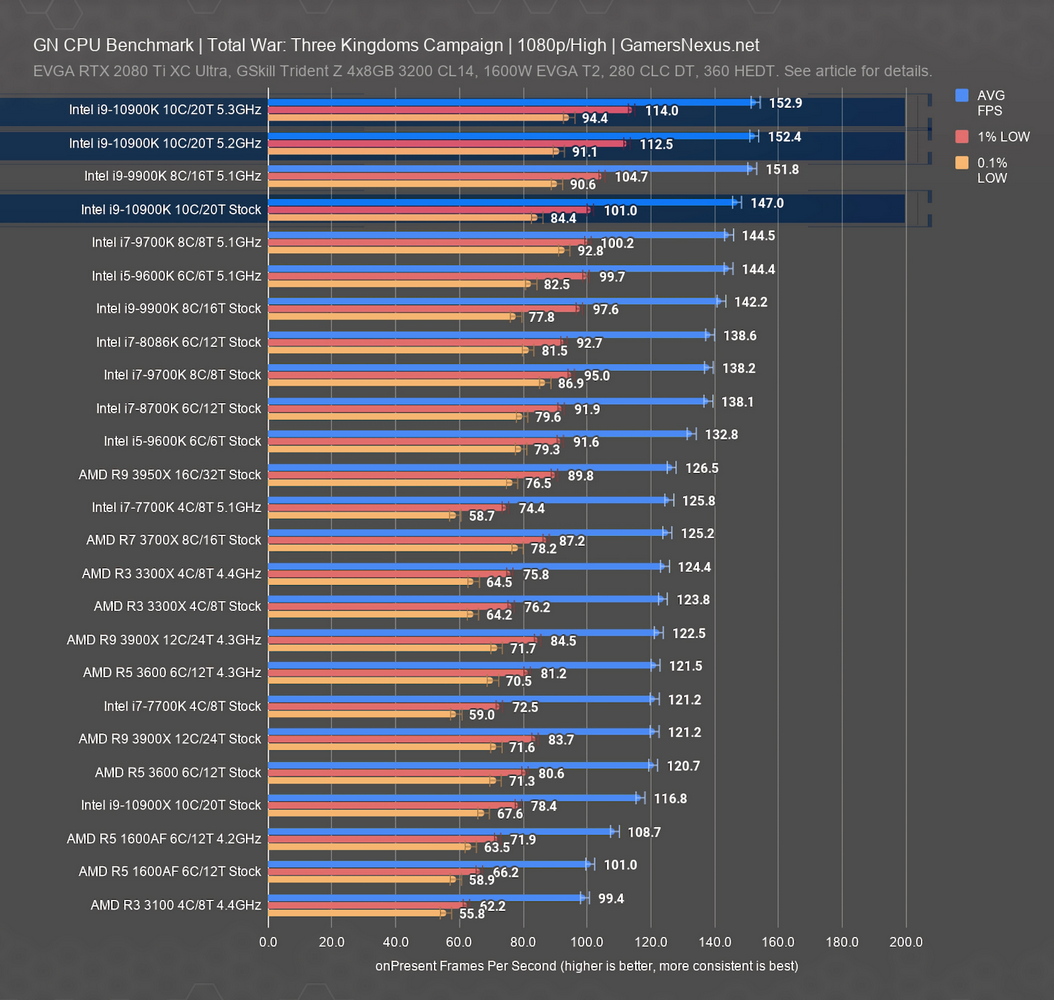
Our gaming tests will start with Total War: Three Kingdoms and its campaign benchmark at 1080p. The 10900K stock CPU plots at 147FPS AVG for this one, ranking it between the 9900K at 5.1GHz and 9700K at 5.1GHz. The frametimes aren’t meaningfully changed and are mostly within run-to-run variance. Overclocking to 5.2GHz shows that this game still has some room to scale with frequency, so we’re not as limited by realistic GPU bottlenecks as we will be elsewhere. The 10900K at 5.2GHz improves scoring by 3.7%, with 5.3GHz within range. AMD mostly occupies the lower half of the chart, with the 3900X being the closest competitor in price and ranking 121FPS AVG stock, or 123FPS AVG overclocked. AMD is hitting a wall sooner than Intel here, partly thanks to latency involved cross-CCX. Last year’s 10900X, meanwhile, remains trash value as it always was.
Hitman 2 - Dx12, 1080p
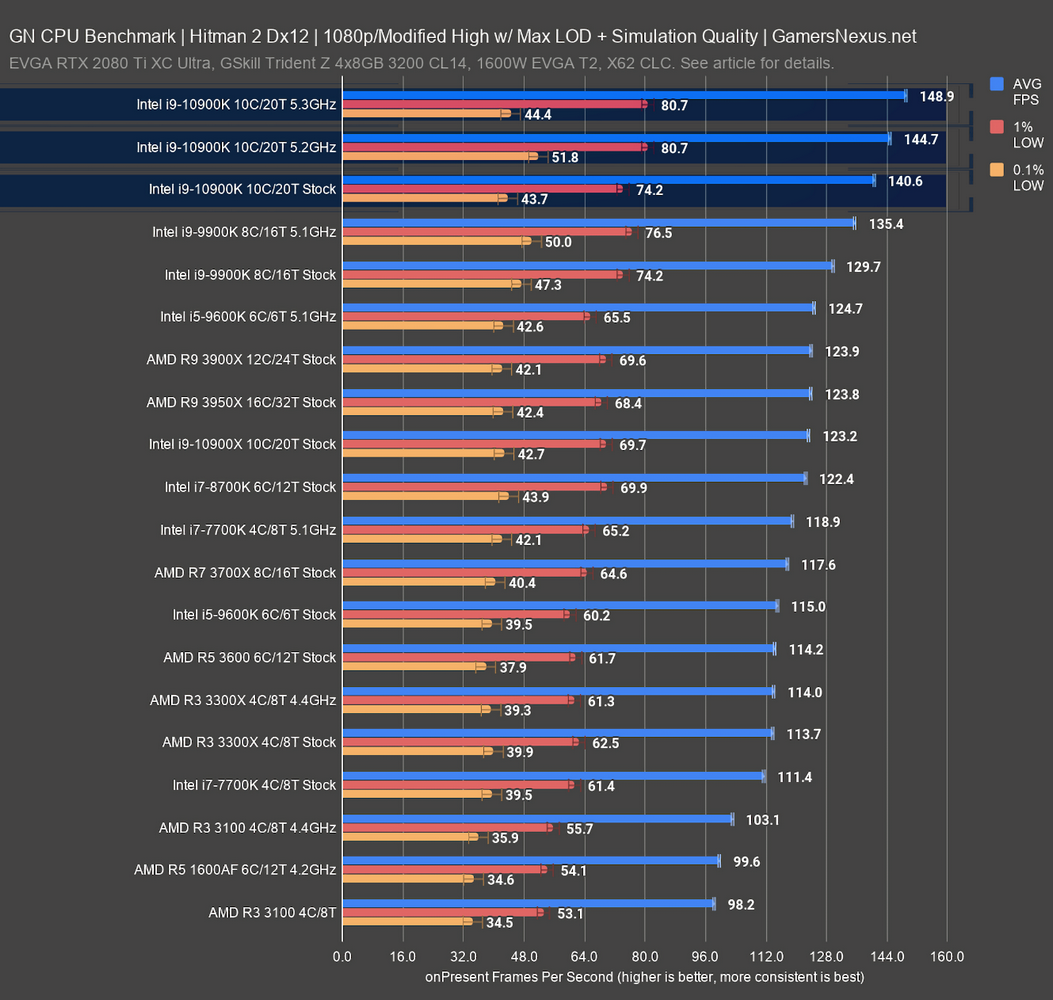
Our next one is Hitman 2. This is one of the few games where we could establish enough headroom to easily show a difference without bouncing off the GPU. In this instance, the 10900K at stock settings is the new chart-topper, at 141FPS AVG, albeit with occasional drops to the lows. The 9900K stock CPU runs 130FPS AVG, allowing the stock 10900K an improvement of 8.4%. The 5.2GHz overclock improves by 3%, with the 5.3GHz semi-stable all-core OC pushing another couple FPS. The 9900K OC previously landed at 135FPS AVG, so the 10900K is an improvement over Intel’s last processor. AMD’s 3900X is its closest competition in price and performance, and establishes the cap for AMD. The 10900K stock leads the 3900X stock by 13.5% -- although we anticipate a role reversal in the production benchmarks.
Civilization VI
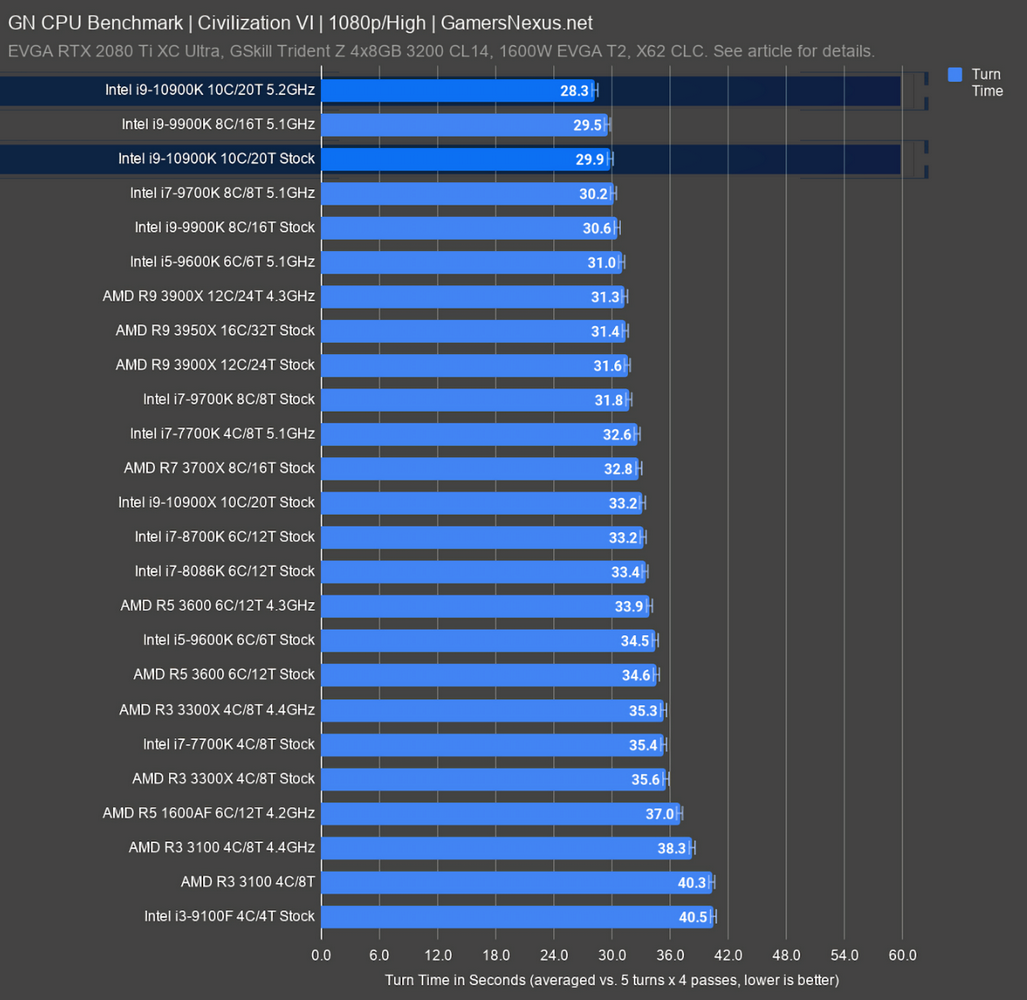
Civ VI is next, measured with turn times rather than framerates. In this one, the 10900K completes the average turn in about 29.9 seconds when fully stock. Our benchmarks with Civ have a standard deviation of fractions of a second, so the difference between the 9900K at 5.1GHz and 10900K stock is a real one -- but not particularly meaningful for the user. Versus the 9900K stock result of 30.6 seconds, we see a time reduction of 2.3%. The 10900K OC improves from stock with a further turn time reduction of 5%. AMD’s 3900X at stock and 4.3GHz ends up the highest-performing Ryzen part, allowing the 10900K stock CPU a lead of about 5.4%. There’s not much difference between these chart toppers.
F1 2019 - 1080p
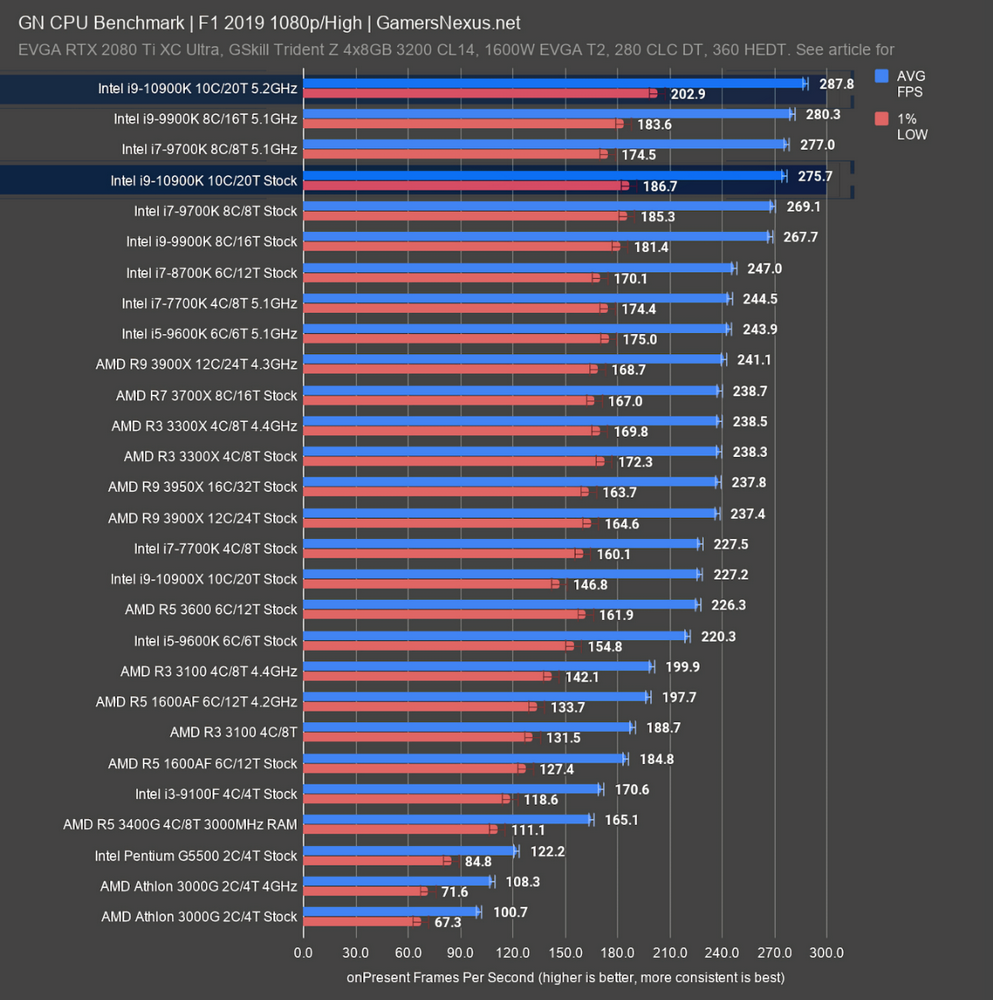
F1 2019 is up now. This one is another of the few that doesn’t hit hard bottlenecks, but it runs at ridiculous framerates where it starts to become questionable how useful the data is outside of establishing empirical deltas. Either way, the 10900K stock does scale -- it runs 276FPS AVG, whereas the 9900K and 9700K were functionally equivalent at 268-269FPS AVG. The 10900K has no meaningful difference in frametime consistency or lows from the previous series. The overclock also scales, posting a gain of 4.4% over stock -- it’s becoming bound at the top-end by the GPU, we think. The 9900K runs about 280FPS AVG. There’s no appreciable change in performance versus the 9900K or 9700K for the player, but there is a measurable one. The AMD parts, meanwhile, top-out at 239FPS AVG with the 3700X. The 10900K stock CPU leads the 3900X stock CPU by 16% in a relatively unconstrained gaming scenario, which is all that this is really useful for establishing.
F1 2019 - 1440p
At 1440p, the top-end of results is truncated as a result of the imposed GPU load. The 10900K still ends up the chart leader, although it’s basically tied with a 9900K OC, and not much better than a stock 9900K or 9700K, both of which are GPU-bound. The AMD CPUs are bound further down the stack by latency, so the gap favors Intel by about 9-13%, depending on which AMD R7 or R9 CPU we’re looking at.
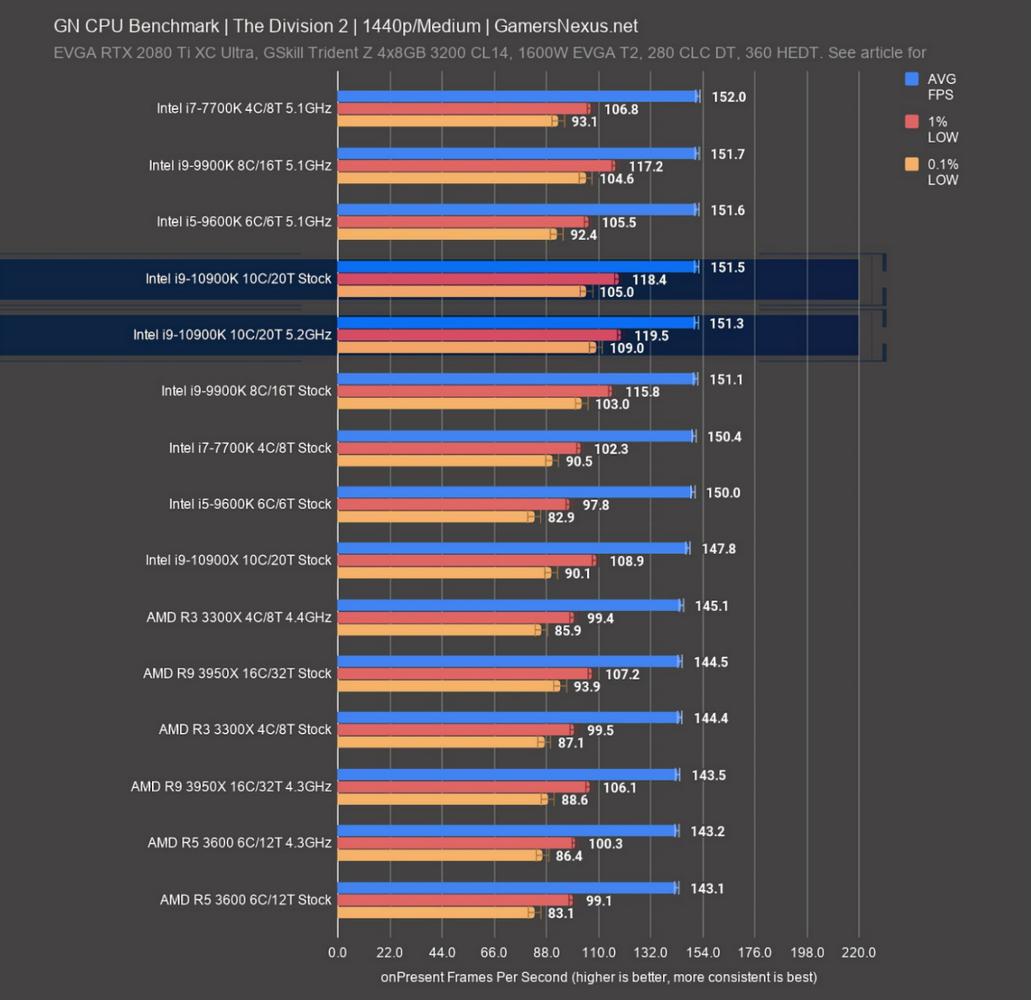
The Division 2 - 1080p
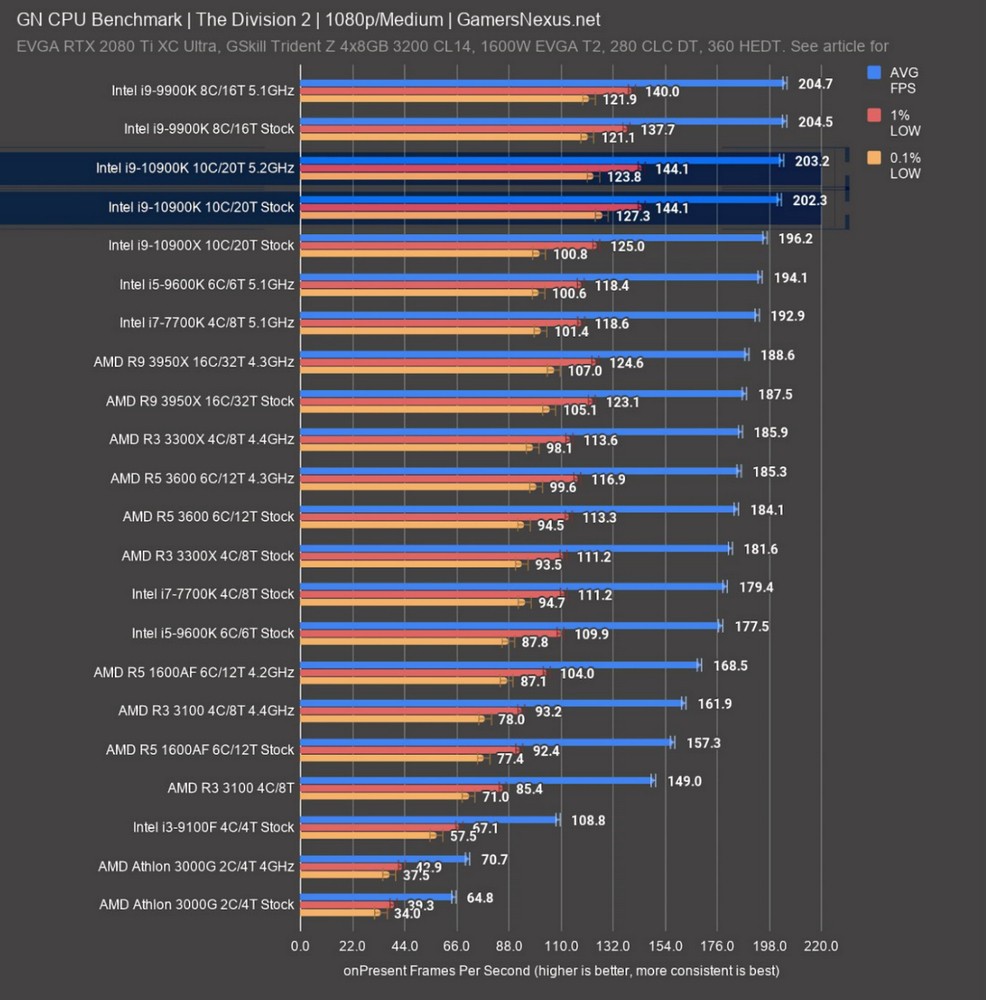
Here’s The Division 2. Now we get into a game where the usefulness of the best gaming CPU begins to show its realistic limits: Until NVIDIA releases the RTX 3000 series, this is where we’re stuck. We’re already running the game at medium settings, which seems unlikely for everyone except FPS snobs when talking a $500 CPU and likely high-end GPU. Even in this instance, the 9900K and 10900K are within the limitations imposed by the GPU. We can no longer see a difference, because we’re more bound by when the CPU bounces off the GPU limit than anything else. They’re the same, and so the 10900K provides no further value over the 9900K -- even in frametime consistency and lows. The AMD CPUs close-in at around 180-189FPS AVG. Although this isn’t useful data as a strict CPU benchmark, from a standpoint of eliminating variables, it is useful data to establish the realistic expectations that a higher-end CPU doesn’t always break the barrier.
The Division 2 - 1440p
Here’s 1440p for the same game. More of the same story -- they’re all the same at the top, and AMD and Intel are effectively equal in terms of appreciable differences. Intel technically has more consistent frametimes and better lows, but not to a visible degree for the majority of players.
Shadow of the Tomb Raider - 1080p
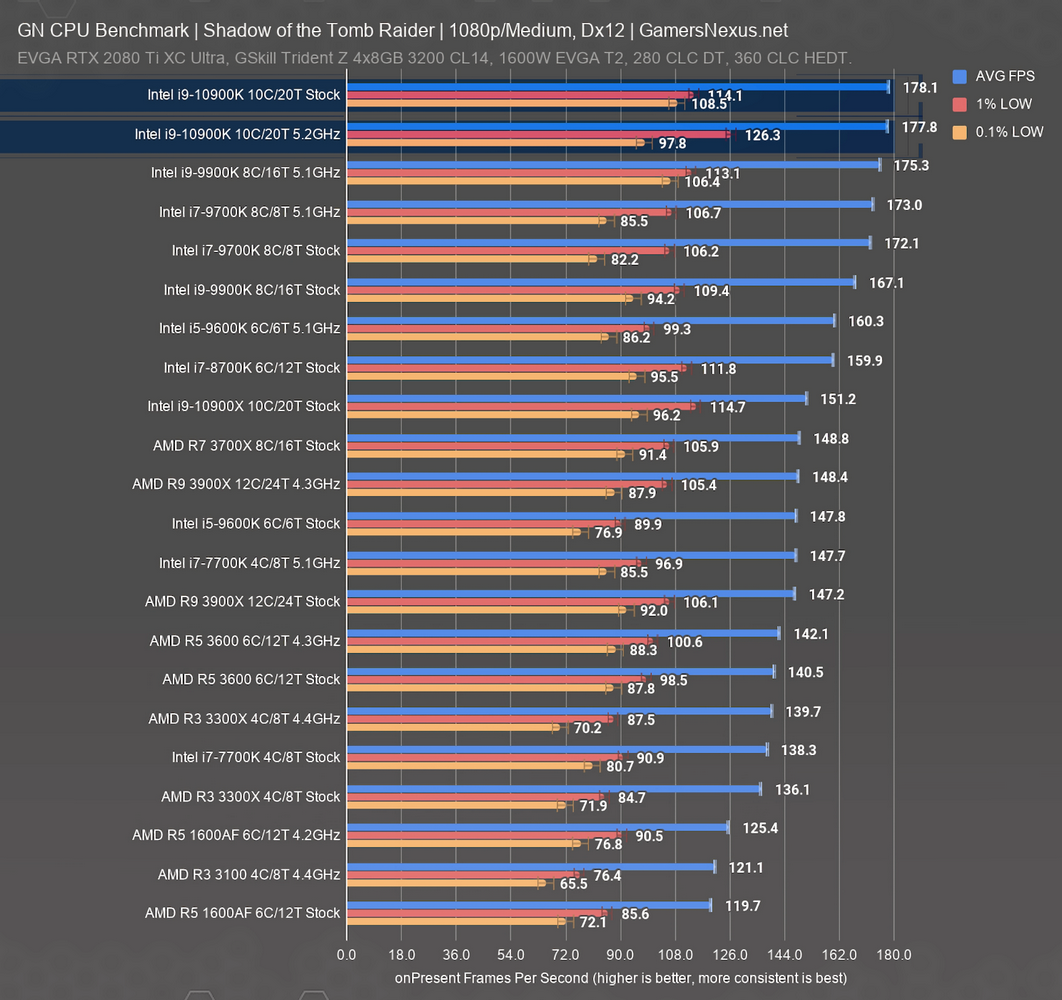
Shadow of the Tomb Raider gives us another modern game to work with. For this one, the 10900K stock and OC results end up within run-to-run variance and are equal. They outdo the 9900K stock CPU by about 6.5%, and outdo the OC marginally. AMD’s first appearance is the 3700X at 149FPS AVG, which is about tied with the embarrassingly bad 10900X from previously. That gives Intel’s stock 10900K a lead of about 19.5% over the 3700X stock CPU. The 3900X OC is similarly distant.
We’ll stop there for gaming tests. We’ve established a pattern, mostly that the 10900K will tie the 9900K in workloads where a GPU bind is present, but that differences can emerge. There’s no need to go through the rest of the games, so let’s get into production and power workloads.
PRODUCTION BENCHMARKS
Blender 2.81 - Monkey Heads
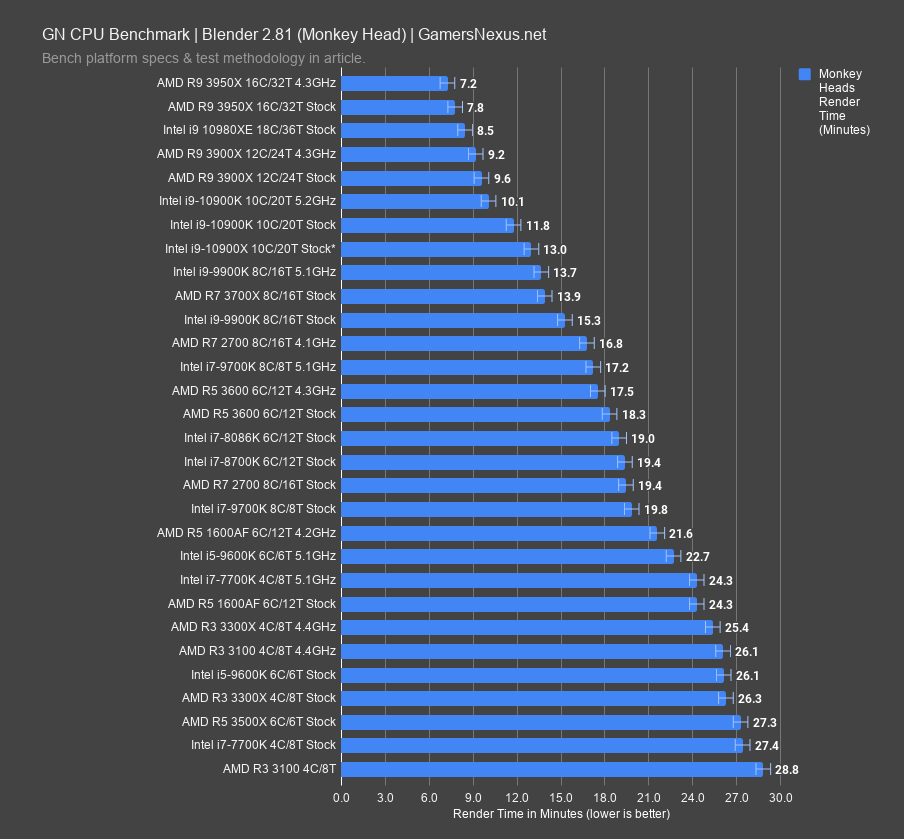
Production benchmarks are next. The 10900K will be more directly competing with the 3900X and 3950X here, although the 3900X is the most price-to-price competition. We’re starting with Blender, which is a tile-based renderer that scales with each thread present. Each thread gets its own tile in the Cycles renderer. The 10900K stock CPU finishes our GN Monkey Head render, which is custom-made to stress the CPU, in about 11.8 minutes. That puts it as improved (about 9% reduced time) over the 10900X, which has a 3.7GHz base clock and doesn’t benefit from quad-channel memory in this application. The 10900X, which we called DOA at launch, now looks even more DOA outside of cheap PCIe lanes. The 3900X stock CPU outmatches the 10900K stock CPU at 9.6 minutes, a time reduction of 19% stock-to-stock. OC-to-OC, the delta is 9%, benefitting AMD. Intel gets closer here, but not close enough. It’s getting beaten in value for this application. Regarding the 9900K, the stock-to-stock advantage is about 4 minutes, or 23% reduction.
Blender 2.81 - GN Logo
![]()
The GN Logo render is next. For this one, we have additional data present from the Threadripper CPUs. The 3990X is, obviously, a chart-topper from its 64 threads that each get a tile in the render. That’s out of the price classification of the 10900K, but gives perspective. The 10900K stock CPU runs at 15.4 minutes, and reduces time required by 18% with a 5.2GHz all-core OC, down to 12.6 minutes. The 10900X runs closer to the 10900K in this variant of our test, but the more expensive 10900X still loses. The 3900X stock 11.4-minute result outdoes the stock 10900K with a reduction of 26%. You’d be better off with the cheaper 3900X if you find yourself doing a lot of tile-based rendering on CPUs. Although CUDA is supported, Blender now has improved support for simultaneous loading of the CPU and GPU on the same frame, or you could render in opposing directions with two instances for an animation, so there is usefulness to CPU render speed. The 10900K stock-to-stock is about 21% quicker than the 9900K stock, so it’s meaningfully more versatile than Intel’s previous high-end if you wanted a gaming box that’s also a competent renderer. If you want a rendering box first, go with the 3900X.
Adobe Premiere - 1080p
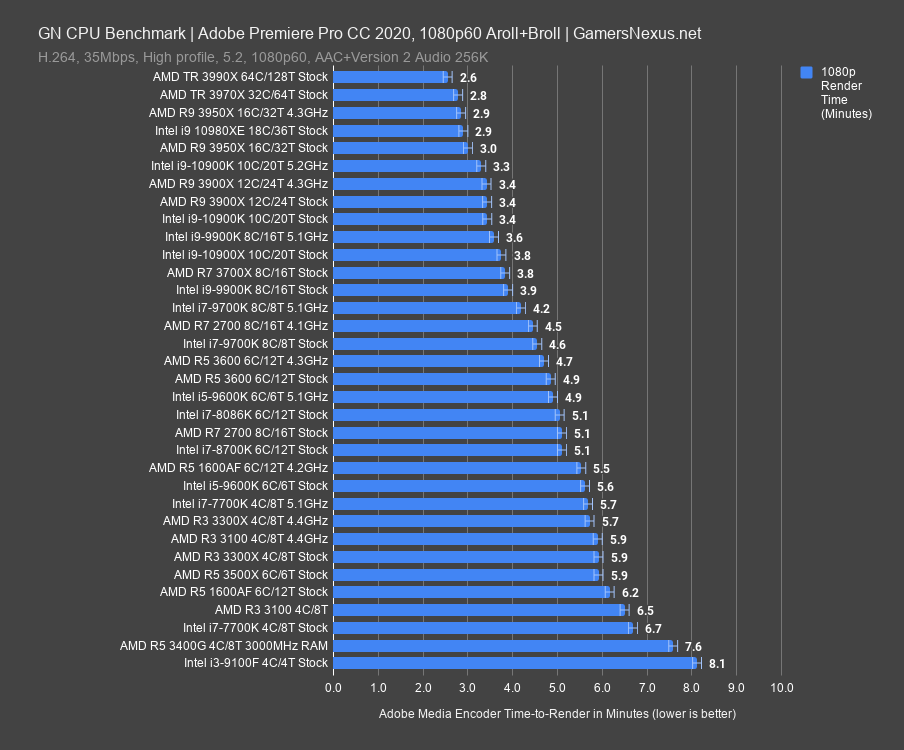
Adobe Premiere and Adobe Media Encoder are next, using two real projects that GN rendered for our YouTube channel. The first is a 1080p60 render from an ENG shoot at a convention.
The 10900K stock CPU completes the render in 3.4 minutes, with an overclock effecting little change at 3.3 minutes. The 10900K stock is close to the 9900K OC result, and better than the 9900K stock 3.9-minute result by 12.8%. The 10900X ends up at 3.8 minutes and is beaten by the 10900K without issue, even with its memory bandwidth advantage. The 3900X ends up about tied with the 10900K, winning in price but not performance. The 3950X leads both with a reduction of 12%.
Adobe Premiere - 4K
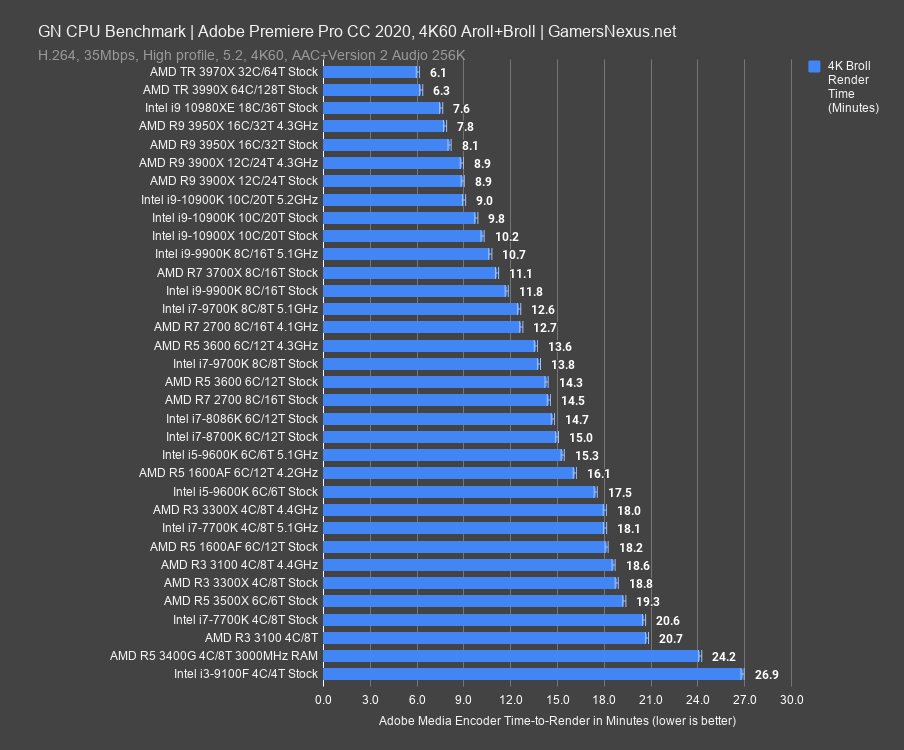
At 4K, the chart gets more exaggerated. The 10900K stock finishes the render in 9.8 minutes, or 9 with an overclock. That's a meaningful 8% reduction and gets the 10900K roughly tied with the 3900X stock and overclocked, albeit at higher power consumption. We’ll look at that in a few minutes. The 10900X, meanwhile, takes 10.2 minutes to finish, allowing the 10900K another lead.
Photoshop
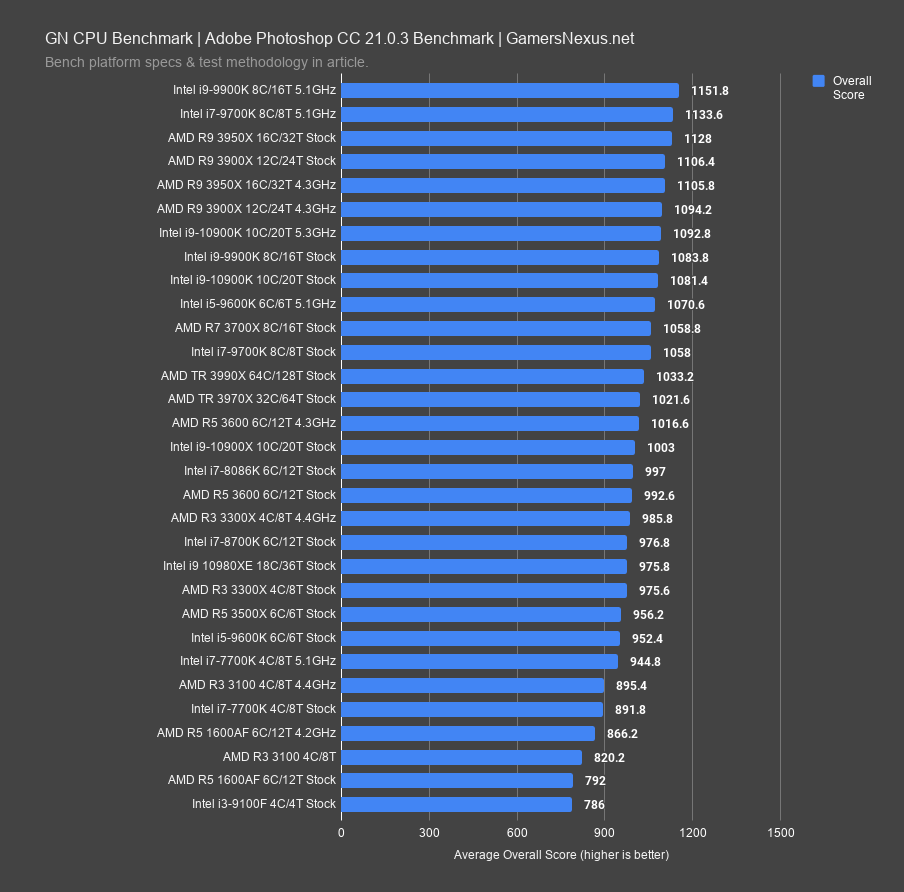
Photoshop is next. This test tends to favor Intel still, despite Premiere’s multi-threaded improvements. Photoshop likes higher frequency processors and benefits directly, as is always easy to illustrate with the lack of difference between the 9900K and 9700K at 5.1GHz. In this instance, the stock 10900K is functionally equivalent to the stock 9900K. Their scores are within run-to-run variance and error. The overclock gets us a bit higher, but not near the 9900K OC. This doesn’t make much logical sense, but it does match other issues we had constantly during reviewing this CPU: It’s all over the place, sometimes in unpredictable ways, and we retested the 10900K at least 2-3 additional times for every single benchmark. We do a minimum of 4 iterations for some of these tests, so that’s a lot of retests. We suspect BIOS is problematic or immature in these early stages, and suspect that performance may improve with time. Certainly out of box, the 10900K isn’t as stable or consistent as the 9900K’s nearly identical run-to-run performance. It’s behind in Photoshop for now.
7-Zip
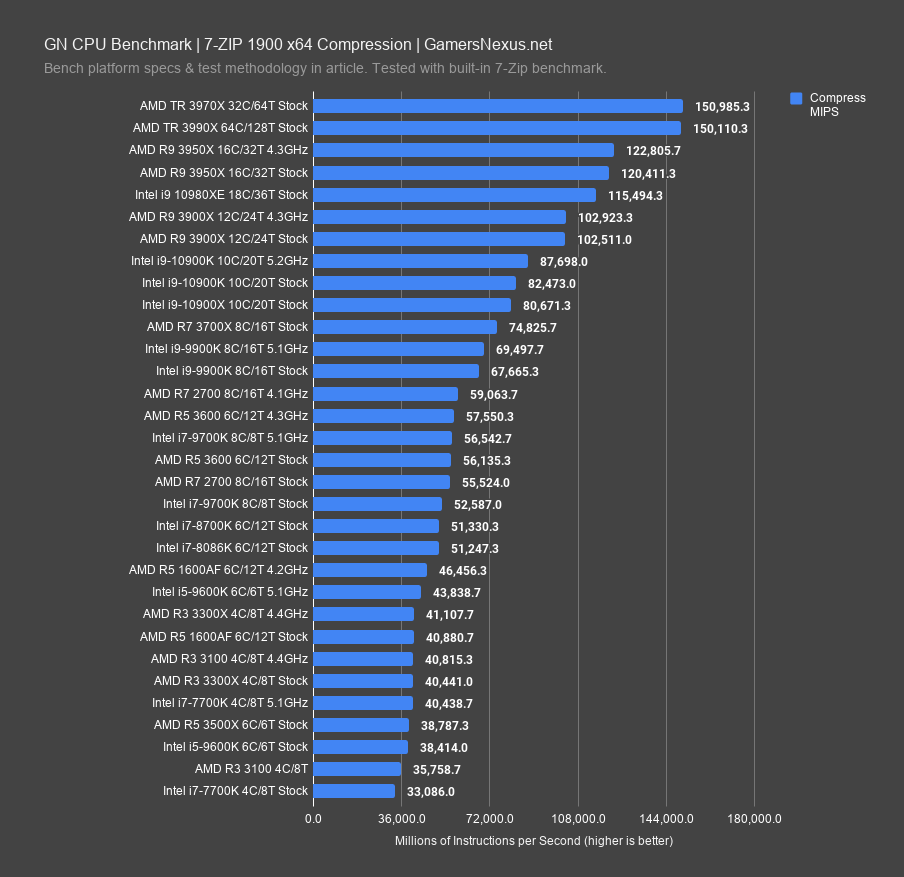
7-Zip compression and decompression are next. This is measured in MIPS, or millions of instructions per second.
The 10900K under stock settings runs 82K MIPS, with overclocking granting a direct 6.3% improvement to 87K MIPS. The 10900X runs a bit behind at 80K MIPS. The 10900K stock improves over the 9900K stock by 21.9%. As for the 3900X stock CPU, there’s a 24% performance advantage versus the 10900K stock CPU. The 3900X OC doesn’t move the bar, but OC-to-OC, the 3900X still leads the 5.2GHz 10900K by 17%.
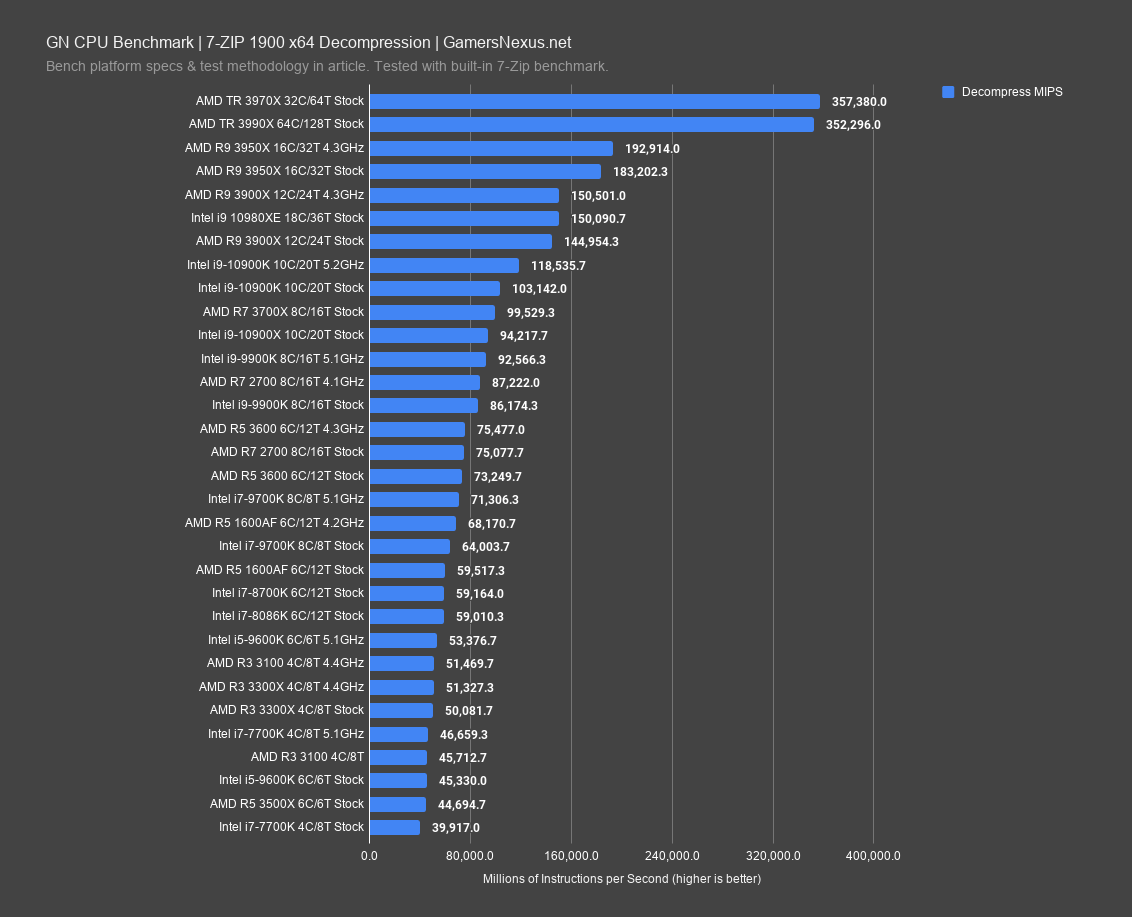
Decompression is next. The Threadripper CPUs are still blowing-out the scale and the 3990X remains limited by bandwidth. As for the relevant CPUs for today, the 10900K stock result runs 103K MIPS, so the overclock jumps by 15%. That’s a noteworthy improvement for an OC on a process this refined. The 10900X gets dragged behind at 94K MIPS, just behind the 3700X CPU, and the 3900X leads the 10900K stock-to-stock by 40%. AMD is far ahead at the same price here, so if you’re doing a lot of decompression and compression and not as much high-FPS gaming, it’s probably best to go AMD for this kind of workload.
Chromium
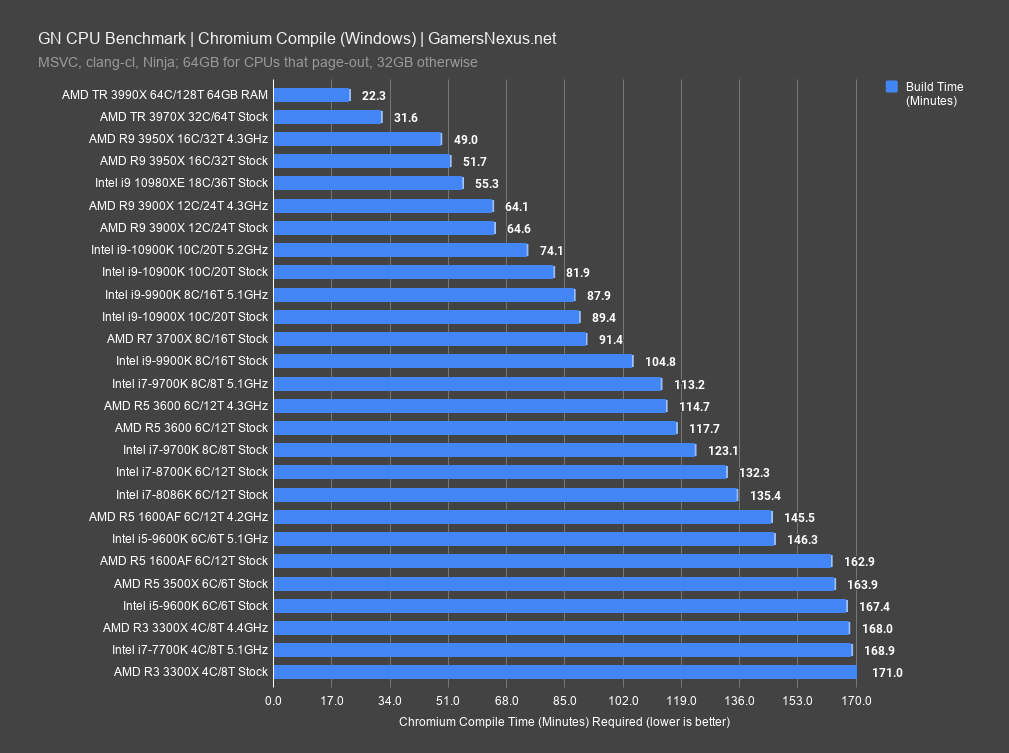
Chromium code compile with clang-cl and Ninja is next. This is measured in minutes to complete the full code compile, so like the rendering benchmarks, lower is better. For this one, tested on Windows, the 10900K stock CPU completes the compile in 82 minutes, a bit faster than the 5.1GHz 9900K result, and 22% faster than the stock 9900K at 105 minutes. Overclocking the 10900K reduces time required by 9.5%, although the stock 3900X still leads both sets of results at 65 minutes required. That’s 21% less time to compile than the 10900K stock CPU, with a multiplier-only overclock on the 3900X providing no value. The 3900X has a strong lead.
Handbrake
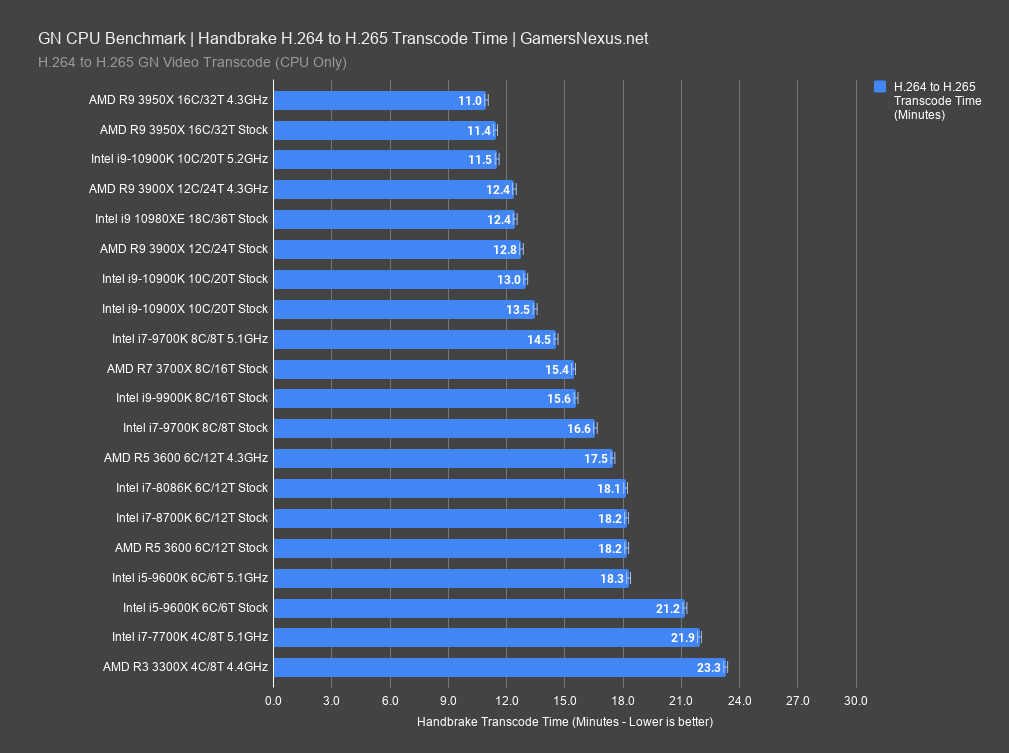
Handbrake is next, where we’re doing a video transcode to H.265. This is measured in minutes again. There are some issues with Handbrake and multithreading on high core-count CPUs that we may revisit later. Some optimization can be done in our benchmark approach for this one, but this is a relatively unmodified test for the transcode. Options in the future might include spawning multiple instances for Threadripper CPUs.
For now, the 10900K stock CPU completes the transcode in 13 minutes, improved over the stock 9900K by 17% time reduced. The 10900X is comparable to the 10900K this time, with the 10900K OC pushing up to 11.5 minutes, a reduction of 12% versus stock. As for the 3900X, that one finishes in 12.8 minutes, marking it as functionally equivalent to the 10900K. The overclocks give the 10900K an advantage of 7% time reduced.
V-Ray
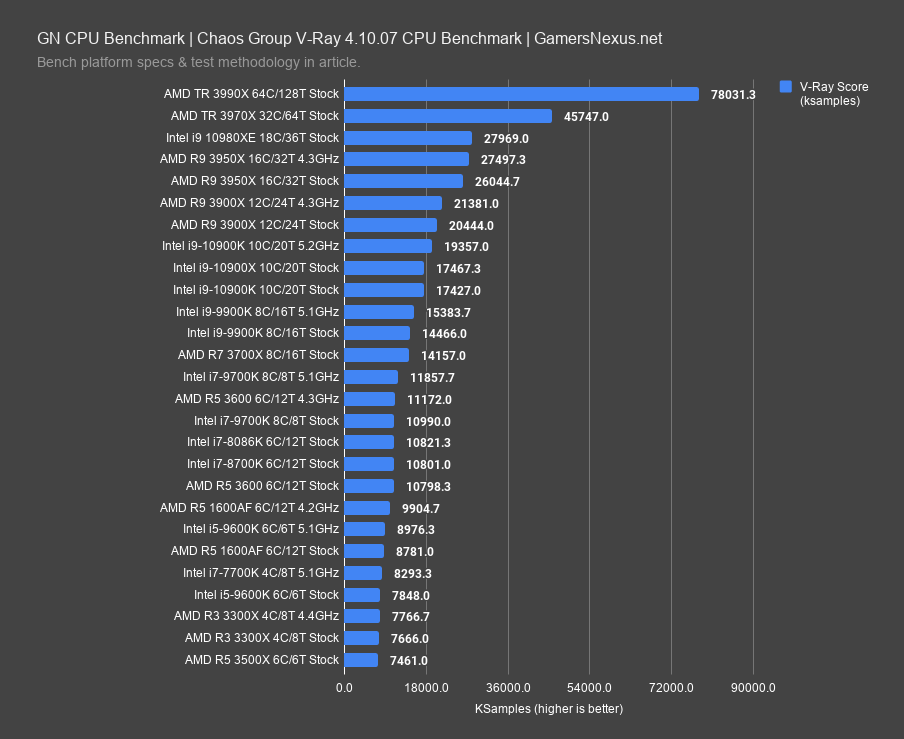
V-Ray will be kept brief. This is another rendering application and is comparable to Blender, but is now measured in ksamples, so higher is better. The 3990X blows out the scale, giving a sense of maximum performance. The 10900K stock CPU plots 17K ksamples, functionally equivalent with the 10900X. There might be some benefit to the bandwidth here. The 10900K OC nearly matches the stock 3900X, at 19K to 20K points. Stock-to-stock, the 3900X has an advantage of 17%.
Power Testing
Power testing is up next. For this, we measure at the EPS12V cables rather than the wall, so our measurement is closer to the actual CPU power consumption. We do not account for VRM efficiency losses, but we use high-end boards for all our tests, so these are relatively minor.
Power - Blender
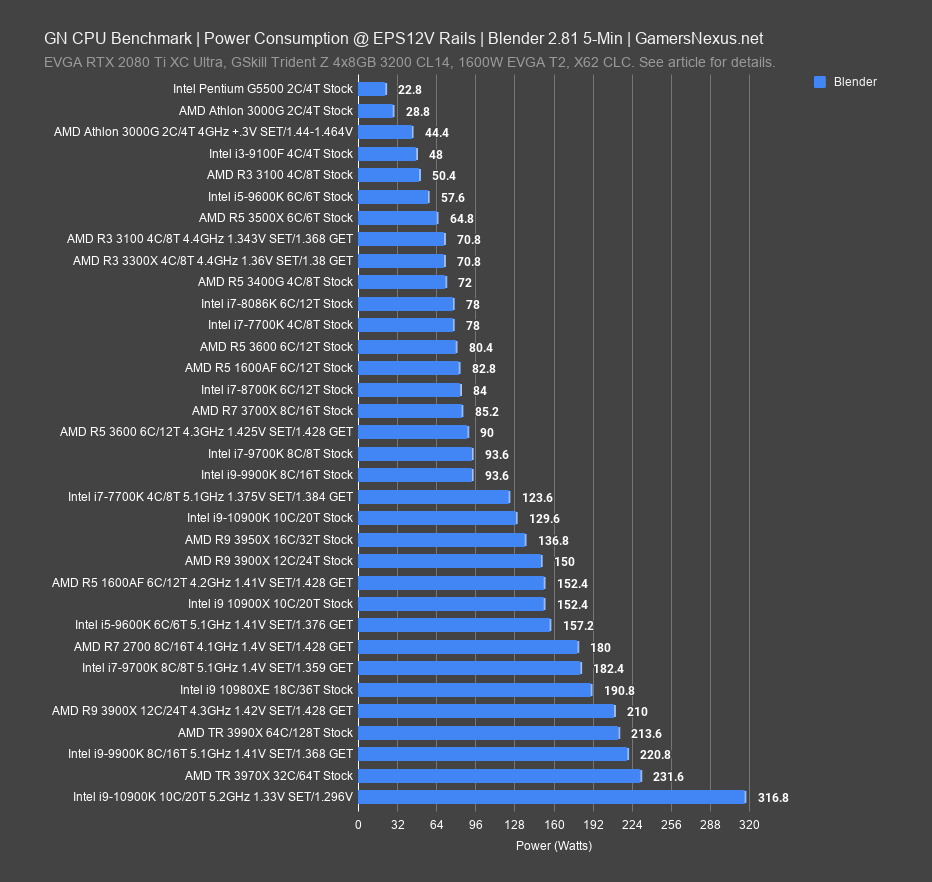
Our Blender all-core workload is up first. For this, we run the test for 5 minutes to ensure that Tau has expired on any CPUs with boosting durations. This brings the power consumption lower as compared to a shorter workload. Neither is correct or incorrect, it’s just that the power is higher within Tau and lower outside of it. Intel justifies this by referencing the soak time of the IHS. The 10900K stock CPU pulls about 130W in Blender here, whereas the 9900K stock CPU pulled about 94W. This is roughly equal to Intel’s TDP and can be thought of as 1-to-1 with actual power consumption if outside of Tau. The 3950X pulls similar power to the 10900K, while the 3900X pulls about 150W. In this regard, Intel is running below AMD’s power consumption, and so has an efficiency advantage. Note that the 3950X draws less than the 3900X partially due to silicon quality and voltage required to sustain the clocks. Overclocking the 10900K pushes it to 317W with our 1.3V GET needed to hold 5.2GHz all-core. That’s a lot of heat. We were close to the limit of our X62 for this.
Power - CB R20 NT
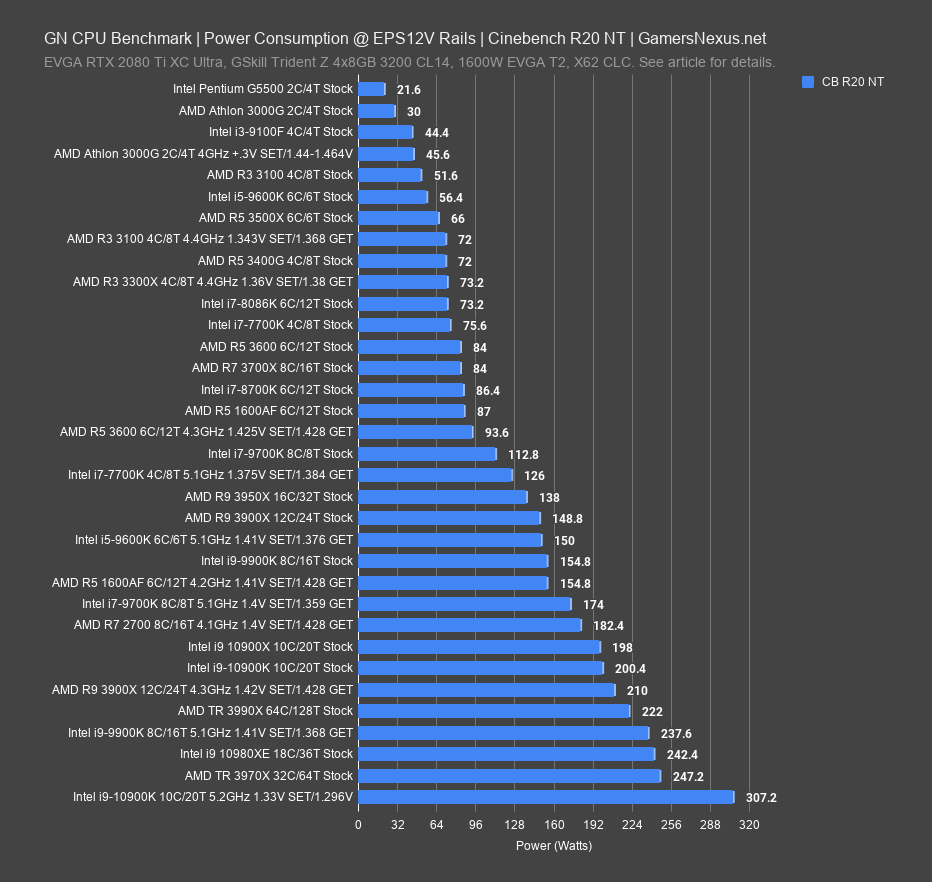
A shorter power load is measured in the early stages of Cinebench R20 multi-threaded. It’d be the same at the beginning of a Blender run or similar AVX load within Tau. The 10900K pulls about 200W here, while the 3900X pulls about 150W during this window. If the load is under 56 seconds long, the 10900K will boost higher temporarily and will require more power than the 3900X, and an extra 70W is a big jump. The 9900K stock pulled 155W in this short-term test.
Conclusion
The Intel Core i9-10900K CPU is a drop-in replacement for the 9900K, and it shows: Anywhere we previously recommended the 9900K -- primarily gaming -- we could recommend the 10900K. Our biggest issue has been BIOS and the fact that these Z490 platforms feel equivalent to early Ryzen 1000 platforms. They’re buggy, applying settings doesn’t always work like it should, and the boosting behavior is inconsistent from one to the next. That needs to be fixed.
The 10900K also begins to get us into the philosophical debate of how much CPU differences matter for gaming when at its level of performance, but we’ll talk about that more in the 10600K review getting published later today (likely to our YouTube channel first).
Oddly, AMD has the more mature platform right now, despite Z490 being a direct Z390 reskin + WiFi in the chipset. The 3900X would be our go-to for production or rendering boxes. It’s cheaper and it’s more effective. The 10900K is objectively the ‘best’ in gaming benchmarks, and it also has phenomenal room to play around with overclocking (that we still need to explore), so there’s an enthusiast chip here for people who enjoy the OC tinkering scene. As far as gaming-only builds, $500 is a lot to ask, so check back for the 10600K review. If you’re in the pure “FPS snob” category of gaming, the 10900K is the winning choice. For most people, other cheaper options are getting similarly close. For the production classification of users, check the 3900X.
Editorial, Test Lead: Steve Burke
Testing: Patrick Lathan
Video: Keegan Gallick, Andrew Coleman