Benchmarking Mass Effect: Andromeda immediately revealed a few considerations for our finalized testing. Frametimes, for instance, were markedly lower on the first test pass. The game also prides itself in casting players into a variety of environs, including ship interiors, planet surfaces of varying geometric complexity (generally simpler), and space stations with high poly density. Given all these gameplay options, we prefaced our final benchmarking with an extensive study period to research the game’s performance in various areas, then determine which area best represented the whole experience.
Our Mass Effect: Andromeda benchmark starts with definitions of settings (like framebuffer format), then goes through research, then the final benchmarks at 4K, 1440p, and 1080p.
Mass Effect: Andromeda Framebuffer Format
Framebuffer Format: We reached out for additional help in understanding this particular display option. The below is a word-for-word response on what Half16 & compressed mean:
“Half16 doubles the size of all color buffers in the rendering pipeline, needs more bandwidth during rendering. Half16 doubles the precision of their intermediate color buffers. It’s not going to make a difference on standard displays. And there’s a perf hit with Half16, so not really a good choice for 99% [of users].
“The compressed mode only keeps 5-6 bits of precision per color channel. The reason it doesn’t have the artifacts of good old 16-bit color is that the rest of the 32 bits is used on range. Even on regular SDR monitors, it is possible to see banding in places with that format. With lots of bending or really fine gradients in a bright sky, there might be issues. Most of the time, you’ll be fine. HDR stretches the range and precision, so you’ll be more likely to find places where it matters.”
Given this information, and the noteworthy performance hit for negligible visulal improvement on standard displays, we opted for Compressed for our benchmarking. We’d recommend that most users do the same.
Andromeda Pre-Test Research: First Pass is Much Worse for AMD
| Fury X Test Passes - 4K/Ultra | |||
| AVG FPS | 1% LOW | 0.1% LOW | |
| Pass 1 | 31 | 25 | 5 |
| Pass 2 | 32 | 26 | 25 |
| Pass 3 | 32 | 26 | 25 |
| Pass 4 | 32 | 26 | 25 |
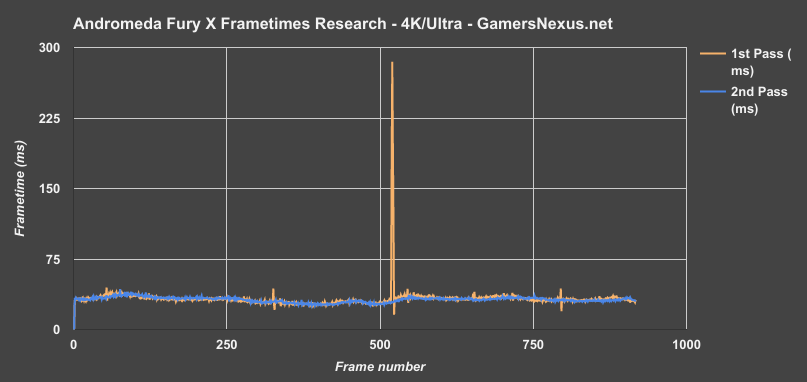
The above is a set of several test passes with an R9 Fury X at 4K and Ultra settings. The important thing here is the disparity in frametimes. This is repeatable and seems to happen consistently on first load of a level, but goes away after exploring the immediate area. We’re seeing massive, noticeable stutters in the first pass, but significantly improved performance in subsequent passes (although this particular framerate isn’t desirable, it’s the same across multiple devices and resolutions). The most exaggerated spike is a 280ms frametime at one point.
To further illustrate, here’s a set of data from the RX 480 8GB Gaming X at 1080p/Ultra:
| RX 480 Test Passes - 1080p/Ultra | |||
| AVG FPS | 1% LOW | 0.1% LOW | |
| Pass 1 | 72 | 56 | 6 |
| Pass 2 | 74 | 57 | 53 |
| Pass 3 | 75 | 60 | 55 |
| Pass 4 | 75 | 59 | 56 |
| Pass 5 | 74 | 59 | 54 |
In this one, our first test pass shows 72FPS AVG, with 56FPS 1% low and 6FPS 0.1% low. This shows itself in stutters during the first pass, but smooths out in subsequent passes. We improve from roughly 6FPS 0.1% lowest performance to 53FPS in the second pass.
| GTX 1060 Test Passes - 1080p/Ultra | |||
| AVG FPS | 1% LOW | 0.1% LOW | |
| Pass 1 | 88 | 66 | 60 |
| Pass 2 | 92 | 70 | 65 |
| Pass 3 | 90 | 69 | 65 |
| Pass 4 | 91 | 70 | 65 |
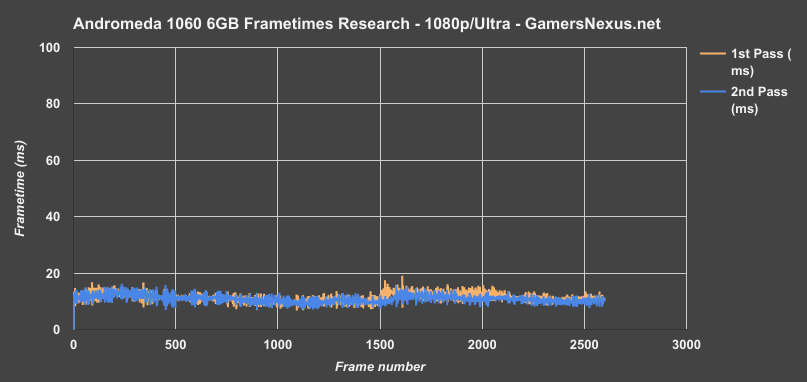
To contrast versus nVidia, the GTX 1060 6GB Gaming X at 1080p/Ultra posts a 60FPS 0.1% low output for the first pass, then 65FPS for later passes. The difference here isn’t visible, though is consistent and measurable.
Putting it into perspective, here are two passes on the RX 480 vs. GTX 1060 passes:
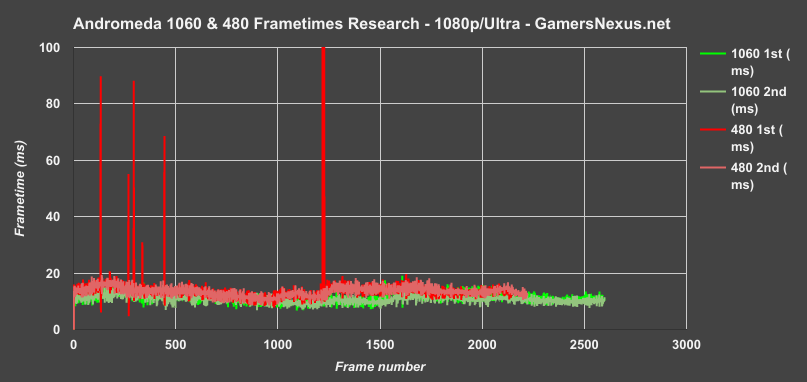
And we want to be very clear here that we’re not saying AMD is “bad” or is worse overall, just that this data is important to keep in mind for testing. We’re assuming some sort of driver-level or game-level optimization issue here, given frametime performance is actually good after initial passes (even on AMD hardware – timings are fairly tight across the spectrum). Because of this issue, we have elected to run four test passes per resolution with each card, then eliminate the first test pass from all data sets. Failure to do so would drag AMD devices down in averages in a way which is not necessarily reflected beyond immediate exploration of a level. The best solution is to publish some test data, as above, then run averages that exclude the outlier first pass. You now have a complete understanding of how the cards behave.
This brings up the averages to be more fairly represented for AMD, but keep in mind that you may notice some initial stuttering on AMD hardware that isn’t reflected in our final results.
Mass Effect: Andromeda – Planet-side vs. Tempest vs. Nexus
As for other research, we ran several minute test passes on the first planet, on the Tempest ship, and in the Nexus. Overall, performance numbers suggest that planet-side driving is the highest performance – no surprise, as it is the least geometrically complex – while planet-side battles tend to mostly equal the average framerate on the Tempest or Nexus. The Tempest ship has a consistently low frame throughput, but overall, all test environments are roughly equal when averaging the framerate out over a period of several minute tests per area.
This also supports our shorter test passes, which are a necessity for testing as many devices as we do (and are detailed in our testing methodology section). Our test durations are not chosen blindly – we do this research to determine what’s the best fit for the test area.
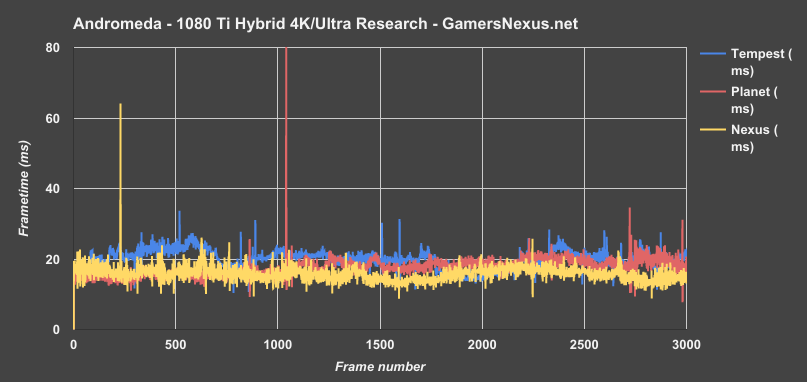
Clearly, from the above chart, there are parts of the Tempest ship that present worse overall framerates than planet-side or Nexus exploration. That said, these sections are limited, and you’re ultimately not spending a lot of time on the ship. With Tempest as the worst case scenario and planet-side driving as the best case scenario, we’re left to find the middle-ground. In this case, that’s planet-side combat and the Nexus, both of which happen to be roughly equal to one another.
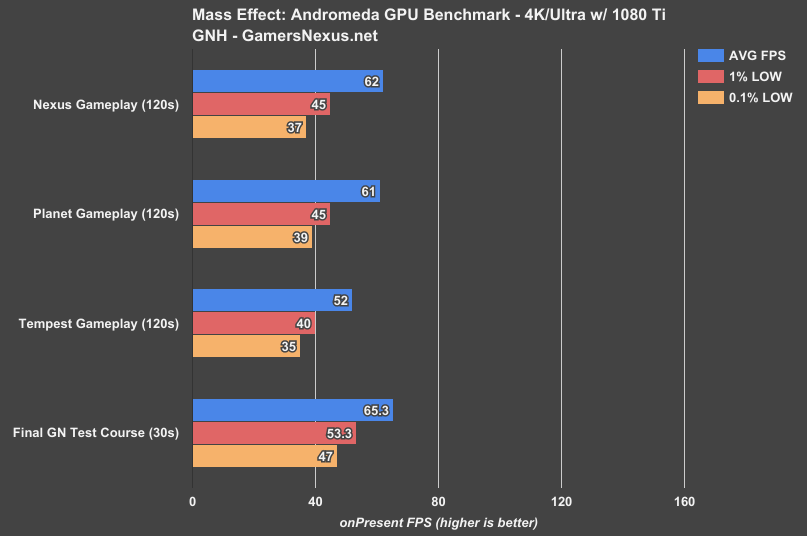
The above is what we ended up with. We’re not as bad off as Tempest, but we’re reasonably close to performance everywhere else in the game. This also reveals that our 30s test pass is more than sufficient for benchmarking and yielding performance metrics in an efficient, yet practiced and researched manner. We eliminate variance issues entirely, improve efficiency (number of devices on bench), and still get results that are pretty damn close to actual game performance.
Just know that shorter test passes conducted in planet-side driving will be much higher performance than the Tempest ship, Nexus, or other indoor environments. Because of this, we made the decision to test on Nexus; the Nexus seems to be the most representative of overall averaged performance when considering lower framerate battles, higher framerate desert driving, and mixed framerate ship or station traversal.
Test Methodology
Mass Effect: Andromeda GPU benchmarking was conducted using drivers 378.92 for nVidia and 17.3.3 for AMD. Both include patch notes explicitly declaring Andromeda optimization.
Testing was conducted on Mission 2: Nexus, where we navigated through a busy station with heavily populated corridors (by other NPCs and by objects). See above for more depth on pre-benchmark research.
Game Bench
| GN Test Bench 2017 | Name | Courtesy Of | Cost |
| Video Card | This is what we're testing | - | - |
| CPU | Intel i7-7700K 4.5GHz locked | GamersNexus | $330 |
| Memory | GSkill Trident Z 3200MHz C14 | Gskill | - |
| Motherboard | Gigabyte Aorus Gaming 7 Z270X | Gigabyte | $240 |
| Power Supply | NZXT 1200W HALE90 V2 | NZXT | $300 |
| SSD | Plextor M7V Crucial 1TB | GamersNexus | - |
| Case | Top Deck Tech Station | GamersNexus | $250 |
| CPU Cooler | Asetek 570LC | Asetek | - |
BIOS settings include C-states completely disabled with the CPU locked to 4.5GHz at 1.32 vCore. Memory is at XMP1.
Video Cards Tested
- NVIDIA GTX 1080 Ti FE (with GN Hybrid mod)
- EVGA GTX 1080 FTW2
- EVGA GTX 980 Ti Hybrid
- EVGA GTX 1070 SC
- MSI GTX 1060 6GB Gaming X
- EVGA GTX 970 SSC
- NVidia GTX 780 Ti Reference
- MSI GTX 1050 OC 2GB
- AMD R9 Fury X
- MSI RX 480 8GB Gaming X
- MSI R9 390X 8GB Gaming
- AMD R9 290X 4GB Reference
- Sapphire RX 470 Platinum 4GB
- Gigabyte RX 460 2GB
Mass Effect: Andromeda 4K Benchmark: 1080 Ti vs. GTX 1080, 1070, Fury X
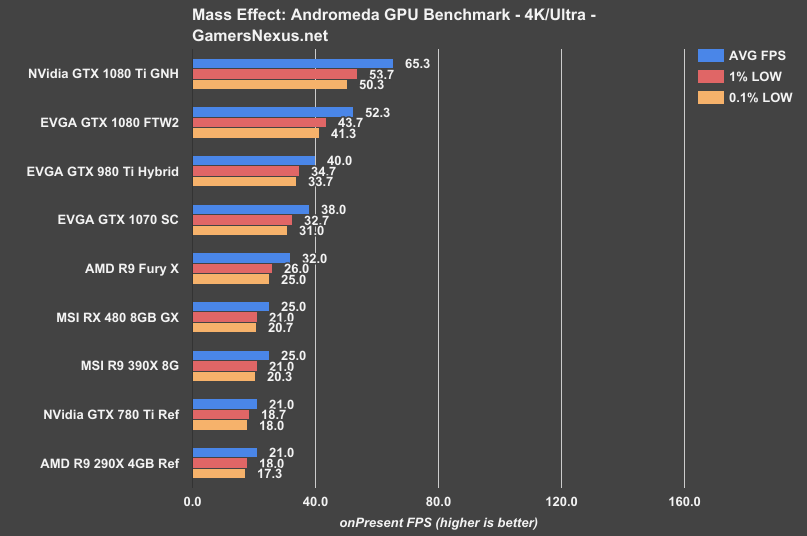
At 4K/ultra in the Nexus benchmark, our 1080 Ti Hybrid we built (using this Hybrid kit) is performing at around 65FPS AVG, with 1% lows at 54FPS and 0.1% lows at 50FPS. Moving down the list, the GTX 1080 FTW2 ($590) runs about 20% slower than the 1080 Ti at 52FPS AVG, with lows about 10FPS below the 1080 Ti’s 1% and 0.1% values. This is still plenty playable even at ultra, as we generally found that Mass Effect: Andromeda feels fluid enough for play around the 50FPS range. Your mileage may vary, depending on how picky you are, but that’s what we thought. There’s not a hugely noticeable difference at 60FPS vs. 50FPS.
The GTX 980 Ti Hybrid from the Maxwell generation runs about 39% slower than the Pascal 1080 Ti, placing at 40FPS average, with lows just above 30FPS. We can find AMD’s R9 Fury X at 32FPS AVG, with lows in the 20s. At this point, alongside the GTX 1070 at 38FPS, we are beginning to experience more frequent and observable stutters and tears. The experience is poor enough on the Fury X, 1070, and potentially 980 Ti that we’d recommend dropping to ‘medium’ settings. There’s really not much of a benefit by going to ‘high,’ as it turns out, so it’s Ultra, Medium, or bust on 4K.
For what it’s worth, the MSI RX 480 Gaming X 8GB card hangs on pretty closely to the Fury X at 25FPS AVG, tying the 390X and outpacing both the former flagships from both AMD and nVidia: The R9 290X and GTX 780 Ti.
Mass Effect: Andromeda 1440p Bench: GTX 1080 vs. 1070, 1060, RX 480, 390X
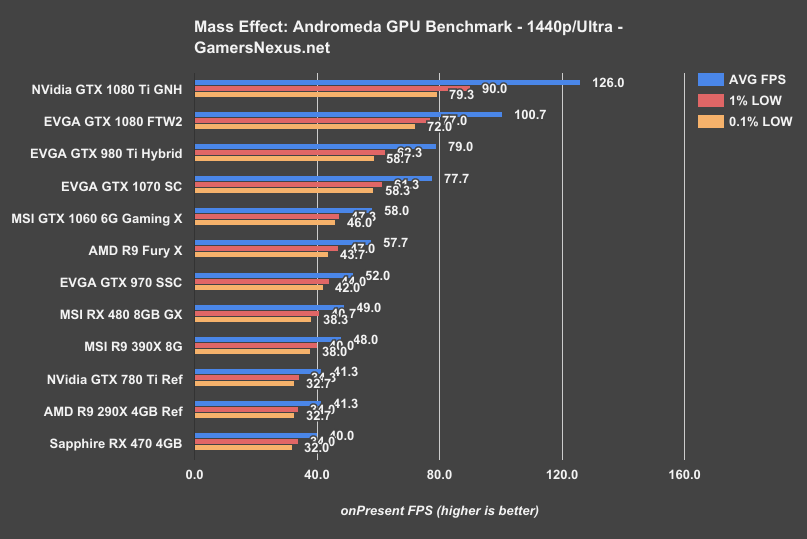
Moving to 1440p/ultra with the same Nexus workload, the GTX 1080 Ti GN Hybrid operates about 2x its framerate at 4K, now pushing about 126FPS AVG with lows at 90FPS 1% and 79FPS 0.1%. The 1080 FTW2 trails at 101FPS AVG, making the 1080 Ti roughly 25% faster at this resolution. Not quite nVidia’s 35% claim, though the gap between the 980 Ti and the 1080 Ti is a noteworthy 60% improvement from the Pascal Ti.
The GTX 1060 Gaming X 6GB now appears on this chart as well, placing at around 58FPS AVG, with lows at 47 and 46FPS. AMD’s R9 Fury X has nearly identical performance across the board at 58FPS AVG, 47FPS 1% low, and 44FPS 0.1% lows. Both the AMD Fury X and nVidia GTX 1060 output frames with fairly even frame pacing, which is somewhat remarkable for a newly launched title.
The EVGA GTX 970 SSC runs about 10% slower than the GTX 1060, but is still playable with Ultra settings. This is followed closely by the RX 480 which, in the current state of this game, seems to perform around where the GTX 970 and R9 390X perform. Interestingly, we see both former flagships continue to exhibit their weakness in higher resolutions, with the GTX 780 Ti and R9 290X falling below the modern RX 480 and GTX 1060 in framerate at 1440p. These two cards perform more closely to an RX 470 4GB card. Dropping any of the three tailing devices to ‘medium’ settings would push you to 50FPS, if you preferred 1440p to higher settings.
Andromeda 1080p Benchmark: GTX 980 Ti, 970, R9 390X, 290X, 780 Ti
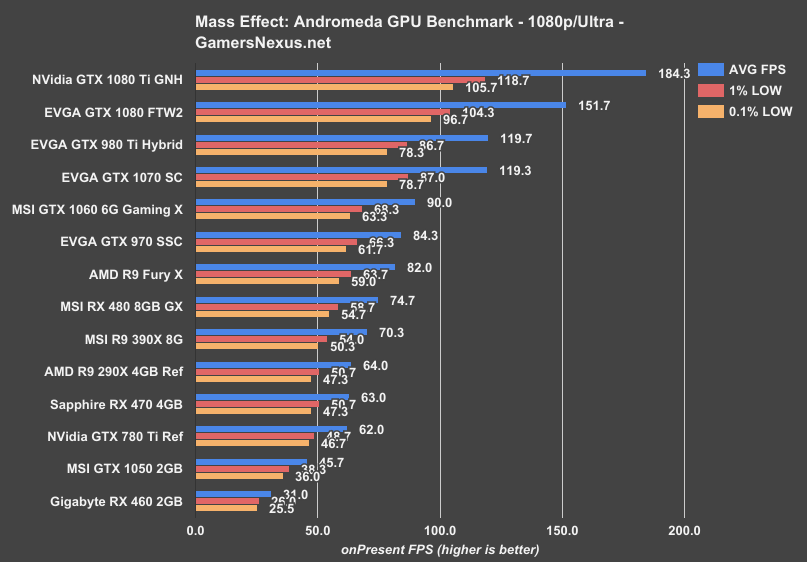
Moving now to the most widespread resolution, 1080p posts the GTX 1080 Ti nearing 200FPS AVG, the 980 Ti at 120FPS AVG, and the GTX 1070 tied with the 980 Ti. Everything here – even the worst performing devices – has tightly timed frame pacing, making for a generally smooth experience if above roughly 50FPS average.
The GTX 780 Ti and R9 290X do a lot better here, thanks to the lowered pixel throughput, with the R9 290X landing a few frames ahead of the GTX 780 Ti. That said, NVidia holds the top half of the chart until AMD pushes its highly-anticipated Vega GPU of the same-named architecture, with the highest-performing AMD card being the Fury X at 82FPS AVG. This is trailed about 8% by the RX 480 Gaming X, which is then trailed closely by the R9 390X.
As for low-end cards, the GTX 1050 does reasonably here, though dropping to medium settings would be ideal. The 1050 Ti would do fine, though we didn’t test it due to the usual time and activation restrictions. The RX 460 2GB card struggles, and definitely needs a settings reduction for better playability.
Conclusion: Best Graphics Cards for Mass Effect Andromeda
For 1080p with Ultra settings, it seems that Andromeda runs well on the GTX 1050 Ti (do some extrapolation) and up or RX 470 and up, with the 470 offering 60FPS framerates at the bottom-end. The GTX 1060 6GB card pushes nearing 100FPS, and is capable to some extent of 1440p playability. The same is true for the Fury X hanger-on. As for 4K, it’s looking like 1080-class hardware or better is necessary to sustain high framerates with Ultra settings, though medium settings would allow other cards in that listing.
As an aside, we noticed that the difference between ‘High’ and ‘Ultra is never more than a few percentage points – we’re talking single-digit frames – so it’s mostly an option of ‘ultra’ versus ‘medium’ for this particular title.
Editorial, Test Lead: Steve Burke
Video: Andrew Coleman