UPDATE: We have run benchmarks of the launch version of Destiny 2. Please view the launch Destiny 2 GPU benchmarks here.
The Destiny 2 beta’s arrival on PC provides a new benchmarking opportunity for GPUs and CPUs, and will allow us to plot performance uplift once the final game ships. Aside from being a popular beta, we also want to know if Bungie, AMD, and nVidia work to further improve performance in the final stretch of time prior to the official October 24 launch date. For now, we’re conducting an exploratory benchmark of multiplayer versus campaign test patterns for Destiny 2, quality settings, and multiple resolutions.
A few notes before beginning: This is beta, first off, and everything is subject to change. We’re ultimately testing this as it pertains to the beta, but using that experience to learn more about how Destiny 2 behaves so that we’re not surprised on its release. Some of this testing is to learn about settings impact to performance (including some unique behavior between “High” and “Highest”), multiplayer vs. campaign performance, and level performance. Note also that drivers will iterate and, although nVidia and AMD both recommended their respective drivers for this test (385.41, 17.8.2), likely change for final release. AMD in particular is in need of a more Destiny-specific driver, based on our testing, so keep in mind that performance metrics are in flux for the final launch.
Note also: Our Destiny 2 CPU benchmark will be up not long after this content piece. Keep an eye out for that one.
Test Platform
| GN Test Bench 2017 | Name | Courtesy Of | Cost |
| Video Card | This is what we're testing | - | - |
| CPU | Intel i7-7700K 4.5GHz locked | GamersNexus | $330 |
| Memory | Corsair Vengeance LPX 3200MHz | Corsair | - |
| Motherboard | Gigabyte Aorus Gaming 7 Z270X | Gigabyte | $240 |
| Power Supply | NZXT 1200W HALE90 V2 | NZXT | $300 |
| SSD | Plextor M7V Crucial 1TB | GamersNexus | - |
| Case | Top Deck Tech Station | GamersNexus | $250 |
| CPU Cooler | Asetek 570LC | Asetek | - |
BIOS settings include C-states completely disabled with the CPU locked to 4.5GHz at 1.32 vCore. Memory is at XMP1.
Starting straight away with research: The big question is how well competitive multiplayer is reflected in the campaign intro mission, and whether “singleplayer” performance reflects multiplayer performance. There’s another big question of how different areas of the game respond, as it’s common for maps to exhibit varying performance.
Campaign Performance
Testing during the campaign, we took spot measurements throughout the entire tutorial play session over a period of about 20 minutes, with a couple of other measurements that ran for 5 minutes per logging period. This was with a 1080 Ti SC2 at 4K and Highest settings. We’ll look at comparative benchmarks momentarily, but we first want to define what works for a benchmark.
GTX 1080 Ti SC2, 4K, HighestFirst 20 Minutes of Campaign | |||
| AVG FPS | 1% LOW | 0.1% LOW | |
| Spot-Check #1 | 51.0 | 45.0 | 44.0 |
| Spot-Check #2 | 52.0 | 46.0 | 40.0 |
| Spot-Check #3 | 53.0 | 48.0 | 46.0 |
| Spot-Check #4 | 53.0 | 47.0 | 43.0 |
| Spot-Check #5 | 51.0 | 44.0 | 39.0 |
| Spot-Check #6 | 55.0 | 48.0 | 43.0 |
| Spot-Check #7 | 51.0 | 46.0 | 39.0 |
| Spot-Check #8 | 51.0 | 47.0 | 44.0 |
| Spot-Check #9 | 44.0 | 39.0 | 33.0 |
| Spot-Check #10 | 51.0 | 42.0 | 42.0 |
| 5-Minute Campaign Intro | 58.0 | 49.0 | 45.0 |
| Final Bench Scene | 55.0 | 48.0 | 47.5 |
| Standard Deviation | 3.4 | 2.9 | 3.9 |
This table shows each spot measurement against one another, then against the final benchmarking course: Overall, our FPS range is consistent. There is one lower FPS number out of all of these, cropping-up in a densely packed city street with complex geometry. We only saw this FPS dip one time during the campaign, and it seemed tied to that specific zone. Averaging the spot checks across the entire 20-minute session, we end up at 51FPS AVG, 45FPS 1% lows, and 41FPS 0.1% lows. Comparatively, our chosen benchmark course – selected for its accurate repetition – ended up at 55FPS AVG, 48FPS 1% lows, and 47.5FPS 0.1% lows. These numbers are remarkably close and show that, in the very least, our benchmarking method is representative of the entirety of the beta intro campaign.
Let’s look at how this compares to competitive multiplayer matches.
GTX 1080 Ti SC2, 4K, HighestMultiple Competitive Matches | |||
| AVG FPS | 1% LOW | 0.1% LOW | |
| Match #1, Spot-Check #1 | 53.0 | 45.0 | 43.0 |
| Match #1, Spot-Check #2 | 53.0 | 42.0 | 40.0 |
| Match #2, Spot-Check #1 | 57.0 | 50.0 | 41.0 |
| Match #2, Spot-Check #2 | 55.0 | 48.0 | 46.0 |
| Final Bench Scene | 55.0 | 48.0 | 47.5 |
| Standard Deviation | 1.7 | 3.1 | 3.2 |
Taking spot measurements across several multiplayer sessions on the Midtown map, we end up with this new table of results. The range is 53 to 57FPS AVG, and averaging all the spot checks puts us at 54.5FPS, with 1% lows at 46FPS, and 43FPS 0.1% lows. These are close enough that campaign benchmarking looks accurate to multiplayer performance in the beta state of the game.
To get a broader sense of scalability across the game’s various maps and game modes, here’s an MSI GTX 1050 Ti at 1080p and High settings:
Destiny 2 Benchmark Research: MSI GTX 1050 Ti
GTX 1050 Ti "OC," 1080p, HighMultiple Competitive Matches | |||
| AVG FPS | 1% LOW | 0.1% LOW | |
| Match #1, Spot-Check #1 | 79.0 | 67.0 | 62.0 |
| Match #1, Spot-Check #2 | 73.0 | 60.0 | 59.0 |
| Match #2, Spot-Check #1 | 74.0 | 59.0 | 57.0 |
| Match #2, Spot-Check #2 | 66.0 | 62.0 | 62.0 |
| Match #3, Spot-Check #1 | 79.0 | 71.0 | 58.0 |
| Final Bench Scene | 69.8 | 54.5 | 53.5 |
| Standard Deviation | 5.1 | 5.9 | 3.2 |
GTX 1050 Ti "OC," 1080p, HighFinal Bench Run (Campaign) | |||
| AVG FPS | 1% LOW | 0.1% LOW | |
| Pass #1 | 71.0 | 55.0 | 54.0 |
| Pass #2 | 69.0 | 55.0 | 54.0 |
| Pass #3 | 70.0 | 54.0 | 53.0 |
| Pass #4 | 69.0 | 54.0 | 53.0 |
| Final Bench AVG | 69.8 | 54.5 | 53.5 |
| Standard Deviation | 1.0 | 0.6 | 0.6 |
Our benchmark course outputs a framerate of 70FPS AVG, with lows at 54.7FPS 1% and 53.7FPS 0.1%. Compared to a pair of multiplayer matches on Midtown, we see framerates of 74FPS AVG, 63FPS 1%, and 59FPS 0.1%. The difference is approximately 6% -- considering the tradeoff is significantly more reproducible results, that’s really not too bad. You’d see a bigger range of variance in a game like Battlefield (with 64 players), although it’s possible that Destiny 2’s final iteration could show greater swings across other maps and game modes. We’ll have to reserve judgment on that until it fully ships.
Destiny 2 Benchmark Research: MSI RX 580 8GB
MSI RX 580 8GB, 1080p, HighestMultiple Competitive Matches | |||
| AVG FPS | 1% LOW | 0.1% LOW | |
| Match #1, Spot-Check #1 | 77.0 | 66.0 | 62.0 |
| Match #1, Spot-Check #2 | 67.0 | 62.0 | 58.0 |
| Match #2, Spot-Check #1 | 77.0 | 66.0 | 61.0 |
| Match #2, Spot-Check #2 | 88.0 | 68.0 | 63.0 |
| Match #3, Spot-Check #1 | 84.0 | 72.0 | 67.0 |
| Match #3, Spot-Check #2 | 79.0 | 66.0 | 63.0 |
| Match #4, Spot-Check #1 | 83.0 | 68.0 | 63.0 |
| Match #4, Spot-Check #2 | 75.0 | 63.0 | 60.0 |
| Final Bench Scene | 85.0 | 66.3 | 62.3 |
| Standard Deviation | 6.4 | 2.9 | 2.5 |
MSI RX 580 8GB, 1080p, HighestFinal Bench Run (Campaign) | |||
| AVG FPS | 1% LOW | 0.1% LOW | |
| Pass #1 | 86.0 | 67.0 | 63.0 |
| Pass #2 | 84.0 | 66.0 | 62.0 |
| Pass #3 | 85.0 | 66.0 | 62.0 |
| Pass #4 | 84.0 | 66.0 | 63.0 |
| Final Bench Scene | 84.8 | 66.3 | 62.3 |
| Standard Deviation | 1.0 | 0.5 | 0.6 |
Here’s another round of exploratory tests on the MSI RX 580 8GB, which were conducted as we were finalizing its comparative results. We’ll get to those momentarily. At 1080p and with highest settings, our benchmark output had us at 85FPS AVG, 66FPS 1% lows, and 62FPS 0.1% lows. Multiplayer testing put our range between 67FPS and 88FPS – which largely demonstrates why multiplayer is a difficult test – and averages out to 79FPS AVG, 66FPS 1% lows, and 62FPS 0.1% lows. Still reasonably close, with the final benchmark output averaging a bit higher than multiplayer – though there’s so much range in multiplayer results that we’d have to run them a dozen more times to get a better idea of the average.
Now that we’ve gone through this, our ultimately chosen campaign benchmark is within the ballpark of multiplayer testing and is within range of multiplayer gameplay, yet significantly more consistent and repeatable. We’ll forge ahead with this testing method, knowing now the relative difference in multiplayer. The numbers will be within the ballpark of Midtown competitive matches, +/- a few percentage points.
Before the next section, note that there’s a 200FPS frame cap on Destiny 2 out-of-box, so framerates that could exceed 200 will be counted as 200, thus dragging down averages of devices toward the upper limit. This primarily applies to the GTX 1080 Ti.
As always, we can only speak to the results we discovered. Game testing is complex and leaves room for major performance changes when beginning to play around with other settings and maps, which is something we’ll continue to explore as the game matures.
Destiny 2 GPU Benchmark – Highest Graphics, 1080p

Getting into comparative benchmarks between the GPUs now, we open with 1080p at Highest settings and FXAA, bypassing MSAA (Bungie’s known issues log reports WIP status of MSAA).
The Destiny 2 beta proves playable on most hardware at 1080p, even with the Highest settings enabled. The 1080 Ti SC2 chart-tops here, unsurprisingly, with a 168FPS AVG and frametimes consistently represented in 123FPS 1% and 94FPS 0.1% metrics. We are bumping into the 200FPS ceiling. Vega 64 stock lands at 123FPS AVG, trailing the GTX 1080 by about 17% and effectively tying the GTX 1070 SC. Note again that AMD’s driver situation may yet mature for this game, so we can only speak to these results as of the beta. We’ll revisit closer to full launch. As of now, Vega 64 ties the 1070, and our Vega 56 Hybrid isn’t far behind, at about a 6% deficit to the V64 card. The MSI GTX 1060 6GB card operated a 93FPS AVG, planting it just ahead of the GTX 970 SSC and a fair bit behind the GTX 1070 and RX Vega 56. The many GTX 970 owners can rest assured knowing that their card is still plenty usable for highest settings at 1080p, which makes sense, as Bungie did officially recommend the card. The MSI RX 580 performs similarly to the GTX 970, which means that overclocked RX 480 owners can expect comparable results to the RX 580 in the Destiny 2 beta.
The RX 570 follows AMD’s trend of showing clock speeds can account for CU deficits, as the 570’s performance would pull close to the RX 580’s performance when overclocked. Finally, the GTX 1050 Ti and RX 560 cards would benefit from a mixture of High and Highest settings if at 1080p, as they begin to drag below the 60FPS threshold. That’s a subjective call, to some extent.
Destiny 2 GPU Benchmark – High Graphics, 1080p

Speaking of dropping settings, here’s 1080p with High settings. The RX 560 improves by about 10FPS, or 26%, and the MSI GTX 1050 Ti improves by 22%, climbing to 70FPS AVG. Remember, we’re roughly +/- 6% to multiplayer performance, so we’re in good company at this point.
Destiny 2 GPU Benchmark – Highest Graphics, 1440p

With 1440p resolution and the highest graphics settings and FXAA, the 1080 Ti is knocked down from its framerate cap-bumping numbers to 105FPS AVG, losing about 38% from the 1080p resolution. Things are still plenty playable, though, scaling reasonably through the GTX 1080 FTW at 82FPS and the Vega 64 at, conveniently, 64FPS. If illuminati aren’t yet confirmed, consider that the GTX 1080 Ti leads Vega 64 by… 64%. Confirmed.
Jokes aside, RX Vega 64 is roughly tied with the GTX 1070, but the Vega 64 card exhibits worse frametime consistency. This is at least partly a driver-side issue, seeing as the performance here deviates from Vega’s norm of being closer to 1080 performance. We’ll check back once AMD pushes another update, likely closer to launch.

Here’s a look at the frametime plot of Vega 64 and the GTX 1080 FTW, showing the 1080 FTW’s more consistent frametime output. Remember, with frametimes, it’s not just that higher is worse, but more variance is worse. You want the flattest line possible, ideally closest to the refresh interval of the display. Alternatively, here’s a Vega 56 frametime plot compared to the GTX 1070 frametime plot, showing a similar outcome:

Back to the 1440p Highest chart for a moment, though, we see that performance starts falling harder at the GTX 1060 6GB card, GTX 970, and RX 580 8GB. Players more sensitive to framerate may want to drop settings or resolution.
Destiny 2 GPU Benchmark – High Graphics, 1440p

Here’s a look at the dropped settings option, just to see how many more frames we can get out of going to High. There’s more room below this option, of course, but High and Highest look close enough that it’s not a huge loss to “downgrade.” Some cards are dropped from this chart as they were doing fine at Highest.
The GTX 1080 FTW runs an average FPS of 126 now, and could hit 1440p with 144Hz if dropping settings further – though the Ti does this more readily. Vega 64 operates an AVG FPS of 106, with frametimes reasonably consistent in this particular scenario. It seems that Vega 64 is more sensitive to one of the graphics settings in the Highest preset, which is something we’ll have to explore as time allows. With High, frametimes improve to a point of being consistent enough that most users won’t complain – though average FPS does need to climb closer to the 1080 to remain at least half-way competitive. Either way, here’s a frametime plot of the 1080 and V64, showing some improvement on V64:

V64’s not competitive enough in Destiny 2’s beta, but we’re stuck in a wait-and-see cycle on Vega right now, with the present setting being “wait” to see if new drivers ship and improve things.

As for the other cards, back to the 1440p High chart, performance remains above 60FPS AVG across the board, with low-end frametime performance also reasonably boosted. All of these devices could reasonably handle this configuration, perhaps with the RX 570 needing a slight settings reduction to ensure a high baseline.
One item of note: The RX 580 8GB card improved from 38FPS AVG at Highest to 75FPS AVG at High, which is almost exactly a 2x performance leap. The GTX 1060 6GB card saw a leap of 62% from Highest to High which, although not as impressive, is still a massive jump when considering the visual quality difference. If using AMD hardware, it’s becoming clear that running at High settings is preferable. After we get through the rest of these charts, we’ll look at the impact of SSAO on performance to determine if that’s the culprit for the big hit these cards are taking.
Destiny 2 GPU Benchmark – Highest Graphics, 4K
Here’s 4K with the highest graphics setting and FXAA.

We only have a few cards here – go figure, it’s intensive – and see the GTX 1080 Ti SC2 playing decently, but not as well as we’d like. Our multiplayer matches had us at 55FPS AVG in this configuration, but dropping a few settings to high would help improve to more playable 4K levels. The GTX 1080 non-Ti and Vega 64 are both having trouble with these settings.
Destiny 2 GPU Benchmark – High Graphics, 4K

High is more playable, with the 1080 Ti SC2 seeing an immense performance uplift of 71% from Highest, and the Vega 64 card nearly doubling its performance. The “highest” preset is clearly taxing in ways which may not be appreciated – particularly in multiplayer matches – when compared to the framerate reduction. This is true for both nVidia and AMD hardware, but is more noticeable at 4K, given the higher pixel count.
There’s clearly a large leap from jumping between High and Highest. In some spot checks, we see improvements of around 60-70% on specific nVidia hardware, and improvements of around 90-100% on AMD hardware. AMD’s frametime performance also markedly improves once we go down to high, so take note AMD owners, but it seems as if there’s more headroom in these cards.
In the interim, there’s clearly benefit from going to High. Let’s take a look at some individual settings tuning on the RX 580.
Preliminary Destiny 2 Graphics Optimization Guide
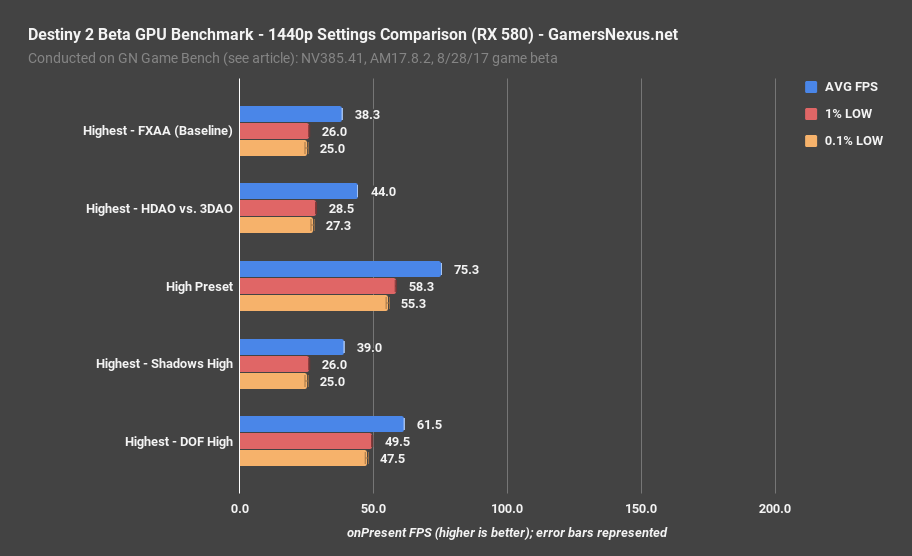
This chart shows the RX 580 8GB card at 1440p, using Highest – FXAA as a baseline and High Preset as our target number. We toggled a few settings between Highest and High, ultimately finding that the Depth of Field setting is responsible for about a 38% performance hit on its own, as switching to High boosts FPS from 38 to 62 AVG. 3DAO is responsible for about a 13% hit on its own, moving us to 44FPS from 38FPS AVG.
If you’d like to play on Highest settings without sacrificing too much performance, these are the two options immediately worth tweaking. They seem to presently impact AMD most noticeably.
Conclusion
Destiny 2 proves remarkably playable at 1080p/High for all the cards we tested, more or less, and runs reasonably with “Highest” settings. The trick is that, evidently, “Highest” brings with it a tremendous performance hit in the form of Depth of Field, without necessarily gaining a visible benefit in some scenes. We need more time on the game to really dig into the graphics options. In the interim, go for DOF and AO tuning to improve framerate.
Editorial, Test Lead: Steve Burke
Video: Andrew Coleman