UPDATE: We have run new CPU benchmarks for the launch of this game. Please view the Destiny 2 launch CPU benchmarks here.
Our Destiny 2 GPU benchmark was conducted alongside our CPU benchmark, using many of the same learnings from our research for the GPU bench. For GPU testing, we found Destiny 2 to be remarkably consistent between multiplayer and campaign performance, scaling all the way down to a 1050 Ti. This remained true across the campaign, which performed largely identically across all levels, aside from a single level with high geometric complexity and heavy combat. We’ll recap some of that below.
For CPU benchmarking, GN’s Patrick Lathan used this research (starting one hour after the GPU bench began) to begin CPU tests. We ultimately found more test variance between CPUs – particularly at the low-end – when switching between campaign and multiplayer, and so much of this content piece will be dedicated to the research portion behind our Destiny 2 CPU testing. We cannot yet publish this as a definitive “X vs. Y CPU” benchmark, as we don’t have full confidence in the comparative data given Destiny 2’s sometimes nebulous behaviors.
For one instance, Destiny 2 doesn’t utilize SMT with Ryzen, producing utilization charts like this:
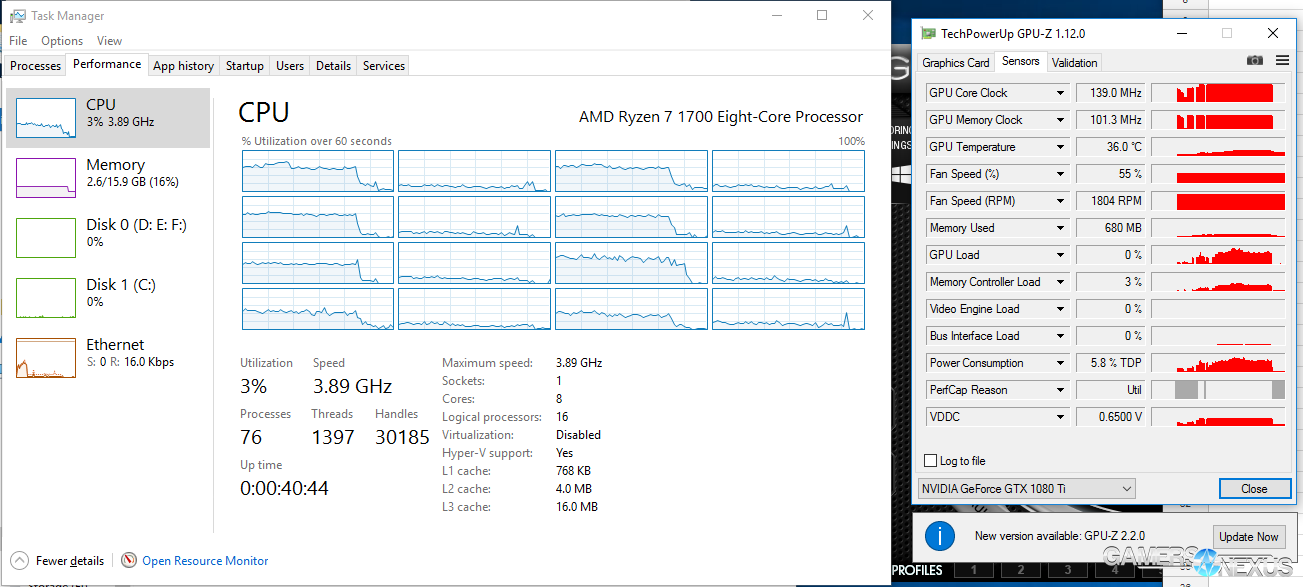
(Above: Taken after the test was complete, so look at the historical graph)
Although we didn’t have time to try it out, we’d imagine that disabling SMT altogether may actually produce a performance uplift for Ryzen, similar to what we saw in early testing on the arch. Total War: Warhammer, for instance, greatly benefited from SMT0, but ultimately received updates that improved performance on both Intel Hyperthreaded and AMD SMT parts. As we do not know the planned updates for Destiny 2, we can’t state whether this performance will improve for AMD’s Ryzen CPUs; however, we do hope that Bungie realizes the tremendous amount of performance left on the table and attempts to better utilize Ryzen’s thread advantage. As of now, half of the R7 CPU is unused, effectively rendering the R7 and high-end R5 CPUs equivalent in performance.
Destiny punishes Ryzen CPUs by ignoring SMT, to the point where we saw effectively 0% utilization on the SMT threads. With the R7 1700, all cores were engaged, but only the physical cores. This remained a theme for the 1600X as well, where the logical threads did not engage with the game. The good news is that we’ve seen this before: Total War: Warhammer and Battlefield 1 both pushed updates post-Ryzen that improved performance on Intel and AMD alike, and that was by better utilizing the SMT threads. We’re unclear on if this will happen for Destiny 2 at some point, but for now, we’re off to a rough start. The game is reasonably optimized on GPUs – sans Depth of Field settings – but is clearly lacking on the CPU front.
We also encountered issues with OSDs: On the first day of the (then-private) beta, on-screen displays worked flawlessly. The launch of the public beta broke those, but we were able to resort to other tools (which are yet to be discovered by Bungie, it seems) to continue our benchmark capture. In-house scripts were used to analyze data after that. We hope that Bungie wakes up and realizes the value of OSDs for launch, as the world’s biggest eSports titles don’t seem to have issues with OSDs, and they certainly care more about cheating than Destiny 2 might.
One final caveat: The game is in beta, so everything is subject to change. These results will change for launch, particularly when the game adds in more levels, game modes, and environments. We’ll revisit the title at final launch.
The game clearly has some issues, so we’re focusing our efforts on research rather than hard comparisons. We can only speak to our findings and our tests right now; where Destiny 2 does fine on the GPU front, it has a lot of room for growth on the CPU front, which lowers confidence in comparative data between products. The lack of CPU performance scaling across multiple settings sort of makes you wonder what’s going on, and whether the final launch will modify this behavior.
Test Platforms
- Z270: MSI Z270 Gaming Pro Carbon
- AM4: ASUS Crosshair VI Hero
- RAM (for each): 16GB (2x8) GEIL 3200MHz XMP1
- GPU (for each): EVGA GTX 1080 Ti FTW3
- PSU (Intel): NZXT Hale90 v2 Gold
- PSU (AMD): Thermaltake Toughpower Gold
Recapping the 7700K’s Scaling (from GPU benchmark)
The below is a recap of GPU scaling with a 7700K, as it is representative of 7700K performance across multiple cards, environments, settings, and game modes. We’ll show similar for the R3 1200 after.
Testing during the campaign, we took spot measurements throughout the entire tutorial play session over a period of about 20 minutes, with a couple of other measurements that ran for 5 minutes per logging period. This was with a 1080 Ti SC2 at 4K and Highest settings. We’ll look at comparative benchmarks momentarily, but we first want to define what works for a benchmark.
GTX 1080 Ti SC2, 4K, HighestFirst 20 Minutes of Campaign | |||
| AVG FPS | 1% LOW | 0.1% LOW | |
| Spot-Check #1 | 51.0 | 45.0 | 44.0 |
| Spot-Check #2 | 52.0 | 46.0 | 40.0 |
| Spot-Check #3 | 53.0 | 48.0 | 46.0 |
| Spot-Check #4 | 53.0 | 47.0 | 43.0 |
| Spot-Check #5 | 51.0 | 44.0 | 39.0 |
| Spot-Check #6 | 55.0 | 48.0 | 43.0 |
| Spot-Check #7 | 51.0 | 46.0 | 39.0 |
| Spot-Check #8 | 51.0 | 47.0 | 44.0 |
| Spot-Check #9 | 44.0 | 39.0 | 33.0 |
| Spot-Check #10 | 51.0 | 42.0 | 42.0 |
| 5-Minute Campaign Intro | 58.0 | 49.0 | 45.0 |
| Final Bench Scene | 55.0 | 48.0 | 47.5 |
| Standard Deviation | 3.4 | 2.9 | 3.9 |
This table shows each spot measurement against one another, then against the final benchmarking course: Overall, our FPS range is consistent. There is one lower FPS number out of all of these, cropping-up in a densely packed city street with complex geometry. We only saw this FPS dip one time during the campaign, and it seemed tied to that specific zone. Averaging the spot checks across the entire 20-minute session, we end up at 51FPS AVG, 45FPS 1% lows, and 41FPS 0.1% lows. Comparatively, our chosen benchmark course – selected for its accurate repetition – ended up at 55FPS AVG, 48FPS 1% lows, and 47.5FPS 0.1% lows. These numbers are remarkably close and show that, in the very least, our benchmarking method is representative of the entirety of the beta intro campaign.
Let’s look at how this compares to competitive multiplayer matches.
GTX 1080 Ti SC2, 4K, HighestMultiple Competitive Matches | |||
| AVG FPS | 1% LOW | 0.1% LOW | |
| Match #1, Spot-Check #1 | 53.0 | 45.0 | 43.0 |
| Match #1, Spot-Check #2 | 53.0 | 42.0 | 40.0 |
| Match #2, Spot-Check #1 | 57.0 | 50.0 | 41.0 |
| Match #2, Spot-Check #2 | 55.0 | 48.0 | 46.0 |
| Final Bench Scene | 55.0 | 48.0 | 47.5 |
| Standard Deviation | 1.7 | 3.1 | 3.2 |
Taking spot measurements across several multiplayer sessions on the Midtown map, we end up with this new table of results. The range is 53 to 57FPS AVG, and averaging all the spot checks puts us at 54.5FPS, with 1% lows at 46FPS, and 43FPS 0.1% lows. These are close enough that campaign benchmarking looks accurate to multiplayer performance in the beta state of the game.
To get a broader sense of scalability across the game’s various maps and game modes, here’s an MSI GTX 1050 Ti at 1080p and High settings:
Destiny 2 Benchmark Research: MSI GTX 1050 Ti
GTX 1050 Ti "OC," 1080p, HighMultiple Competitive Matches | |||
| AVG FPS | 1% LOW | 0.1% LOW | |
| Match #1, Spot-Check #1 | 79.0 | 67.0 | 62.0 |
| Match #1, Spot-Check #2 | 73.0 | 60.0 | 59.0 |
| Match #2, Spot-Check #1 | 74.0 | 59.0 | 57.0 |
| Match #2, Spot-Check #2 | 66.0 | 62.0 | 62.0 |
| Match #3, Spot-Check #1 | 79.0 | 71.0 | 58.0 |
| Final Bench Scene | 69.8 | 54.5 | 53.5 |
| Standard Deviation | 5.1 | 5.9 | 3.2 |
GTX 1050 Ti "OC," 1080p, HighFinal Bench Run (Campaign) | |||
| AVG FPS | 1% LOW | 0.1% LOW | |
| Pass #1 | 71.0 | 55.0 | 54.0 |
| Pass #2 | 69.0 | 55.0 | 54.0 |
| Pass #3 | 70.0 | 54.0 | 53.0 |
| Pass #4 | 69.0 | 54.0 | 53.0 |
| Final Bench AVG | 69.8 | 54.5 | 53.5 |
| Standard Deviation | 1.0 | 0.6 | 0.6 |
Our benchmark course outputs a framerate of 70FPS AVG, with lows at 54.7FPS 1% and 53.7FPS 0.1%. Compared to a pair of multiplayer matches on Midtown, we see framerates of 74FPS AVG, 63FPS 1%, and 59FPS 0.1%. The difference is approximately 6% -- considering the tradeoff is significantly more reproducible results, that’s really not too bad. You’d see a bigger range of variance in a game like Battlefield (with 64 players), although it’s possible that Destiny 2’s final iteration could show greater swings across other maps and game modes. We’ll have to reserve judgment on that until it fully ships.
Destiny 2 Benchmark Research: MSI RX 580 8GB
MSI RX 580 8GB, 1080p, HighestMultiple Competitive Matches | |||
| AVG FPS | 1% LOW | 0.1% LOW | |
| Match #1, Spot-Check #1 | 77.0 | 66.0 | 62.0 |
| Match #1, Spot-Check #2 | 67.0 | 62.0 | 58.0 |
| Match #2, Spot-Check #1 | 77.0 | 66.0 | 61.0 |
| Match #2, Spot-Check #2 | 88.0 | 68.0 | 63.0 |
| Match #3, Spot-Check #1 | 84.0 | 72.0 | 67.0 |
| Match #3, Spot-Check #2 | 79.0 | 66.0 | 63.0 |
| Match #4, Spot-Check #1 | 83.0 | 68.0 | 63.0 |
| Match #4, Spot-Check #2 | 75.0 | 63.0 | 60.0 |
| Final Bench Scene | 85.0 | 66.3 | 62.3 |
| Standard Deviation | 6.4 | 2.9 | 2.5 |
MSI RX 580 8GB, 1080p, HighestFinal Bench Run (Campaign) | |||
| AVG FPS | 1% LOW | 0.1% LOW | |
| Pass #1 | 86.0 | 67.0 | 63.0 |
| Pass #2 | 84.0 | 66.0 | 62.0 |
| Pass #3 | 85.0 | 66.0 | 62.0 |
| Pass #4 | 84.0 | 66.0 | 63.0 |
| Final Bench Scene | 84.8 | 66.3 | 62.3 |
| Standard Deviation | 1.0 | 0.5 | 0.6 |
Destiny 2 Beta Research with R3 1200: Multiplayer & Campaign Scaling
Let’s look at performance scaling in competitive multiplayer versus the intro campaign. As a reminder, we tested this for our GPU benchmark and found that scaling was highly consistent on our 7700K and GTX 1080 Ti, 1050 Ti, and RX 580. Ultimately, standard deviation was far greater in multiplayer, and the average performance tended to be within a couple percentage points of campaign – generally about a 6% difference in performance between the two, but with far greater consistency and tighter standard deviation in the campaign.
As you can see with the 7700K numbers, most the campaign tests were within the bounds of the more variable competitive testing on Midtown. This makes campaign a good stand-in, but again, more on that in the GPU video.
AMD R3 1200, 1080p, HighestMultiple Competitive Matches | |||
| AVG FPS | 1% LOW | 0.1% LOW | |
| Pass 1 | 90.0 | 60.0 | 40.0 |
| Pass 2 | 82.0 | 57.0 | 40.0 |
| Pass 3 | 88.0 | 63.0 | 42.0 |
| Pass 4 | 79.0 | 54.0 | 38.0 |
| Pass 5 | |||
| Final Bench Scene | 84.8 | 58.5 | 40.0 |
| Standard Deviation | 5.1 | 3.9 | 1.6 |
Let’s look at a table of R3 1200 runs on the Midtown multiplayer map, using 1080p/Highest settings across multiple competitive matches. We’re averaging 85FPS, with lows at 59FPS 1% and 40FPS 0.1% low. The range is 79FPS to 90FPS for this test sequence, with standard deviation at about 5FPS for the averages.
AMD R3 1200, 1080p, HighestCampaign Bench Run | |||
| AVG FPS | 1% LOW | 0.1% LOW | |
| Pass 1 | 93.0 | 60.0 | 49.0 |
| Pass 2 | 94.0 | 62.0 | 53.0 |
| Pass 3 | 93.0 | 60.0 | 52.0 |
| Pass 4 | 94.0 | 60.0 | 52.0 |
| Pass 5 | 95.0 | 60.0 | 52.0 |
| Final Bench Scene | 93.8 | 60.4 | 51.6 |
| Standard Deviation | 0.8 | 0.9 | 1.5 |
| Campaign v. Multiplayer Delta | 9.1 | 1.9 | 11.6 |
Bringing the campaign results up, still for the R3 1200 at 1080p/Highest, our standard deviation tightens to 0.8FPS AVG, now with a final bench score of 94FPS AVG, 60FPS 1% lows, and 52FPS 0.1% lows. This makes the campaign bench scene score approximately 9FPS higher in averages and markedly higher in 0.1% low frametime consistency. We’ve got a bigger spread here than with GPU testing, unfortunately, and it seems to deal with how the lower-end CPUs are engaged during multiplayer. The gap is about 9% between campaign and multiplayer with an R3. That gives us a starting point for understanding performance throughout the game.
AMD R3 1200, 1080p, HighMultiple Competitive Matches | |||
| AVG FPS | 1% LOW | 0.1% LOW | |
| Pass 1 | 82.0 | 55.0 | 41.0 |
| Pass 2 | 95.0 | 55.0 | 36.0 |
| Pass 3 | 85.0 | 56.0 | 39.0 |
| Pass 4 | 86.0 | 57.0 | 39.0 |
| Pass 5 | 86.0 | 54.0 | 39.0 |
| Final Bench Scene | 86.8 | 55.4 | 38.8 |
| Standard Deviation | 4.9 | 1.1 | 1.8 |
| Delta 1080p H vs. Highest | 2.1 | -3.1 | -1.2 |
AMD R3 1200, 1080p, HighCampaign Bench Run | |||
| AVG FPS | 1% LOW | 0.1% LOW | |
| Pass 1 | 92.0 | 62.0 | 53.0 |
| Pass 2 | 93.0 | 61.0 | 50.0 |
| Pass 3 | 94.0 | 61.0 | 50.0 |
| Pass 4 | 93.0 | 61.0 | 56.0 |
| Final Bench Scene | 93.0 | 61.3 | 52.3 |
| Standard Deviation | 0.8 | 0.5 | 2.9 |
| AVG FPS | 1% LOW | 0.1% LOW | |
| Delta 1080p H vs. Highest | -0.8 | 0.9 | 0.6 |
| Delta 1080p H vs. 1440p H | -0.3 | 0.0 | -0.8 |
| Campaign v. Multiplayer Delta | 6.2 | 5.9 | 13.5 |
Moving to 1080p/High, our competitive matches now range from 82 to 95FPS, averaging out to 87FPS AVG, 55FPS 1% lows, and 40FPS 0.1% lows. Compared to the previous multiplayer logs with 1080p/Highest settings, we’ve got a delta of +/-2FPS AVG, which is effectively equal. This is a trend we run into with the low-end CPUs in comparative testing, as the parts bump into a wall that isn’t remedied by going from Highest to High. Bringing the campaign table up, we see a final bench scene score of 93FPS, 1% lows at 61FPS, and 0.1% lows of 52FPS. Compared to multiplayer’s final bench averages, we’re about 6FPS higher in average framerate and 13FPS higher in 0.1% low frametimes. Although we saw a much smaller difference on the 7700K, the lower-end R3 CPU is more susceptible to frametime variance in multiplayer than in campaign, as far as our testing goes.
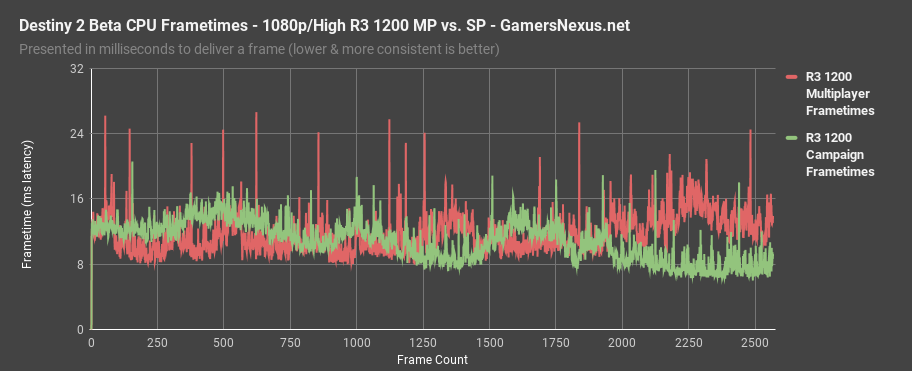
Here’s a frametime plot showing R3 1200 performance at 1080p/High when in a multiplayer match, matched against the same CPU and settings in campaign mode. Frametime variance is reflected visibly.
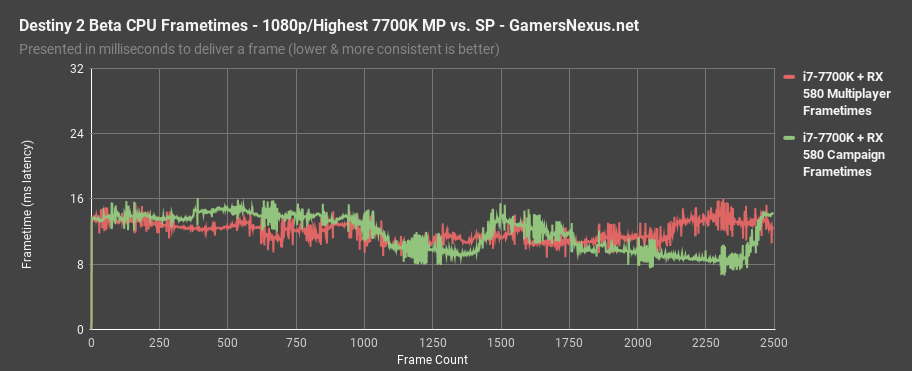
If we make another frametime plot for the 7700K in campaign versus singleplayer, using the settings detailed on the chart header, it’s clear that the performance impact is less significant.
There’s a lot more to know, but we won’t have enough time prior to the beta’s end to figure it all out. Most of that will wait til October.
Anyway, for now, we’re seeing bigger swings in performance on the R3 versus the i7 CPU. We’ll have to reevaluate testing options for CPUs in Destiny 2 once the game properly launches, but right now, the variance is greater than what we see with GPU testing. This makes test courses more difficult to figure out. All we can do for now is demonstrate the research so that viewers and readers can apply this knowledge toward other game modes. We committed to testing campaign for this one, as it is still the most consistent and reliable, so just keep in mind that low-end hardware frametime performance may take a bigger hit in multiplayer. And remember: we can only speak to what we’re seeing in our tests.
One of our next topics is the impact of graphics settings on the R3 1200, hopefully enabling us to better understand performance differences and where there’s headroom for improvement.
Impact of Graphics Settings on CPU Scaling in Destiny 2 Beta
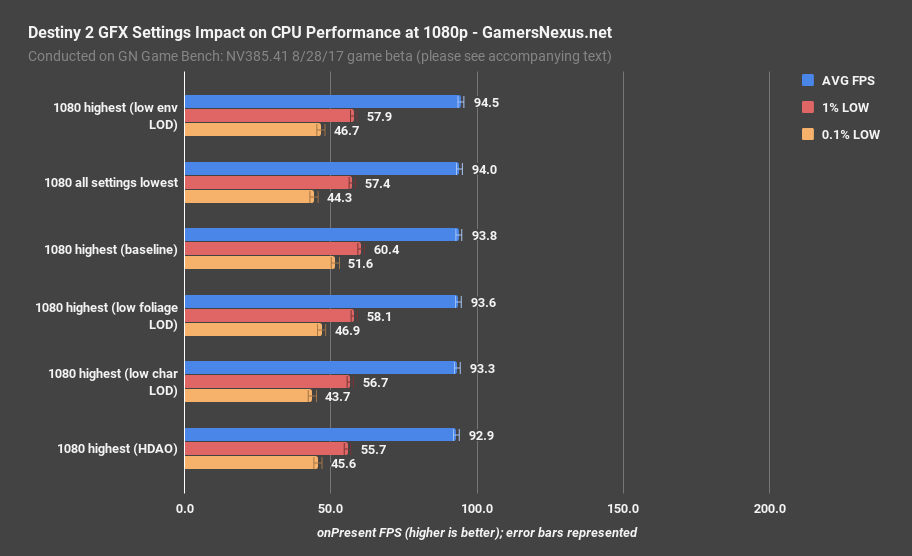
Our first attempt at improving framerate went something like this. Almost no change. In the campaign areas we tested, these settings had minimal impact. That might change as new areas are introduced, or in areas with more objects that are affected by draw distance, but we didn’t find a location in the limited time of the beta. Most the impact seems to go to either the GPU or just isn’t visible in the current accessible areas of the game, so there’s room for this to change later. Either way, going from Highest settings to lowest settings produced no measurable difference in performance, but a huge difference in visual quality.
AMD R3 1200, 1080p, MinimumMultiple Competitive Matches | |||
| AVG FPS | 1% LOW | 0.1% LOW | |
| Pass 1 | 86.7 | 47.2 | 30.8 |
| Pass 2 | 92.5 | 53.6 | 38.4 |
| Pass 3 | 91.9 | 58.3 | 43.5 |
| Pass 4 | 98.0 | 55.3 | 39.4 |
| Pass 5 | 105.5 | 61.2 | 42.5 |
| Final Bench Scene | 94.9 | 55.1 | 38.9 |
| Standard Deviation | 7.1 | 5.3 | 5.0 |
AMD R3 1200, 1080p, MinimumCampaign Bench Run | |||
| AVG FPS | 1% LOW | 0.1% LOW | |
| Pass 1 | 93.6 | 58.3 | 42.8 |
| Pass 2 | 93.8 | 55.5 | 43.8 |
| Pass 3 | 94.6 | 58.4 | 46.3 |
| Final Bench Scene | 94.0 | 57.4 | 44.3 |
| Standard Deviation | 0.5 | 1.6 | 1.8 |
We next attempted this in multiplayer, despite greater variance test-to-test, and found that that the highest settings in multiplayer matches produced the numbers on the left, and that minimum settings produced the output on the right. We’re showing each test pass, since there’s more variance in each execution. Our difference ended up being 85FPS AVG and 40FPS 0.1% lows for Highest, with minimum settings being 95FPS AVG and about 40FPS 0.1% lows. Again, that’s minimum – that’s disabling stuff down below even the lowest preset. The game looks awful at this point, as we can show in broll in the video, and all those changes net only about a 9-10% performance uplift. Now, of course, this is just one CPU – if you count the 7700K from our GPU tests, that’s two – so we can’t definitively speak for all the CPUs. As far as this one goes, there’s more room for GPU scaling than CPU scaling, in our testing.
Preliminary CPU Benchmarks: Destiny 2 Beta at 1080p/highest
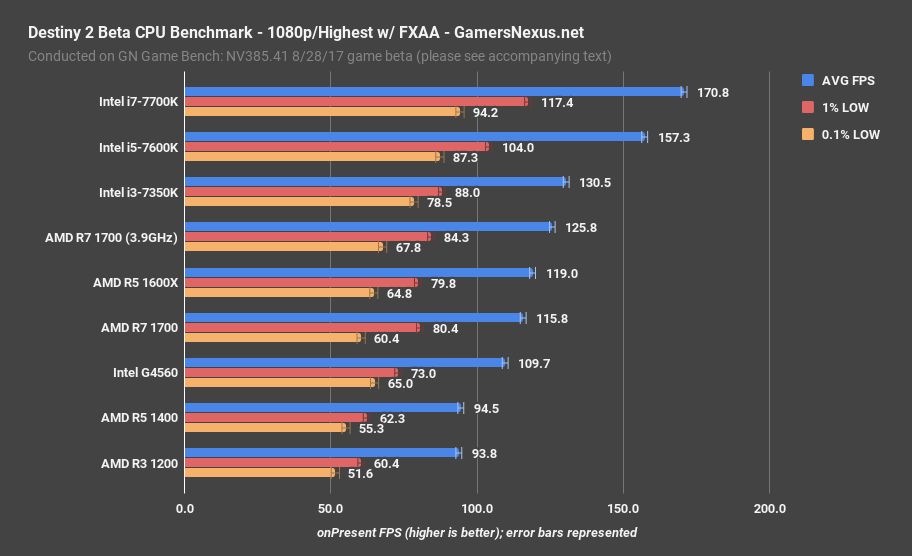
Starting comparative benchmarks with 1080p and Highest settings, the Intel i7-7700K chart-tops at 171FPS AVG, which is bumping against the 200FPS frame cap that’s enabled by default. This means that frametime latencies faster than 5ms will be capped to 5ms, and so will drag down the average below what could be possible. The next CPU in line is the i5-7600K stock CPU, performing at 157FPS AVG, 104 FPS 1% lows, and 87FPS 0.1% lows. This is trailed next by the i3-7350K at 131FPS AVG, with lows at 88 1% and 79FPS 0.1%. Our overclocked R7 1700 – effectively a stand-in for the 1700X and 1800X as well, since they all can achieve similar clocks – performs at 126FPS AVG at 3.9GHz. This plants the 3.9GHz R7 CPU a few FPS behind the i3 CPU. Part of this performance deficit is due to Destiny 2’s failure to acknowledge all the threads, as only the physical cores are engaging properly. We know that this isn’t the performance people want to see out of an R7, but remember that Destiny 2 is having trouble with SMT and other issues in its beta. Our confidence isn’t strong enough right now to state with authority that these results are representative of all configurations and scenarios, as the game is still developing and clearly has some issues.
Down the line, the R5 1600X performs about 2.7% behind the overclocked R7 1700. Keep in mind that, as far as Bungie is concerned, the 1600X is a 6-thread CPU and the 1700 is an 8-thread CPU, so the actual advantages of the 1700 are not reflected here. We’re looking at a 200MHz clock difference that manifests in a 2.7% boost. Both the 1600X and stock 1700 boost to 3.7GHz, making them effectively equal to Bungie’s eyes, and planting the two within variance of one another. The 1600X and 1700 are effectively equal in this game.
Intel’s G4560, meanwhile, performs at 110FPS AVG, with lows at 73 and 65 0.1%. Frametimes so far are reasonable across the board. The next closest Intel part is the 7350K, presently $70 more than the G4560 in the US, which is 19% faster than the G4560.
The R5 1400 and R3 1200 round-out the low-end of the pack, both near 94FPS AVG.
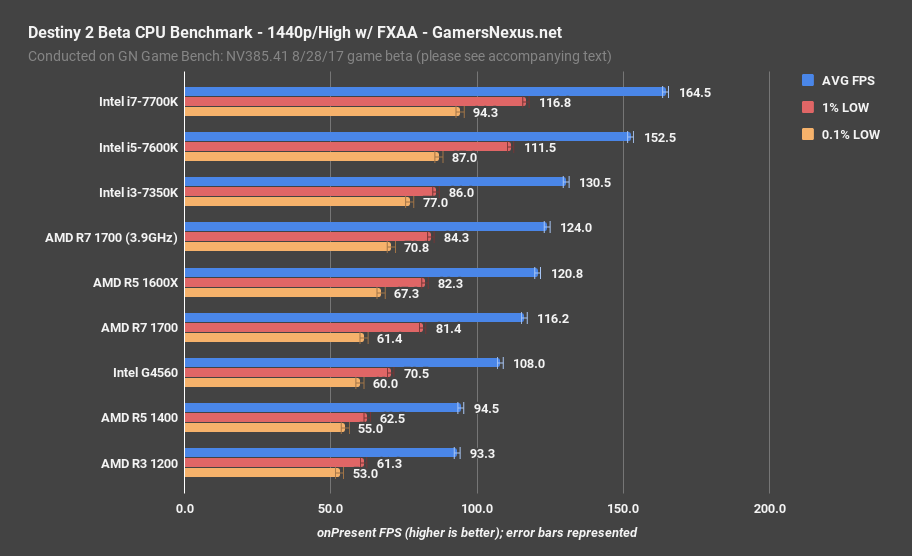
Preliminary CPU Benchmark: Destiny 2 Beta at 1080p/High

Here’s where it gets interesting: Switching to 1080p with High settings, you likely barely noticed that the charts changed. A lot of the numbers remain the same, with minimal scaling when reducing to High settings. Many of the options that change between High and Highest are GPU-limiting, like Depth of Field and AO, and so won’t appear in CPU-constrained tests. The performance stack is largely the same here, though we’ve gained a few FPS for the R7 1700 and 1600X. Otherwise, the results are effectively within test-to-test variance. We’d have to manually adjust CPU-limiting settings to get a better idea here, like items governing geometry, LOD, and view distance.
Preliminary CPU Benchmark: Destiny 2 Beta at 1440p/Highest
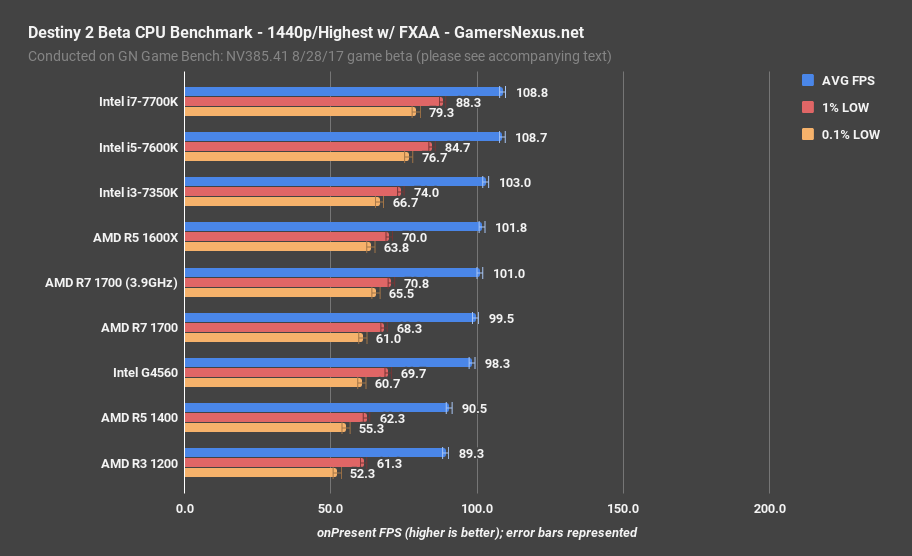
We also added 1440p to testing to get an idea for how (or if) the CPU deltas close as more load is placed elsewhere in the system.
With Highest settings, the i7-7700K falls to 109FPS AVG from its 170+ perch previously, with 1% lows at 88 and 0.1% lows at 79. The i5-7600K is now just behind the 7700K, indicating a GPU bottleneck at this resolution. This is why higher resolutions and graphics settings serve as an equalizer of CPU performance, in many instances. Even the i3-7350K is nearby in averages, though technically lower in frametimes. Behind the 7350K is the 1600X, now getting closer to the chart-topping CPUs in performance. This is thanks to resource limitations elsewhere – almost assuredly the GPU. We’re at a deficit of 6.9% to the 7700K now, rather than the bigger gaps earlier. The 1700 at 3.9GHz performs effectively identically, within variance, and the 1700 is nearby. It’s not until we hit the R5 1400 and R3 1200 that framerate drops reasonably below 100FPS.
Preliminary CPU Benchmark: Destiny 2 Beta at 1440p/High
Switching over to 1440p/High settings, we see general uplift for the parts across the board, with FPS approaching original values. There are no big changes here when compared to the 1080p/High values.
Conclusion: Waiting on the Launch
Again, the game is presently in beta, and won’t launch until October 24. Much of the game is still locked-down or unreleased, which means that performance will invariable change as we encounter new maps and environments with full launch. There’s also room for optimizations to be made by Bungie – but we’ll see. Game developers don’t often make those kinds of changes in the final hours, but that doesn’t mean Bungie will follow that trend. We’d like to see SMT somehow utilized, for one, and we suspect that options will have greater impact on game performance closer to launch. Right now, anti-aliasing is only partially complete (by Bungie’s own admission), so we used FXAA over the WIP MSAA. We don’t know if more options might appear at launch or if the present ones might be more fully implemented, but either of those avenues would change performance metrics.
In the very least, we’ve learned the multiplayer and campaign performance have minimal difference with GPU workloads and the i7 CPU, but have greater variance toward the low-end parts. The R3 1200 is one of these, and the G4560 would also follow this trend. Multiplayer tended to be more abusive on the lower-end parts in the frametime department, where we’d see fluctuations in frame latency that didn’t appear in campaign gameplay. These did not emerge in the same fashion in the GPU tests.
There’s a lot more to do here, and we’ll study this game closely on its launch. For now, please keep in mind that the comparative benchmarks are presented with lower confidence than we feel comfortable with; the game’s beta status fuels this, as does its confusing behavior, at times. Rather than brandishing our charts as a weapon in some fanatical war against the “other” brand, we’d advise that you take them under advisement of low confidence, and expectations that the comparative performance may yet change with the full launch. For now, this is what we saw in our testing.
Editorial: Steve Burke
Testing & Research: Patrick Lathan
Video: Andrew Coleman