Our Destiny 2 GPU benchmark highlighted massive performance uplift vs. beta on some devices, upwards of 50% on Vega, but was conducted in largely GPU-constrained scenarios. For this content piece, we’ll be exploring the opposite: CPU-constrained scenarios to benchmark Destiny 2 performance on AMD Ryzen and Intel Kaby/Coffee Lake parts, including the R7 1700, R5 1600X, R3 1200, and i7-7700K, i5-7600K, i3-8350K, and G4560.
Most of our test notes have already been recapped in the GPU benchmark, and won’t be fully repeated. Again, we ran a wide spread of tests during the beta, which will be informing our analysis for the Destiny 2 launch benchmarks. Find the previous content below:
- Destiny 2 Beta GPU Benchmark (+ graphics optimization guide, PvP scalability)
- Destiny 2 Beta CPU Benchmark (soon replaced by our Destiny 2 launch CPU bench)
- Destiny 2 texture comparison
In the beta run of our tests, we had two CPUs that won’t be making an appearance here: The R5 1400 is one, and the 7350K is the other. The 7350K has been replaced with the 8350K for this run, and the R5 1400 offered functionally equivalent performance to the R3 1200 last time (pursuant to Destiny 2’s frequency bias), so we won’t waste time producing two sets of the same results.
As a reminder, keep in mind that comparing benchmark numbers is more about percent scaling from one component to the next, not about hard FPS numbers. We are not trying to determine game-wide performance behavior on all devices, but rather trying to determine performance scaling between parts. For PvP and tests of other areas of the game, refer to our beta GPU benchmarks and launch GPU benchmarks.
We only overclocked one component in this testing – the R7 1700 – and that was because we can test a single R7 part (the 1700) to ascertain all R7 performance. They’re the same CPUs. If they’re at the same clocks, they’ll perform identically – ergo, the R7 1700 was overclocked to 3.9GHz, representing the 1700X and 1800X when also set to 3.9GHz. As a final note, we did apply an EFI/AGESA update since the beta CPU benchmarks, so that will be responsible for some uplift alongside the Destiny 2 code changes. SMT still seems non-functional in Destiny 2.
Motherboards used:
- ASUS CH6 AM4 (all Ryzen CPUs)
- Gigabyte Z370 Ultra Gaming (8350K)
- Gigabyte Z270 Gaming 7 (Kaby Lake CPUs)
Memory: 2x8GB GeIL 3200MHz CL16 (all platforms)
Cooler: Kraken X62 at max RPM
PSU: NZXT Hale90 V2
Destiny 2 CPU Benchmark (1080p, Highest) – 1700, 1600X, 7700K, etc
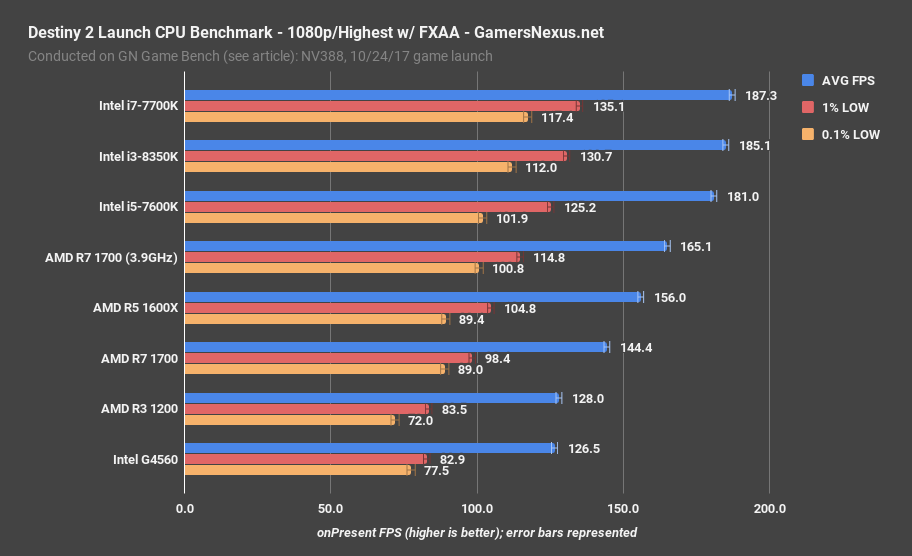
1080p with Highest settings and FXAA positions the i7-7700K CPU expectedly chart-topping, given Destiny 2’s propensity for higher frequency CPUs. Framerate for the 7700K was at 187FPS AVG. This places the 7700K about 3.5% ahead of the i5-7600K quad-core when both are at stock speeds, though the 7700K does have measurable – if perhaps imperceptible – uplift in frametime consistency via 0.1% lows. The i3-8350K proves the point of frequency impact for this game, outperforming the 7600K.
Next in the stack is the listing of AMD Ryzen CPUs, including the R7 1700 3.9GHz CPU at 165FPS AVG, a gain of 14% over the stock R7 1700 CPU’s 144FPS AVG. Lows also seem measurably improved. This positions the stock 7700K approximately 13.5% ahead of the R7 1700 overclocked CPU, or about 29.7% ahead of the stock R7 1700. That alone should further emphasize just how much this game cares about clocks, if the lack of SMT support wasn’t enough, as overclocking the 1700 gains significant ground.
The 1600X performs close to the 1700, thanks to similar clock speeds, and the R3 1200 operates just ahead of the G4560. The two are more or less within margin of error from one another.
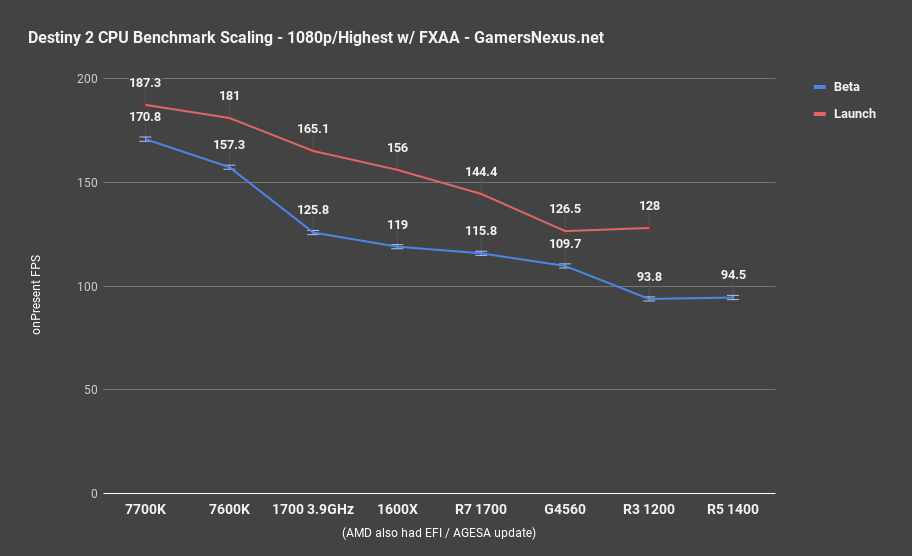
Looking at scalability of CPU performance between the beta and launch versions, keeping in mind that we had to change software for measurement, we’re seeing reasonable gains across the board. Some of this comes from the finalization of Destiny 2, with some coming from GPU driver uplift, and the rest out of the AMD EFI/AGESA change applied in between.
Destiny 2 CPU Benchmark (1080p, High) – 7700K, 1600X, 1700, 7600K, G4560

Moving to 1080p with High settings, we’re observing minimal change in the 7700K’s performance, though the rest of the stack remains the same.
These CPUs are scoring nearly exactly the same framerates as at 1080p/Highest, mirroring our findings from the beta almost precisely, with regard to performance scalability across settings. The implication is a CPU bottleneck.
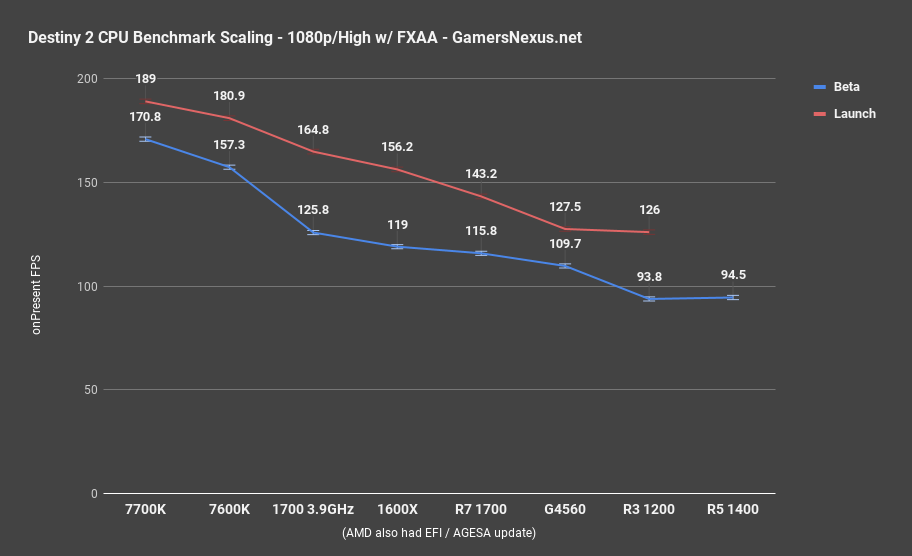
Our scalability chart plots nearly the same trend as from the previous settings, marking an upward performance gain across the board.
Destiny 2 CPU Benchmark (1440p, Highest) – 1600X, 1700, 7700K, 8350K
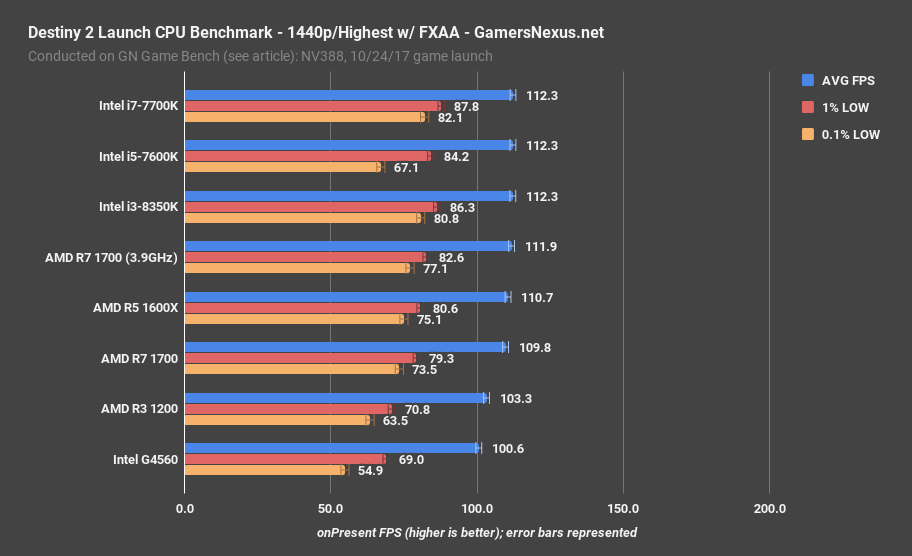
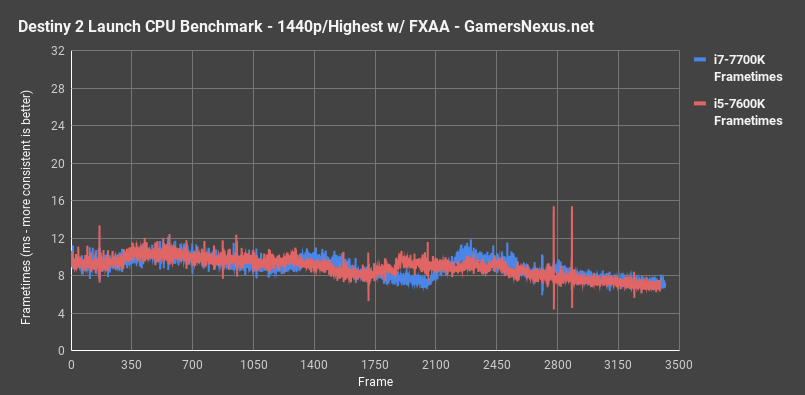
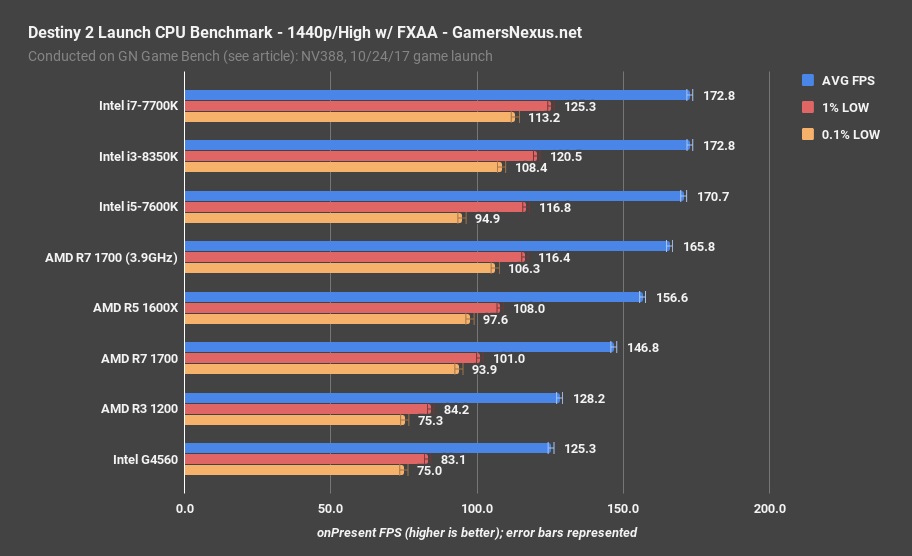
Moving to 1440p/Highest next, we’ve now encountered a clear GPU bottleneck. The 7700K and 7600K illustrate our performance ceiling at around 112FPS AVG, though the 7700K does offer greater frametime consistency with its 82FPS 0.1% lows to the 67FPS 0.1% lows of the 7600K. This is also somewhat visible in a frametime plot, with the variability becoming slightly more apparent in the 7600K’s figures.
The overclocked 1700 is now largely tied with the higher-end CPUs. The CPUs are following a GPU bottleneck (1080 Ti FTW3), and the 1700 outputs a 112FPS AVG with similar frametime performance, if a bit behind the 7700K. Overclocking barely even matters, at this point, as the stock 1700 is already at 110FPS AVG.
The R3 1200 and G4560 help form the floor, at 103 and 101FPS, respectively, with 55FPS 0.1% lows for the G4560.
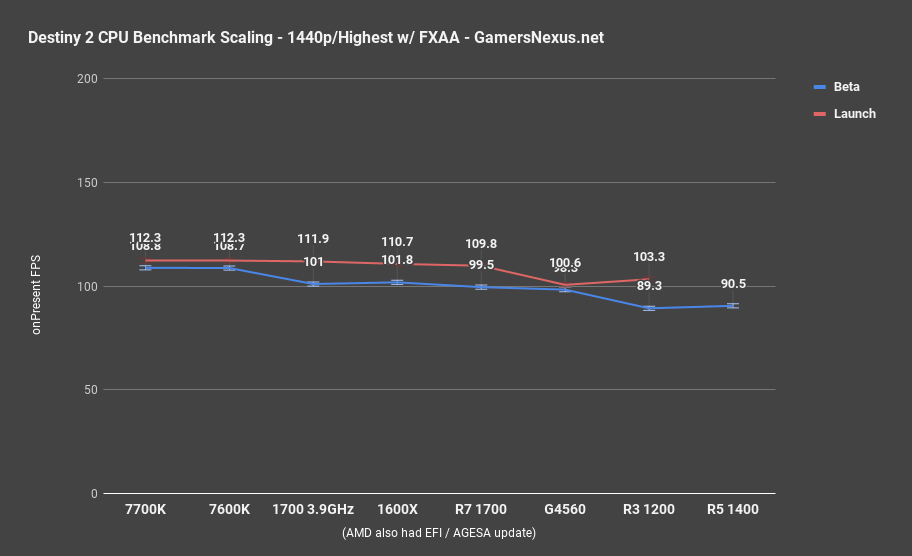
The scalability plot is overall uninteresting and shows the flatline performance, though does illustrate performance uplift on the Ryzen CPUs overall. We think that some of this could be from the more recent EFI and AGESA versions in this testing.
Destiny 2 CPU Benchmark – 1440p, High
Finally, 1440p with High settings removes much of the GPU bottleneck, and restores more progression to the data.
The 7700K is again toward the top with 173FPS AVG, encountering a GPU bottleneck alongside the 8350K and 7600K. This has the 7700K stock CPU leading the R7 1700 stock CPU by 17.7%, or trailing the overclocked 1700 by 4%; of course, we could also overclock the 7700K, but this GPU-constrained scenario wouldn’t change much for the stack.
The G4560 and R3 1200 are again close in performance, following the pack at 128FPS AVG. The 1600X offers functionally the same performance as the 1700 when clock-matched, and would give a means to save money if building specifically for this game – the non-X version, especially.
Conclusion
Performance has certainly upscaled in all aspects of the game versus beta – CPU and GPU alike (see here) – but the CPU side of things is less exciting than the GPU side. With GPUs, we were seeing a range of 19-50% performance uplift for Vega devices (depending on settings used), making clear that most of the gains to be had were on the GPU front.
Some of the uplift since beta is resultant of EFI/AGESA updates for Ryzen, with the rest being game code optimization or bleed-over driver uplift (albeit minimal for the 1080 Ti).
Still, for CPUs, we’ve learned that frequency is the most important factor for Destiny 2. This becomes clear even with the R7 1700, when overclocking to 3.9GHz provides substantial uplift; the findings are further reinforced when looking at other Ryzen products, where we see largely identical performance when clocks are near one another. The 1600X is a good example, as it outperforms the stock 1700: This is a frequency advantage. The game does not care about the extra 2 cores, in this instance, and doesn’t even use SMT. If you were buying a Ryzen platform for Destiny 2, or largely playing Destiny 2 on your AM4 machine, you could basically buy any four-core option and clock it close to 4GHz, then get the same experience across the board. The downside, obviously, is that Destiny 2 isn’t the only application on the market. Keep that in mind.
As for Intel, we see similar behavior there: The 8350K benefits from its high frequency, despite lower thread count versus some other CPUs.
Editorial, Additional Testing: Steve Burke
Testing: Patrick Lathan
Video: Andrew Coleman