For our 2700/2700X review, we wanted to see how Ryzen 2’s volt-frequency performance compared to Ryzen 1. We took our Ryzen 7 2700X and an R7 1700 and clocked them both to 4GHz, and then found the lowest possible voltage that would allow them to survive stress tests in Blender and Prime95. Full results are included in that review, but the most important point was this: the 1700 needed at least 1.425v to maintain stability, while the 2700X required only 1.162v (value reported by HWiNFO, not what was set in BIOS).
This drew our attention, because we already knew that our 2700X could barely manage 4.2GHz at >1.425v. In other words, a 5% increase in frequency from 4 to 4.2GHz required a 22.6% increase in reported voltage.
Frequency in Ryzen 2 has started to behave like GPU Boost 3.0, where temperature, power consumption, and voltage heavily impact boosting behavior when left unmanaged. Our initial experience with Ryzen 2 led us to believe that a volt-frequency curve would look almost exponential, like the one on the screen now. That was our hypothesis. To be clear, we can push frequency higher with reference clock increases to 102 or 103MHz and can then sustain 4.2GHz at lower voltages, or even 4.25GHz and up, but that’s not our goal. Our goal is to plot a volt-frequency curve with just multiplier and voltage modifications. We typically run out of thermal headroom before we run out of safe voltage headroom, but if voltage increases exponentially, that will quickly become a problem.
AMD Ryzen 2 Voltage Curve Theory
That kind of change suggests an exponential increase, and we wanted to know more. We decided to measure and plot the volt-frequency curves of both chips with frequency on the X axis and minimum stable voltage on the Y axis. At increasing frequencies, the required voltage for both chips rapidly increases out of a safe range, and the vertical difference between the lines on our theoretical graph at a given frequency becomes huge (1.425v versus 1.162v at 4GHz). However, at a given voltage the horizontal difference remains tiny (4GHz vs 4.2GHz at 1.43-ish volts). Based on this knowledge, this was what we expected to see:
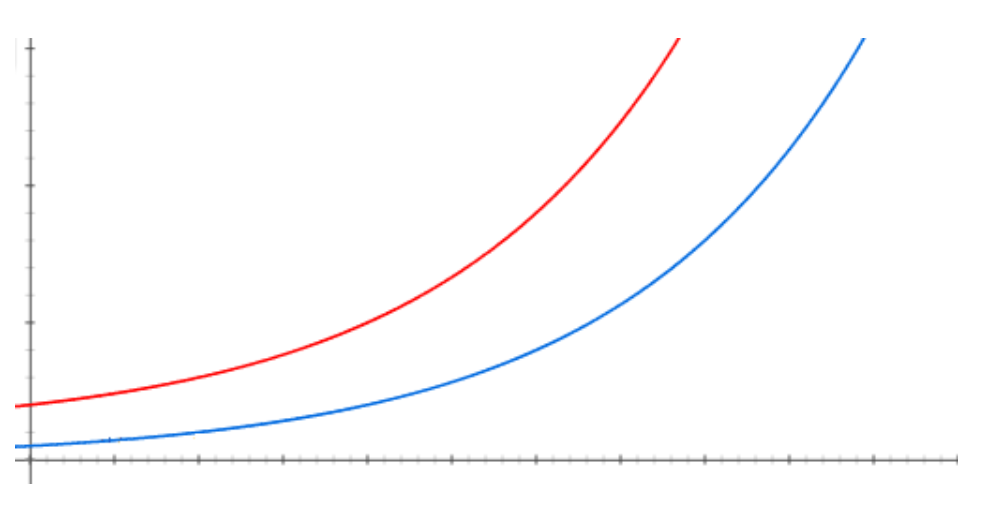
This is just an example, graph does not represent any data
Methodology
Our previous test used both Prime and Blender, but in the interest of efficiency in these tests we tested stability by running our most stressful Blender benchmark for about ten minutes. That’s not enough time to guarantee stability for a daily-use OC, but it’s generally enough time to ensure that a CPU will pass our usual battery of synthetic tests, which is good enough to plot a curve. Not every CPU is the same, and our exact numbers don’t apply to every 1700 and 2700X.
Test Platform (Sponsored by Corsair)
| Component | Part | Courtesy of |
Motherboard | Gigabyte X470 Gaming 7 | GN’s side channels |
CPU | This is what we’re testing | - |
Memory | Corsair Vengeance LPX 3200 16-18-18-36 | Corsair |
Cooler | NZXT Kraken X62 | NZXT |
Power Supply | Corsair AX1600i | Corsair |
Video Card | EVGA GTX 1080 Ti FTW3 | EVGA
|
BIOS settings and hardware were kept the same other than CPU, vcore, and all-core multiplier, which were the variables being tested. The >4.1GHz tests on the 2700X were done using a Thermaltake 360mm CLC rather than the usual 280mm Kraken X62. These are marked with an asterisk in the charts and with a dotted line on the graph, and aren’t closely comparable to the other results.
This wasn’t a test of how high the 2700X can be overclocked. Ours can do 4.2GHz fairly easily by maxing LLC or adjusting BCLK, but that wasn’t the point here. All-core overclocking the 2700X (without LN2) is pretty pointless in terms of performance anyway--check our review for details.
AMD R7 1700 Overclocking Volt-Frequency Curve
We’ll begin with just a results table for the R7 1700. At the low-end, we were able to maintain a minimum stable voltage of 1.069V for 3.5GHz all-core, producing a Tdie of 49 degrees Celsius at 7A at the EPS12V rails, equating 86W of power draw. Increasing by 100MHz, to 3.6GHz, required an additional 0.0375V and increased temperature by a few degrees, with power draw increased by 7W. The next 100MHz jump required 0.044V, with another 100MHz on top of that, going to 3.8GHz now, requiring 0.062V. It’s becoming clear how this is a non-linear voltage requirement. 3.9GHz required an additional 0.075V on top of the 1.212V we had previously, putting us at 1.287V. We’re also now at 64.6 degrees Celsius and 144W of power consumption. Our final step to 4.0GHz required 0.119V on top of the previous jump, putting us at a total of 0.337V over our initial 3.5GHz requirement of 1.069V.
Frequency GHz | BIOS VCore | HWINFO VCore SVI2 TFN | Motherboard VCore | Tdie @ 10 mins | Ambient @ 10 mins | Current Clamp Amperage | CPU Core Current SV12 TFN |
3.5 | 1.075 | 1.069 | 1.057 | 49 | 28.9 | 7 | 52-54 |
3.6 | 1.1125 | 1.106 | 1.09 | 52 | 28.8 | 7.6 | 56-59 |
3.7 | 1.1625 | 1.15 | 1.145 | 55 | 28.8 | 8.5 | 61-65 |
3.8 | 1.225 | 1.212 | 1.199 | 56.5 | 27.3 | 9.8 | 72-74 |
3.9 | 1.3 | 1.287 | 1.275 | 64.6 | 27.6 | 11.7 | 81-84 |
4 | 1.425 | 1.406 | 1.395 | 76.5 | 27.7 | 15.2 | 101-104 |
We already knew our 1700 would do 4GHz at a bit over 1.4v, but below 4GHz it was surprisingly efficient. 3.9GHz is still a decent boost over stock for the 1700.
AMD R7 2700X Overclocking Volt-Frequency Curve
Frequency GHz | BIOS VCore | HWINFO VCore SVI2 TFN | Motherboard VCore | Tdie @ 10 mins | Ambient @ 10 mins | Current Clamp Amperage | CPU Core Current SV12 TFN |
3.5 | 0.9125 | 0.906 | 0.894 | 39.8 | 26.6 | 5.6 | 43-44 |
3.6 | 0.9625 | 0.956 | 0.937 | 44.8 | 28.6 | 6.2 | 48-49 |
3.7 | 1 | 0.994 | 0.981 | 46.5 | 28.6 | 7 | 52-55 |
3.8 | 1.04375 | 1.031 | 1.025 | 47.5 | 26.9 | 7.8 | 58-61 |
3.9 | 1.09375 | 1.081 | 1.068 | 50 | 27.1 | 8.8 | 65-68 |
4 | 1.175 | 1.162 | 1.145 | 57.8 | 25.4 | 10.5 | 78 |
4.1 | 1.2625 | 1.244 | 1.232 | 67.6 | 29.4 | 12.9 | 91-94 |
4.15* | 1.3* | 1.281 | 1.275 | 65 | 25.5 | 13.8 | 95-99 |
4.175* | 1.375* | 1.356 | 1.341 | 78 | 28.3 | 16.2 | 111-113 |
4.2* | 1.4* | 1.381 | 1.363 | 74.9 | 25.7 | 16.8 | 114-116 |
*Switched to a larger cooler to surpass 4.1GHz, results not directly comparable
At 3.5GHz (our arbitrarily-chosen baseline), the 2700X needed less than 1 volt to stay stable in Blender. At the high end, it needed much more, to the extent that at 4.1GHz the Tdie measurement was nearing 70C (and the room was getting very warm). Further increases in frequency/voltage raised Tdie past 80C and weren’t stable, probably due in part to the high temperature. We knew our 2700X was capable of more, so we pushed past 4.1GHz using a larger cooler and lower ambient temperatures. We included these numbers to show just how much cooling can affect the stability of short-term OC tests, but they shouldn’t be compared to the others.
At 3.5GHz, the 2700X needed just 0.9V to hold stable, a significant reduction even from the R7 1700. The 2700X required an increase in voltage to 0.956 to sustain 3.6GHz, or a jump up of 0.05V and so on, until we hit 4.0 GHz at 1.162V, which then required a jump of 0.08V to climb to 4.1GHz. We switched to a larger cooler at this point, as we were hitting 70 degrees and up on Tdie, which was causing instability and crashes in our Blender test. This means the data isn’t perfectly comparable, and so is represented by a dotted line. You can see that the curve gets incredibly steep at 4.2GHz, where we had to increase from 1.24 to 1.38V to hold stability with the larger cooler. Note that we could achieve this with lower voltage if tuning BCLK instead, but that’s one of our controls.
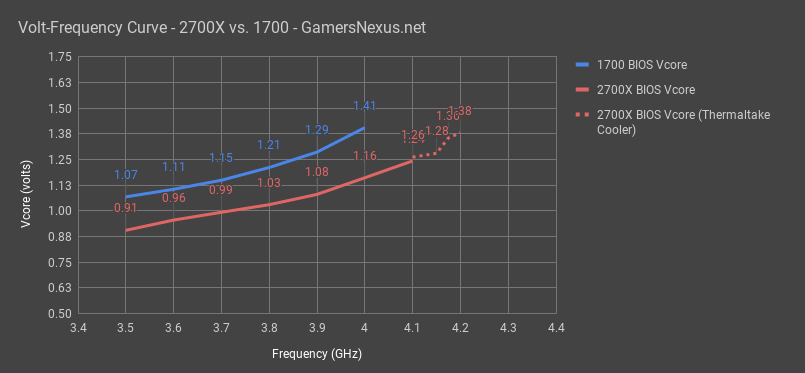
Ignoring the extra-well-cooled results for the 2700X, the plotted curves are almost what we predicted, albeit less dramatic within the limited bounds of our test. We can’t get into the territory of really vertical increases because we’re limited by temperature. Der8auer included a graph in his 6000MHz 2700X OC video of voltages and frequencies he achieved without LN2. Reformatted to match our graphs, his data looks like this:
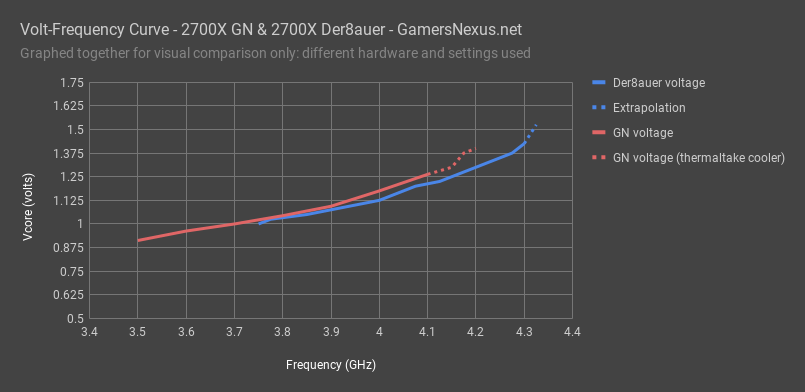
His voltages are lower because, among other reasons, he was using a higher level of LLC, but the shape of the curve is close to our own, right down to the sharp increase in required voltage at the end: he went as high as 1.5v without surpassing 4.3GHz. He was testing in increments of .025v and .025GHz, so we can extrapolate a best-case scenario of achieving 4.325GHz at 1.525v.
AMD R7 2700X Volt-Frequency Curve Conclusion
This was an academic experiment. Again, we could push higher frequencies with lower voltages if we were to tune, say, the reference clock. The point is to control variables as much as possible, then just research V-F scaling between the R7 1700 and R7 2700X.
As stated in our review, the Ryzen 2 processors primarily shine in lower voltage requirements at a given frequency, which is doubly illustrated here, against the 1700. Both CPUs do have somewhat non-linear, pseudo-exponential curves as frequency increases. This also happens with Intel, mind you, but that’s well-documented. The Ryzen CPUs are still relatively new. Without BCLK and other tuning, we hit a wall at 4.2GHz and can’t push voltage high enough to stabilize >4.2GHz (multiplier only). We could with exotic cooling, probably, but temperature begins to dictate boosting functionality -- just like modern GPUs.
The more interesting point is that our 2700X can hold its base frequency of 3.7GHz on all cores at 1.0v, while our 1700 needs at least 1.1625V for the same clock speed.
Editorial, Testing: Patrick Lathan
Host, Editorial: Steve Burke
Video: Andrew Coleman