AMD R7 2700 & 2700X Review: Streaming Benchmarks, Memory Scaling, & Volt-Frequency Performance
Posted on
Reviewing the AMD R7 2700X was done outside of normal review provisions, as AMD didn’t sample us. We’ve had the parts for a month now, and that has meant following development, EFI updates, and more as they’ve been pushed. We have multiple chips of every variety, and have been able to cross-validate as the pre-launch cycle has iterated. Because of the density of data, we’re splitting our content into multiple videos and articles.
Today’s focus will be the AMD R7 2700X and R7 2700 reviews, especially for live streaming performance versus the i7-8700K, gaming performance, and production (Blender) performance. Most importantly, however, we dedicate time to talk about the significant improvements that AMD has made in the volt-frequency department. At a given frequency, e.g. 4.0GHz, Ryzen 2000 operates at a heavily reduced voltage versus Ryzen 1. We’ll dig into this further in this review, but check back later for our R5 2600X and 2600 reviews (combined in one piece), including 2600X vs. 8600K streaming benchmarks. We’re also looking at VRM thermals, motherboard PCBs and their VRM quality, memory overclocking and scalability (in this content), and more.
There is a lot of confusion about AMD’s branding – Zen 2 vs. Ryzen 2 vs. Zen+. We’re calling these CPUs “Ryzen 2,” because they’re literally called “Ryzen 2X00” CPUs. This is not the same as the Zen 2 architecture, which is not out yet.
Note: For overclocking, we only OC one CPU of each core count – so just the R7 2700X or R7 2700, but beyond validation of maximum frequency, there’s no need to OC both and run each through 20 hours of testing.
Test Platform (Sponsored by Corsair)
Motherboard | Gigabyte X470 Gaming 7 | GN’s side channels |
CPU | This is what we’re testing | - |
Memory | Corsair Vengeance LPX 3200 16-18-18-36 | Corsair |
Cooler | NZXT Kraken X62 | NZXT |
Power Supply | Corsair AX1600i | Corsair |
Video Card | EVGA GTX 1080 Ti FTW3 | EVGA |
For AMD, we primarily tested on these platforms:
- Gigabyte X470 Gaming 7, EFI revision F4B
- ASUS Crosshair VII, EFI revision 0505
- ASUS Crosshair VI, EFI revision 6008
Note that our initial Gigabyte X470 BIOS revision did not support disablement or tuning of XFR2. We ended up scrapping initial (internal) test data and replacing it once we received more consumer-ready BIOS revisions.
Wherever “X370” is mentioned, that’s the Crosshair VI. When X470 is mentioned, in gaming and production benchmarks, that’s the Gigabyte X470 Gaming 7. For overclocking, memory scaling, and game streaming tests, that’d be the ASUS Crosshair VII motherboard.
For Intel, we’re primarily using the ASUS Maximus X motherboard. Synthetic and Blender results, along with power results, are using the Gigabyte Ultra Gaming. We tested with the latest BIOS and with new Windows versions.
Ryzen 2 Minimum Stable Voltage to Hold a Frequency
Our review begins by discussing the most immediate improvement in the new Ryzen CPUs, which is the lowest stable voltage at a given frequency. The frequency curve for Ryzen is somewhat exponential, in that a 4.2GHz clock might take 1.38V to 1.4V to sustain, but a 4.3GHz clock takes beyond acceptable safe voltages in our testing.
Blender V-F | R7 2700X vs. 1700 | ||
EFI Input VCore | 1.175V (LLC lvl 4) 2700X | 1.425 (LLC lvl 5) 1700 |
HWINFO VCore SV12 TFN | 1.162v | 1.425v |
Motherboard VCore | 1.145v | 1.406v |
Tdie at 15 minutes | 57.8*C | 79.4*C |
Current Clamp Amperage | 10.5A | 16.3A |
Clamp Calculated Wattage | 129.15 | 200.49 |
CPU Core Current SV12 TFN | 78A | 101-108A |
Ambient @ 15 mins | 25.4*C | 27.8*C |
To this end, we found that, at a given frequency of 4.0GHz, our R7 2700X held stable at 1.175V input at LLC level 4, which equated to 1.162V VCore at SVI2 TFN. The result was stability in Blender and Prime95 with torturous FFTs, while measuring at about 129W power consumption in Blender. For this same test, our 1700 at 4.0GHz required a 1.425V input at LLC level 5, yielding a 1.425VCore, a 201W power draw – so 70W higher – and pushed thermals to 79 degrees Tdie. That’s up from 57.8 degrees Tdie at the same ambient.
P95 29.4b 8x8FFT V-F | R7 2700X vs. 1700 | ||
EFI Input VCore | 1.175V (LLC lvl 4) 2700X | 1.425 (LLC lvl 4) 1700 |
HWINFO VCore SV12 TFN | 1.162v | 1.406v |
Motherboard VCore | 1.145v | 1.395v |
Tdie at 15 minutes | 60.6*C | 74.8*C |
Current Clamp Amperage | 11.4A | 14.4A |
Clamp Calculated Wattage | 140.22 | 177.12 |
CPU Core Current SV12 TFN | 80-84A | 96-99A |
Ambient @ 15 mins | 25.9*C | 27.1*C |
Prime95 produced similar results, but you can find those in the article below.
Lower voltage for a given frequency also means lower power consumption for the same frequency. To some extent, this is binning – but most of that large delta is from improvement of the product’s clock efficiency at the “old” high clocks of 4.0GHz. To get to 4.2GHz and beyond, granted, does take over 1.42V on our chip. It’s a significant, nearly exponential curve to increase frequency by a couple hundred megahertz. We found 4.3 to be impossible to sustain on 3 of our CPUs that we’ve tested.
AMD Ryzen 2 (R7 2700X) Memory Overclocking
Memory overclocking hasn’t changed much with Ryzen+ and the X470 platforms. Initial reports suggested that 4000MHz would be achievable and somewhat standard on X470, including some off-record statements we received many months ago, but that’s not the case. Memory overclocking has hardly changed.
We found that both of our platforms were capable of handling 3600MHz XMP for our GSkill Trident Z kit on cold boot. Versus Ryzen’s launch, this is an incredible improvement; versus a month ago, it’s really not any different. Overclocking to 3666MHz, not that this is much of an OC, was also possible – but it required training. We could cold boot 3600, but we had to train to 3666MHz. Anything beyond that was unachievable on our board, CPU, and memory. Note that our memory was the kit used to take a top 5 world record recently, so we know it hits at least 4000MHz.
As for memory scalability, we did some testing on that as well:
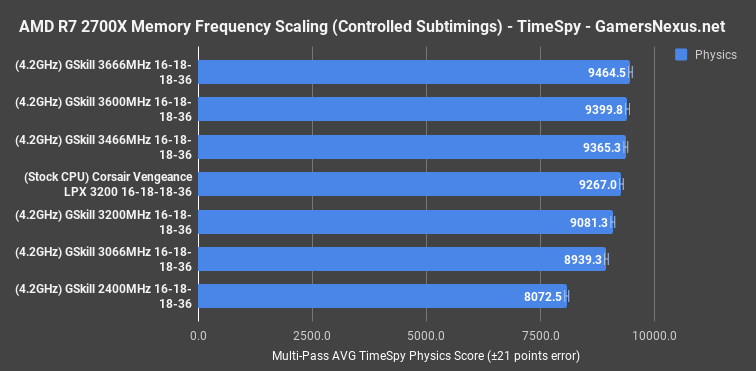
This test was conducted with completely controlled memory timings, meaning we controlled every single timing presented in UEFI. That includes subtimings and tertiary timings.
When you control timings 100% and change only the memory frequency, plus whatever unpresented timings are being modified, the result for TimeSpy is what you see on the screen now. TimeSpy is highly memory sensitive, and we end up with 3666MHz plotting 9465 points, an uplift of 0.6% over 3600MHz, which is 0.4% over 3466MHz. You get the idea. There is absolutely scaling here, but it’s incremental. At 3600MHz versus 3200MHz, we observed a 3.5% difference. Given the price difference in some regions, you may as well stick with 3200MHz.
The difference between 3200MHz and 2400MHz is tremendous, though, marked at 12.5%. That’s with TimeSpy, which is memory sensitive.
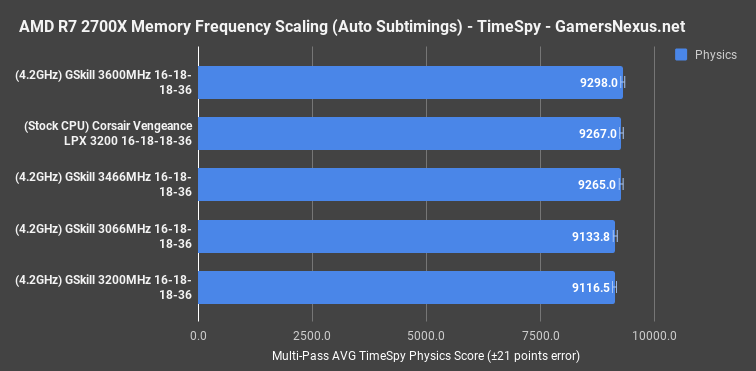
Here’s where it gets interesting: With the Crosshair VII Hero, tuning the frequency down will result in an automatic tightening of subtimings, which results in increased performance overall. If you were to manually enforce 16-18-18-36 timings and allow all other timings to be auto, which most users do, and then set the memory frequency, you’d end up with this chart.
The result is much tighter. We suddenly have a range of a couple hundred points, rather than 1400 points. Instead of 8070 to 9465, we’re at 9100 to 9300. That’s because the timings automatically tighten to a point of improving beyond the frequency improvement.
Basically, if you are really serious about performance, you’ve got a lot of work to do on auto-tuning timings. ASUS does an exceptional job at this automatically on their Crosshair VII Hero, and this is where you see the value of good motherboards emerge. This also illustrates how testing can be completely invalidated if you don’t pay close attention to those lower-level, buried timings, but more importantly, it shows that buying 3200MHz kits with tighter timings can perform every bit as well as higher frequencies and looser timings. That said, it’s best to go faster and with tighter timings, and not everything responds the same as TimeSpy did.
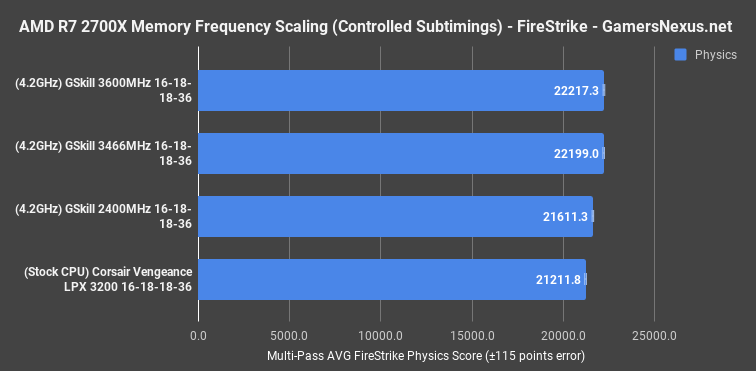
Here’s an example. In Firestrike, which doesn’t use the same API as TimeSpy, we observed nearly 0 scaling between memory frequencies, even when controlled for timings.
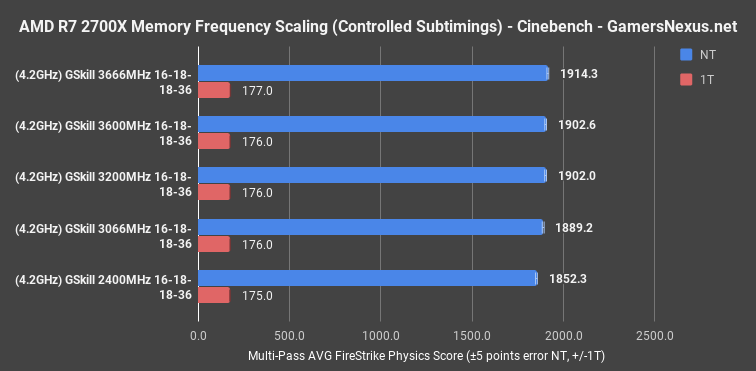
Cinebench also demonstrated nearly zero scaling difference; at least, not until 2400MHz.
Continue to Page 2 for AMD R7 2700X vs. i7-8700K game streaming.
AMD R7 2700X vs. i7-8700K Streaming Benchmarks
Game streaming is tested on Gigabit Fiber internet, with active monitoring for packet loss or network-side errors (there were none). We use OBS v. 21.1 for livestreaming, and configure 1080p/60 for the stream output. Encoding is set to H264 with Faster settings, used for what we consider to be a high-quality stream at 10Mbps. We also test with 12Mbps at Medium encode settings, meant to serve as a torture test for when differences fail to emerge at more reasonable 10Mbps/Faster settings. Streaming requires both a quality streamer-side framerate and quality viewer-side delivery. It is impossible to deliver greater than the specified framerate of 60FPS to the viewer and playback service (Twitch, YouTube), and so a “perfect” score would be 100% frame delivery within 16.67ms per frame.
We actively log framerate performance for five minutes in DotA2 and DiRT Rally, with Playerunknown’s Battlegrounds (PUBG) logged for ten minutes. Multiple passes are conducted. We store all final MP4 clips locally and analyze them for further data validation and to calculate dropframes. YouTube plays back the livestream on the same host system, which increases load further and creates a real streaming experience.
We also log “baseline” performance metrics; that is, performance without any active livestream. The goal is to determine performance scaling and loss from baseline when adding a stream, which aids in determining the efficiency of a particular processor at juggling a game and a stream simultaneously. This also helps us understand scheduling.
A lot can be done to further tune and improve player and viewer experience with streaming, like process priority tuning and affinity tuning, which we’ve previously demonstrated as helpful with Intel scheduling.
PUBG R7 2700X Streaming Benchmark vs. i7-8700K
NOTE: This section relies heavily upon references to video playback to better illustrate streamed quality and output. Please refer to the video (first page) for this playback.
Let’s move into game streaming benchmarks next. In the video, we open by showing PUBG at 10Mbps and Faster on each side of the screen. One is the 2700X, one is the 8700K, neither is overclocked. Our baseline test for a good quality stream is 10Mbps upload with H264 Faster enabled. If all CPUs pass that, we stress test them with X264 Medium and 12Mbps uploads. Our goal is to upload 100% of the frames to the stream and drop 0, ideally all near 16.7ms delivery times. We also want to lose as little FPS from baseline non-streaming gameplay as possible; in other words, we care about the scaling of how each CPU handles streaming. Our goal is efficiency in delivering a 60FPS stream, which would be considered perfect without dropframes, while also maintaining a high player-side FPS.
Streamer-Side FPS in PUBG (2700X vs. 8700K)
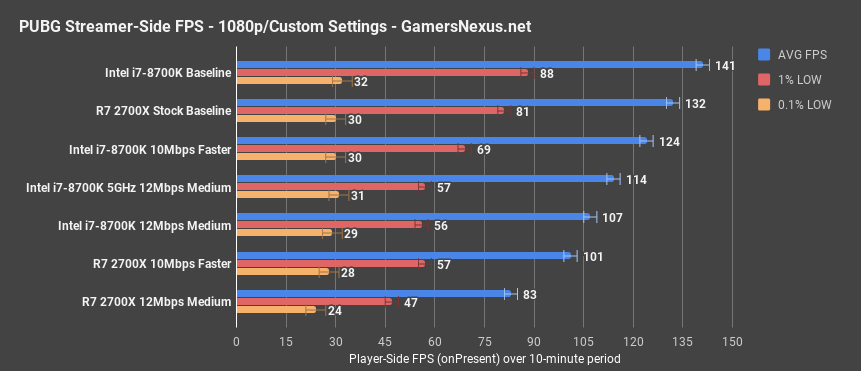
We’re starting with PUBG and with streamer-side FPS, so this is what the streamer would see, not what the viewer would see. Both are important parts of the equation.
For the streamer, we’re observing a baseline FPS of 132 AVG for the R7 2700X when stock, which decays to 101FPS AVG when streaming at 10Mbps Faster. The 1% lows also dip relatively proportionately, to 57FPS. At 12Mbps and stressed with a rather unrealistic Medium encode speed, but used as a synthetic test, we fall to a still fully-playable 83FPS AVG and 47FPS 1% lows.
The 8700K’s baseline is hitting framerate cap, and averages at 141FPS. It’d be higher without that ceiling. We’re at comparable low values to the 2700X. Streaming at 10Mbps Faster brings us to 124FPS, or 107FPS for Medium.
As for which was which, we can pop-up the labels now for the 8700K and 2700X from that earlier footage (see video). Technically, the 8700K is in the lead for streamer-side performance, but that’s only half of the equation.
Viewer-Side Performance in PUBG (Ryzen vs. Intel for Streaming)
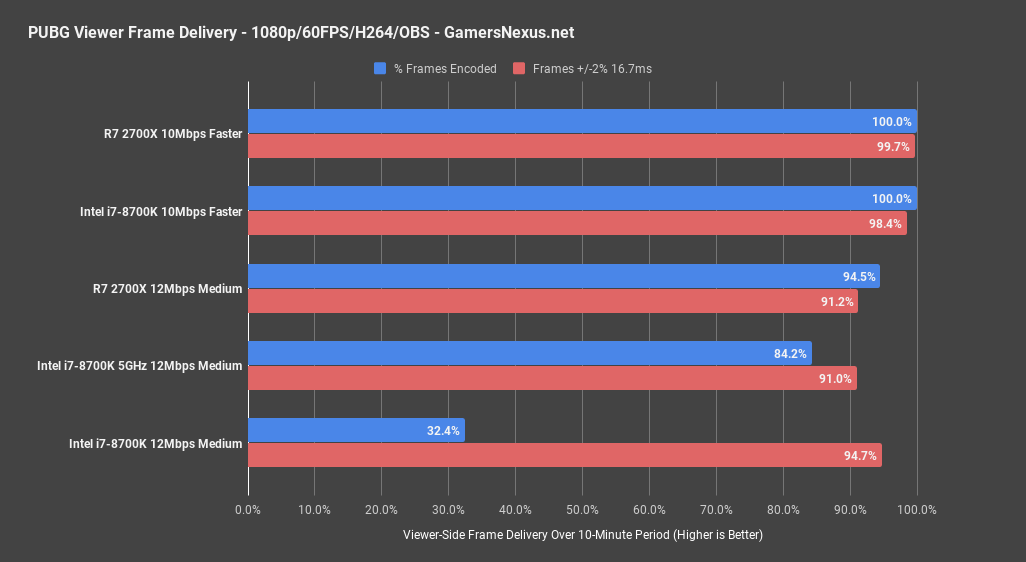
For the viewer-side, things change a lot – and quickly. First off, both the 8700K and 2700X stock CPUs deliver 100% of frames to the stream at our 10Mbps Faster preset, with 98% to 99.7% of frames delivered within our 16.7ms target. This is excellent performance for each CPU, and either is fully capable of gameplay while streaming.
Notice, however, that the 8700K crumbles when pressed with H264 Medium and 12Mbps encoding. We end up at 32.4% of all frames delivered, meaning that the stream drops 70% of frames. We’ll show those videos side-by-side now (see video). We overclocked the 8700K to see if performance could meet the stock 2700X, and found that it still under-delivered at 84.2% of all frames. This disparity is partially a result of the 2 fewer cores, and partially a result of scheduling. More resources were spent on the game than OBS. This can be rectified with manual affinity and priority tuning for OBS, but it’s extra work for the streamer.
Streamer-Side Performance in DotA2
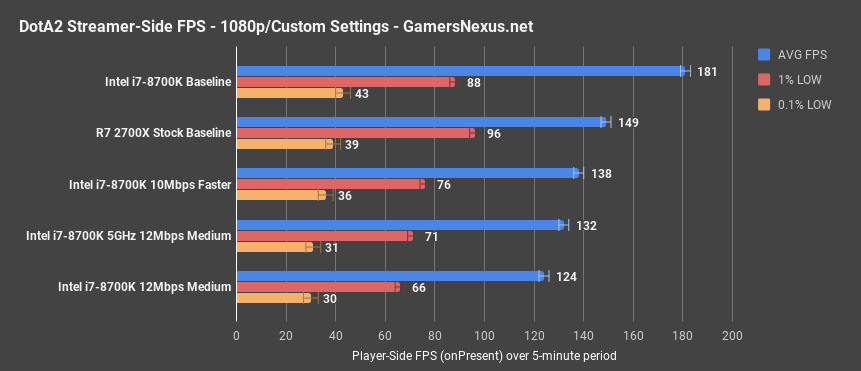
Here’s the player-side performance for DOTA2. In terms of raw FPS, the 8700K easily chart-topped, as Intel often does in DOTA2. This game is heavily dependent on 1-2 threads, and that’s why we see the frequency advantage. We’re at 181FPS AVG versus 149FGPS AVG, with lows reasonably comparable and within DOTA’s variance.
At 10Mbps, those numbers are 138FPS AVG and 108FPS AVG. 12Mbps and Medium puts a huge strain on each CPU versus baseline, producing large losses as resources reallocate to the stream.
Viewer-Side Performance in DotA2
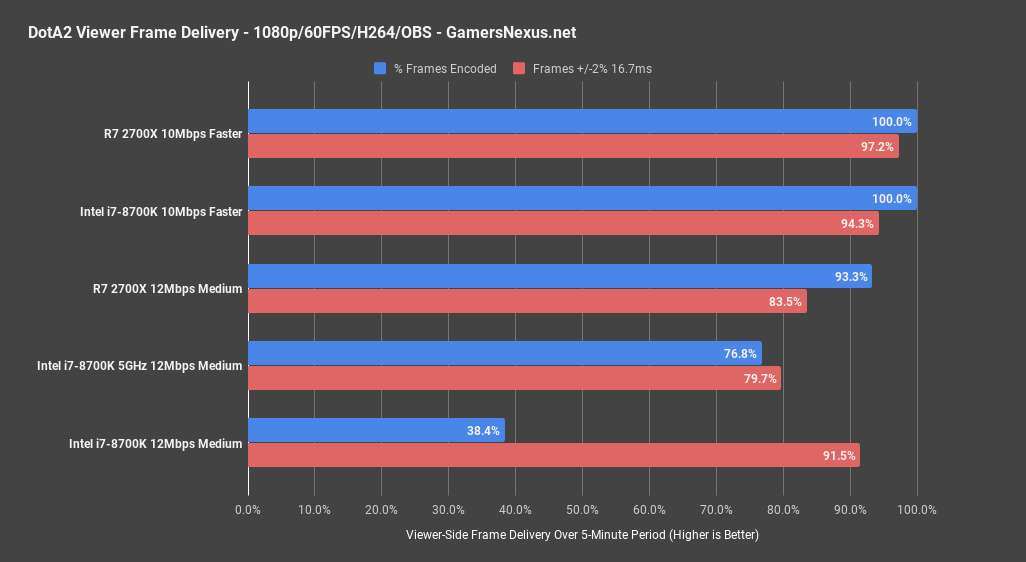
Here are the streaming results: At the good quality setting, we’re at 100% of frames encoded on both the 8700K and 2700X, with frametime consistency both good. At 12Mbps, we lose 60% of our frame delivery on the stock 8700K, and about 7% of our delivery on the 2700X. Here’s a comparison of the 12Mbps playback on both Intel and Ryzen, put next to each other. This is, again, a thread and scheduling advantage. Ryzen has more threads to throw at encoding in the Medium configuration, which matters far more than the frequency for this task; where AMD is behind in FPS streamer-side, it is far ahead in viewable stream quality. Intel is killing AMD in raw framerate streamer-side, but getting killed in viewer-side playback. In this workload, the viewer-side playback matters most. Overclocking Intel helped tremendously, but not enough to come close to the 2700X. Again, tuning with priority and affinity would largely rectify this, but that’s asking for a lot of extra work. You could also cap game framerate to further relieve Intel’s resources, but the point is that the 2700X is natively more advantaged than Intel here. We didn’t need to overclock the 2700X to sustain reasonable quality.
Blender Benchmark – AMD R7 2700X vs. 1700X, 8700K
For some production benchmarking, we’re using Blender 2.78 and 2.79 for in-house render benchmarks. The newer Blender 2.79 GN Monkey Head render places the R7 2700X towards the top of our charts, requiring 23 minutes to render when stock, using X370, and basically the same amount of time when using X470 and stock settings. Running 4.2GHz all-core doesn’t get us much, considering how XFR2 works, and pushes us to 22 minutes. Again, consider that this is functionally pre-overclocked, hence the limited difference between manual overclocks.
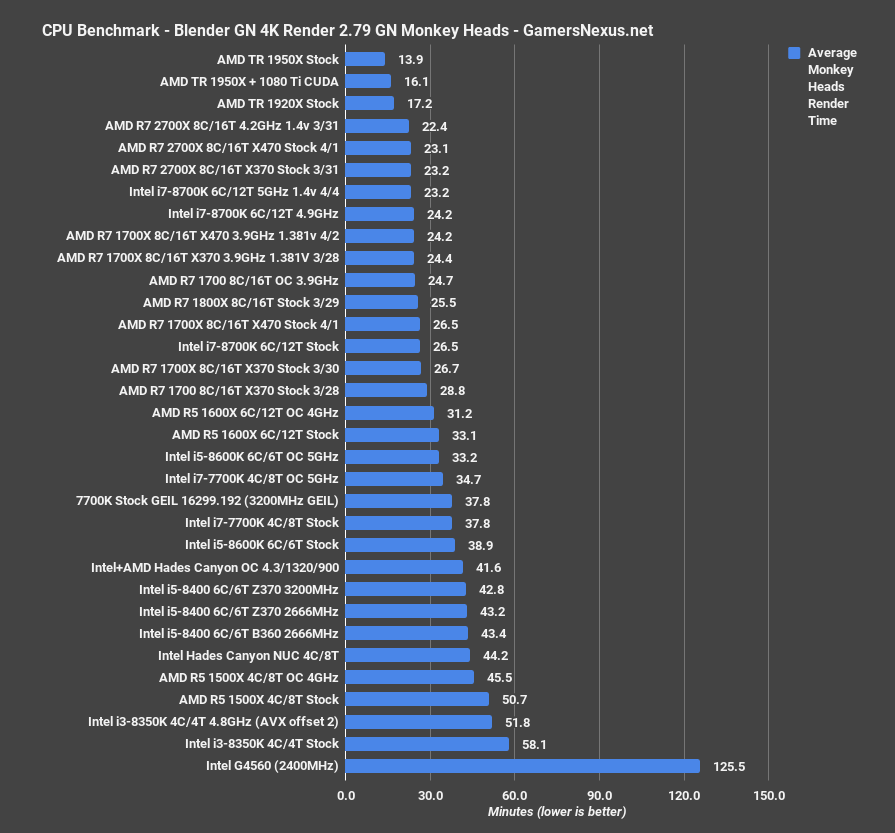
For comparison, the Threadripper 1920X stock CPU completed its render in 17 minutes, about a 25% time reduction. The i7-8700K at 4.9GHz finishes its render in 24 minutes, marking the stock 2700X as 4% reduced in time. Going to 5.0GHz mostly ties the two, with an overclock on the 2700X pulling it again about a minute ahead. When overclocked, the 8700K is functionally equal in performance. Stock, however, the 8700K ends up at 26.5 minutes, allowing the 2700X stock to reduce its time requirement by 12.5%.
The 2700X stock CPU is also approximately 13.5% reduced in time requirement from the stock, original 1700X that we retested on the X470 board.
![]()
Our GN logo render test is the most abusive, and stressed the 2700X overclock to a point that we could not achieve stability at 4.2GHz, and it wasn’t worth going to 4.1GHz, since that’d result in equivalent or worse performance than stock with XFR2.
For this one, the 1920X leads the 2700X stock CPU on X470 by 28% time reduction, a substantial change for anyone serious about CPU rendering. The 8700K overclocked at 5GHz lands at 28.6 minutes, allowing the 2700X a 2% time reduction over the high-end Intel CPU. Of course, note that we don’t have any Intel HEDT parts on here presently, as those have all been busy with RIPLTT streams and other ongoing content.
Continue to the next page for gaming benchmarks on Ryzen 2.
Assassin’s Creed: Origins – AMD R7 2700X vs. 2700, 1700, 8700K
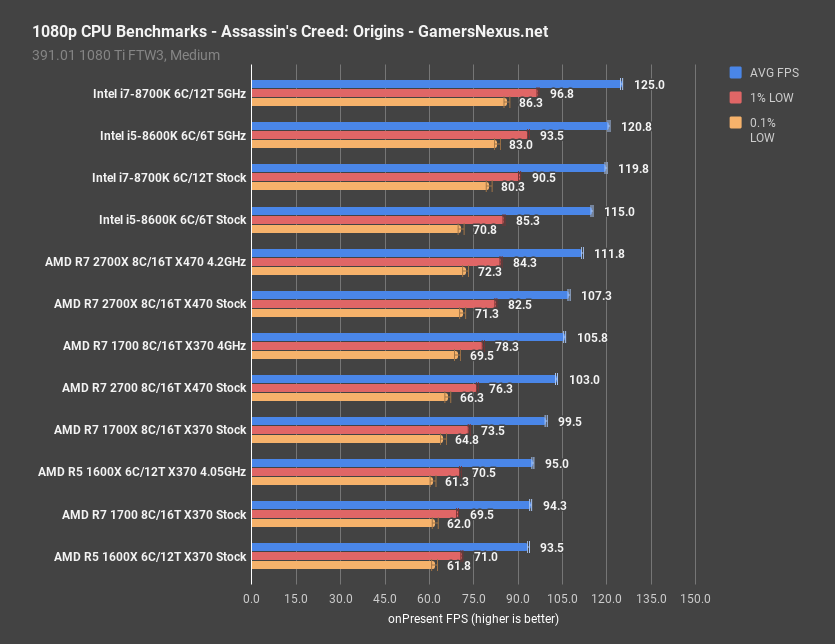
We test Assassin’s Creed: Origins at 1080p/medium and 1440p/medium. We test in CPU-intensive parts of the game and have specifically tuned our benchmark to minimize GPU bottlenecking.
Assassin’s Creed: Origins is new to our test bench. For this one, the AMD R7 2700X stock CPU performs at 107FPS AVG with X470, or 112FPS AVG when overclocked to 4.2GHz. Lows are reasonably tight, in the 80s for 1% and 70s for 0.1%. We want consistency of frametimes, and we get that here. The stock R7 2700 performs at about 103FPS AVG, marking the stock 2700X as 4.2% ahead at 107FPS AVG. The R7 2700X performs about 7.5% ahead of the R7 1700X stock CPU on X370. Overclocking the R7 1700 to 4GHz gets it to 106FPS AVG, with lows reasonably behind. This places it just below the stock 2700X, with the overclocked 2700X about 5.7% ahead.
The 8700K stock CPU operates at 120FPS AVG, with lows at 91FPS and 80FPS, thus landing the 8700K about 11.6% ahead of the stock 2700X. The i5-8600K is also a bit ahead, including rough equivalency in frametime pacing and consistency of the lows. Overclocking the 8700K pushes our GPU limits and hits a bottleneck, landing at 125FPS AVG, or about 12% ahead of the overclocked 2700X.
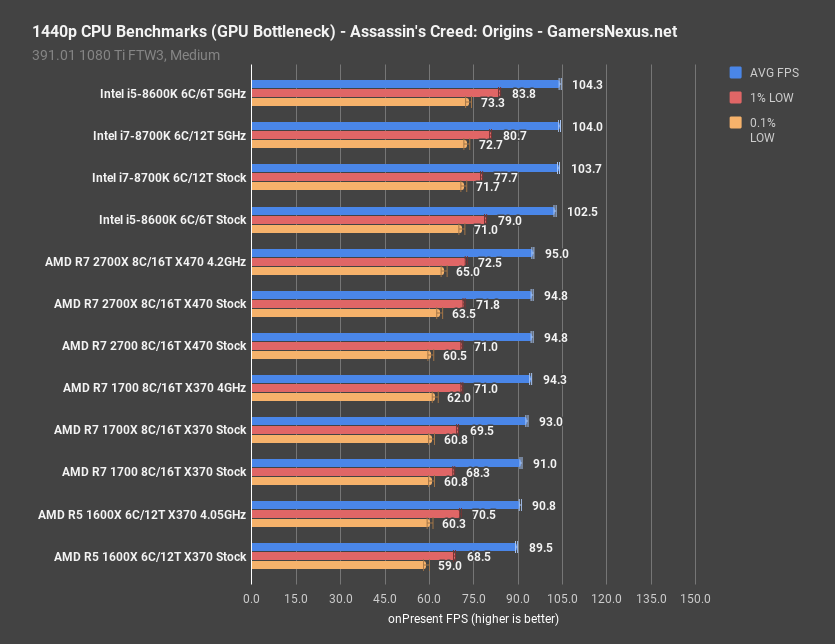
For comparison, here’s Assassin’s Creed at 1440p. Most of the differences vanish here, thanks to the creation of a hard GPU bottleneck that prohibits further scaling on the CPU. Still, the Intel CPUs hold a bit of a lead, averaging about 10FPS, or around 10% of a lead.
Watch Dogs 2 Benchmark – AMD R7 2700X
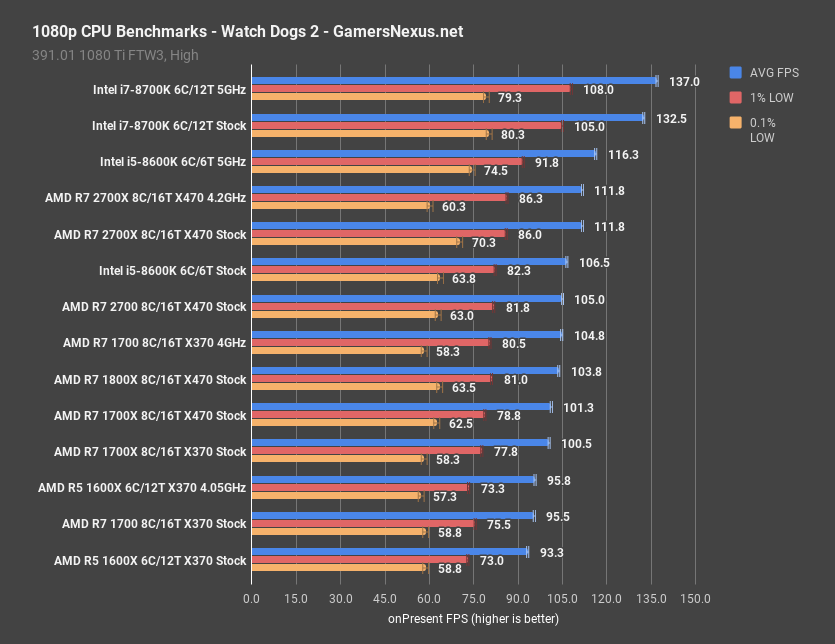
Watch Dogs 2 at 1080p is next. For this one, the 2700X stock CPU and overclocked 2700X performed equivalently with thanks to XFR2’s frequency boosting. The 2700X stock CPU ends up 6.5% ahead of the stock 2700, but keep in mind that overclocking the 2700 nets the same performance. The 2700X at 111.8FPS also ends up about 10.4% ahead of the stock 1700X, although overclocking the original R7 CPUs closes that gap partially, as indicated with the R7 1700 at 4GHz.
The 8700K stock CPU at 132.5FPS maintains a lead of 18.5% over the 2700X stock CPU, at 111.8FPS AVG. The lows are also advantaged somewhat significantly on the 8700K, marking its overall frametime consistency as superior in this test. Overclocking gives us some extra performance, but not much.
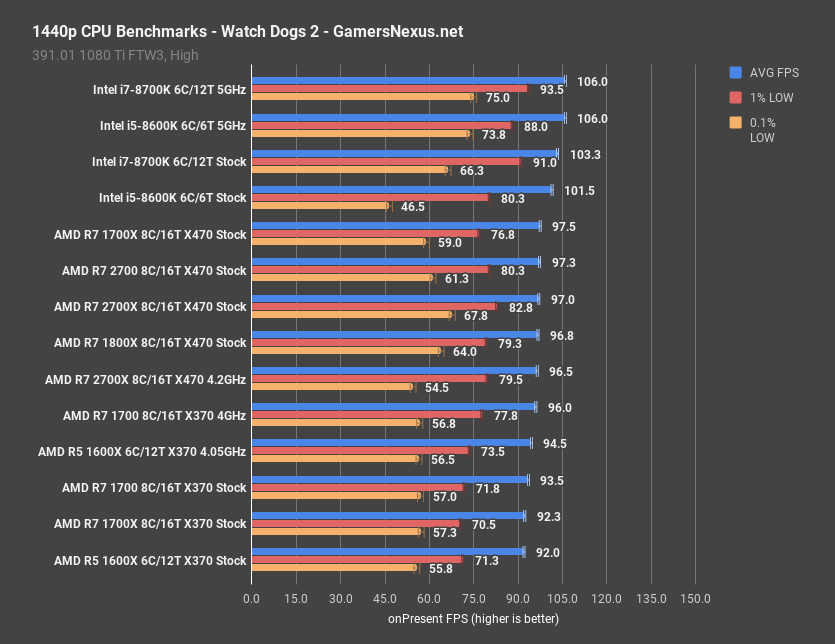
At 1440p, we observe similar performance to what we saw in Assassin’s Creed: Origins. Our numbers plot the AMD CPUs as limited to about 92 to 98FPS AVG, with the Intel CPUs limited to about 102-106FPS AVG.
Project Cars 2 – AMD R7 2700X vs. i7-8700K Overclocked
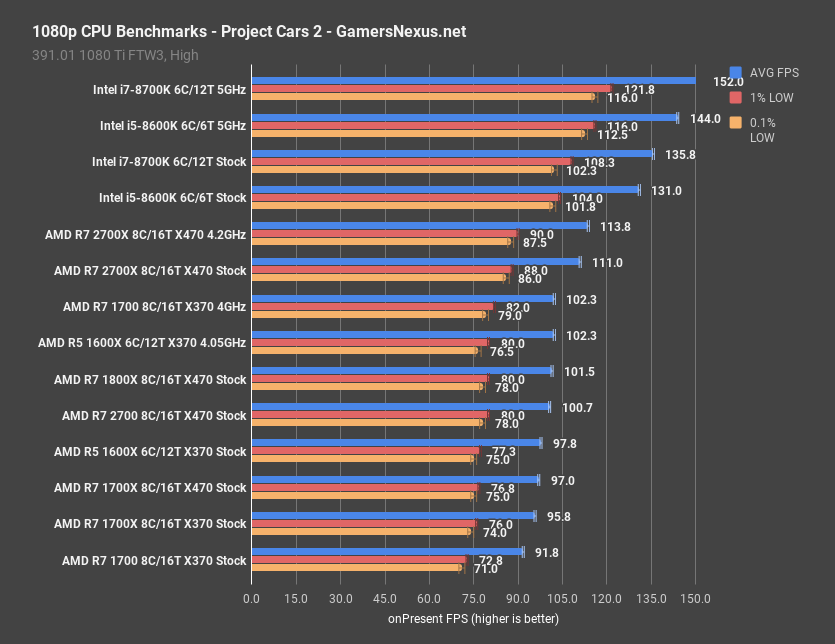
Project Cars at 1080p posts the R7 2700X stock CPU at 111FPS AVG, with overclocking boosting to 114FPS AVG. This lands the 2700X stock CPU about 10% ahead of the 2700 – which can be overclocked to equivalence – and about 14.4% ahead of the original R7 1700X with X470. The fact that the 8600K at 5GHz surpasses the stock 8700K, but comes close to the 5GHz 8700K, suggests that Project Cars favors frequency to threads. That’d be where our rather sizeable performance delta emerges, with the stock 8700K’s 135.8FPS landing 22% ahead of the 2700X stock CPU. Overclocked, we ned up at 152FPS AVG, 122FPS 1% lows, and 116FPS 0.1% lows, which is 34% ahead of the overclocked 2700X. Clearly, there’s still something to be said for frequency in some applications.
Civilization VI – AMD R7 2700X vs. i7-8700K Turn Times
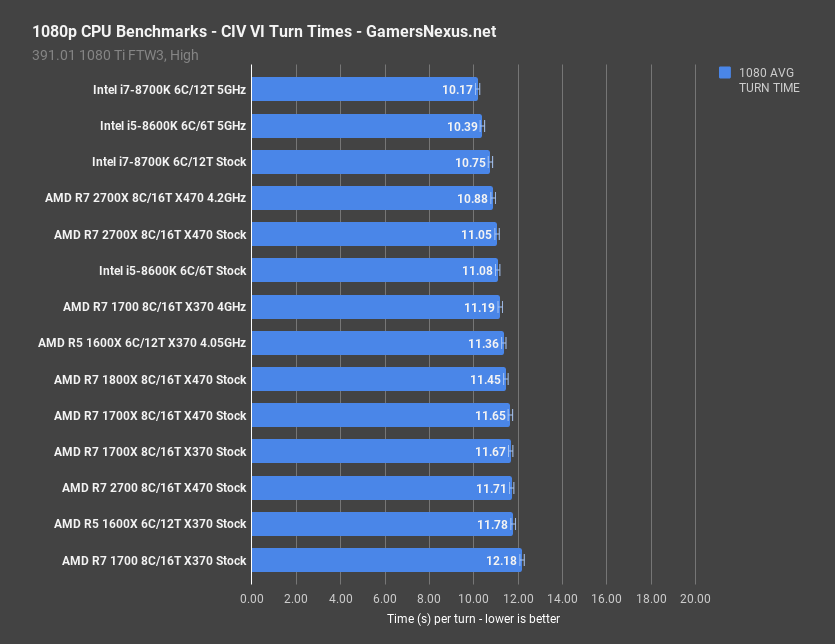
We test turn times for Civilization VI, but the game recently got a huge update that completely upended our previous testing. We have retested as a result. The 2700X stock CPU finishes each turn in 11.05 seconds, with all five turns taking about 55 seconds. Overclocking reduces the time requirement to 10.88 seconds, for a 1.5% time reduction. The 8700K stock CPU operates at 10.75 seconds – not a huge change – with the overclocked variant at 10.17 seconds, also not particularly game-changing. Civilization’s update has tightened turn times to a point of limited usefulness in benchmarking, although it is still a highly consistent and unique benchmark for the CPU.
Power Testing – AMD R7 2700(X) Power Draw
This is where it gets a bit interesting for AMD. AMD’s version of “TDP” isn’t comparable to Intel’s. You can’t point to a 95W TDP on the 8700K and compare it to a 95W TDP on the 1700X. The numbers are reached in different ways.
For AMD, TDP is calculated by subtracting 42 from 61.8 and dividing by 0.189. Those numbers are derived from the following: AMD claims that the “optimal” tCase temperature is 61.8 degrees, hence 61.8. AMD also says the optimal ambient temperature at entrance to the heatsink fan is 42 degrees at the inlet. They also say that the minimum degrees per Watt rating of a heatsink to achieve rated performance should be 0.189 thermal resistance.
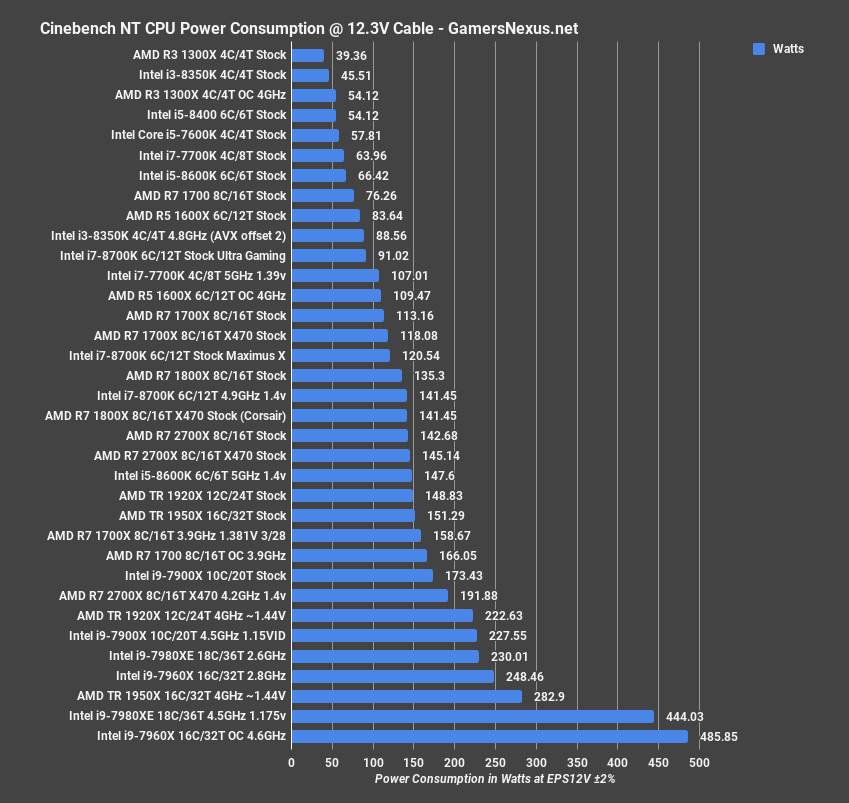
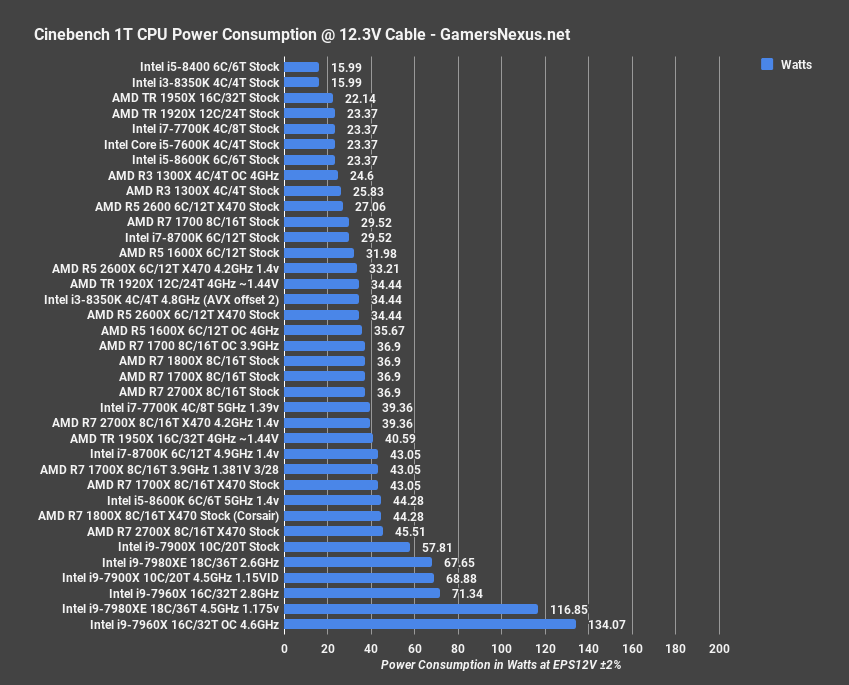
For power testing, Cinebench multithreaded positions the 2700X stock CPU at 143W consumption when left to full auto settings, or 192W when overclocked to 4.2GHz and 1.4V. The 1700X stock operated at 113W multithreaded. Single-threaded, the 2700X operated at about 46W on the X470 board, or 37W on the X370 board. The 1700X ran at 43W on X470 and 37W on X370. Remember that this is more a factor of the BIOS and board vendor.
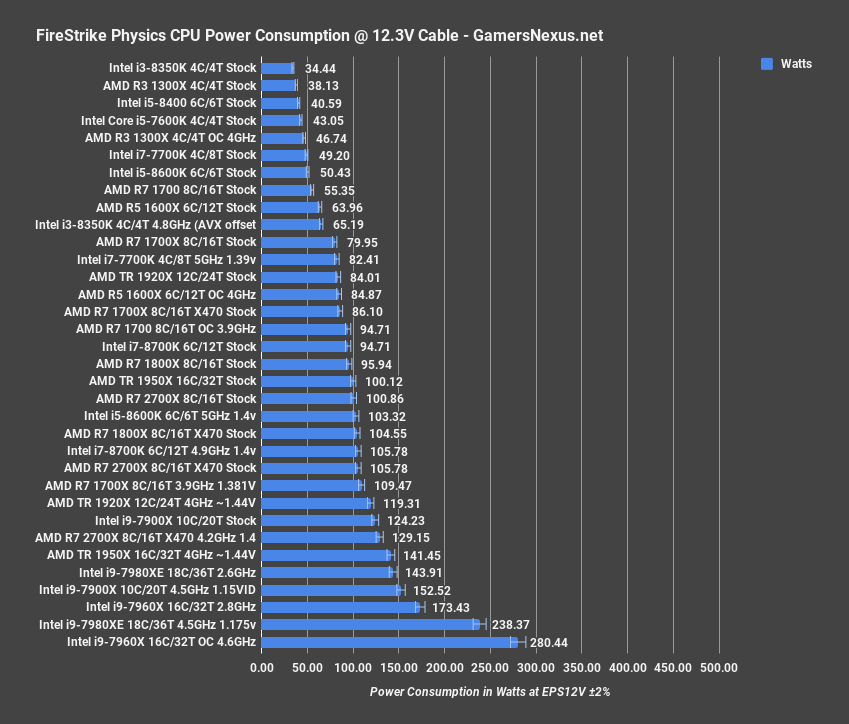
For 3DMark Physics, we measured 80W for the stock 1700X, 110W for the overclocked 1700X, and 100-106W for the stock 2700X. Overclocking pushed us to 130W on the 2700X.
Conclusion
First of all: If you’ve skipped here, and if you haven’t seen the video or read the article, you waive your right to complain about anything said in the conclusion. Go read or watch the rest. We don’t retype everything in our conclusion for people who skip ahead. The entire article is the conclusion.
Working our way from neutral to the rest: If you already own Ryzen 1 systems and you are considering upgrading, don’t bother. Skip this generation. Performance-wise, it’s not a huge climb, and a trivial OC can get most of it.
But raw performance is sort of the wrong way to look at Ryzen 2. The performance improvement is in voltage at a given frequency, which is now sustainable at a much lower value than previously. At 4.0GHz, power consumption is pulled down significantly, voltage requirement is pulled down significantly, and thermals (obviously) are pulled down. This is where AMD made its gains. Frequency is unexciting. We wanted 4.5GHz, and that didn’t come close to happening. All of our chips are stuck at 4.2GHz, maybe 4.25 (on ambient).
What we got instead was a massive uplift in volt-frequency curves, and that’s important.
As for purchase or upgrade considerations for those who don’t presently own a Ryzen CPU, the R7 2000 series parts seem fine. You’ve got all the charts above – make a decision from those. We’d recommend the non-X CPUs (e.g. 2700), as the R7 2700X basically just pre-overclocks for you. That’s not difficult, and is something that can be done in moments while saving $30. The same is true for the 2600(X), but we’ll talk about that in our next piece. We’d recommend the R7 2700 (with an OC) for anyone who needs the CPU to render, but can’t afford HEDT parts. An example of this use case would be project files that exceed available GPU memory, as system memory is more readily expanded in greater volume. We’d also recommend the R7 2700(X) for anyone who might be streaming daily, perhaps as a job or one-day-job, if handling processing on the local system that also handles the gaming. We would recommend the 8700K for a flat-out gaming PC, as it is hands-down the best gaming performer. The 8700K and 2700X oppose one another well; they each fill a role where the other falls behind: The 2700X exceeds 8700K raw performance in game streaming and 3D rendering; the 8700K exceeds the 2700X in raw gaming. Pick based on your needs.
We’re working on some major volt-frequency content with thermals, so check back for that.
Host, Editorial: Steve Burke
Testing: Patrick Lathan
Video: Andrew Coleman