Intel’s TDP has long been questioned, but this particular generation put the 95W TDP under fire as users noticed media outlets measuring power consumption at well over 100W on most boards. It isn’t uncommon to see the 9900K at 150W or more in some AVX workloads, like Blender, thus far-and-away exceeding the 95W number. Aside from TDP being an imperfect specification for power, there’s also a lot that isn’t understood about it – including by motherboard manufacturers, apparently. All manufacturers are exceeding Intel guidance for the Turbo boosting duration in some way, which is causing the uncharacteristically high power consumption that produces unfairly advantaged performance results. The other end of this is that the 9900K looks much hotter in some tests.
For readers of our 9900K review, you might remember a chart from our streaming benchmarks that illustrated power fall-off on the 9900K. That was from hitting power limit 2, whereupon the CPU clocks down to meet TDP spec (~95W CPU Package Power). Let’s reproduce that chart:
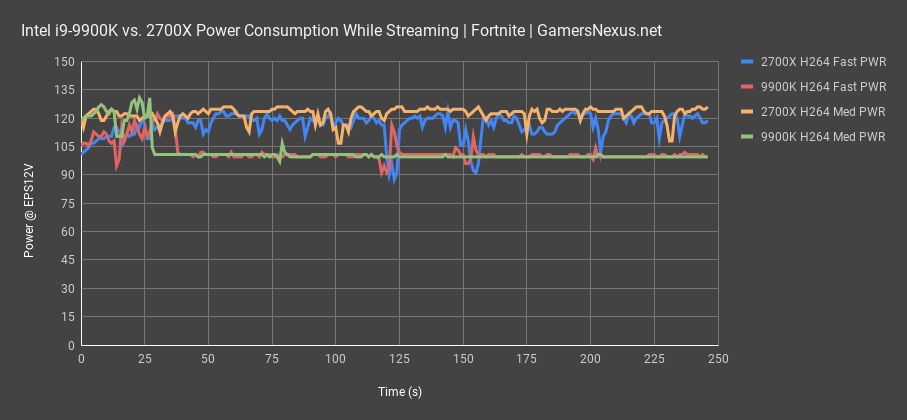
This is how the CPU and motherboard are supposed to jointly behave. It is acceptable for Intel CPUs to turbo past the power limit figures for defined periods. Power Limit 2, for example, can be exceeded for up to 100 seconds. Power Limit 4 can be held for 10ms. In either scenario, the CPU may burst to ~120W under some loads, but will fall back to 95W within the turbo duration. That’s assuming board vendors follow Intel guidance, anyway, and they don’t have to.
We need to define some elements of the turbo boosting spec:
- PL2: This is how much power the CPU can use in bursts. Intel’s document describes this as, quote, “a threshold that if exceeded, the PL2 rapid power limiting algorithmis will attempt to limit the spike above PL2.”
- PL1: The maximum frequency under a sustained load (given in watts). Intel’s document describes this as, quote, “a threshold for average power that will not exceed – recommend to set to equal TDP power. PL1 should not be set higher than thermal solution cooling units.” In other words, Intel recommends a 95W setting, but does not mandate it.

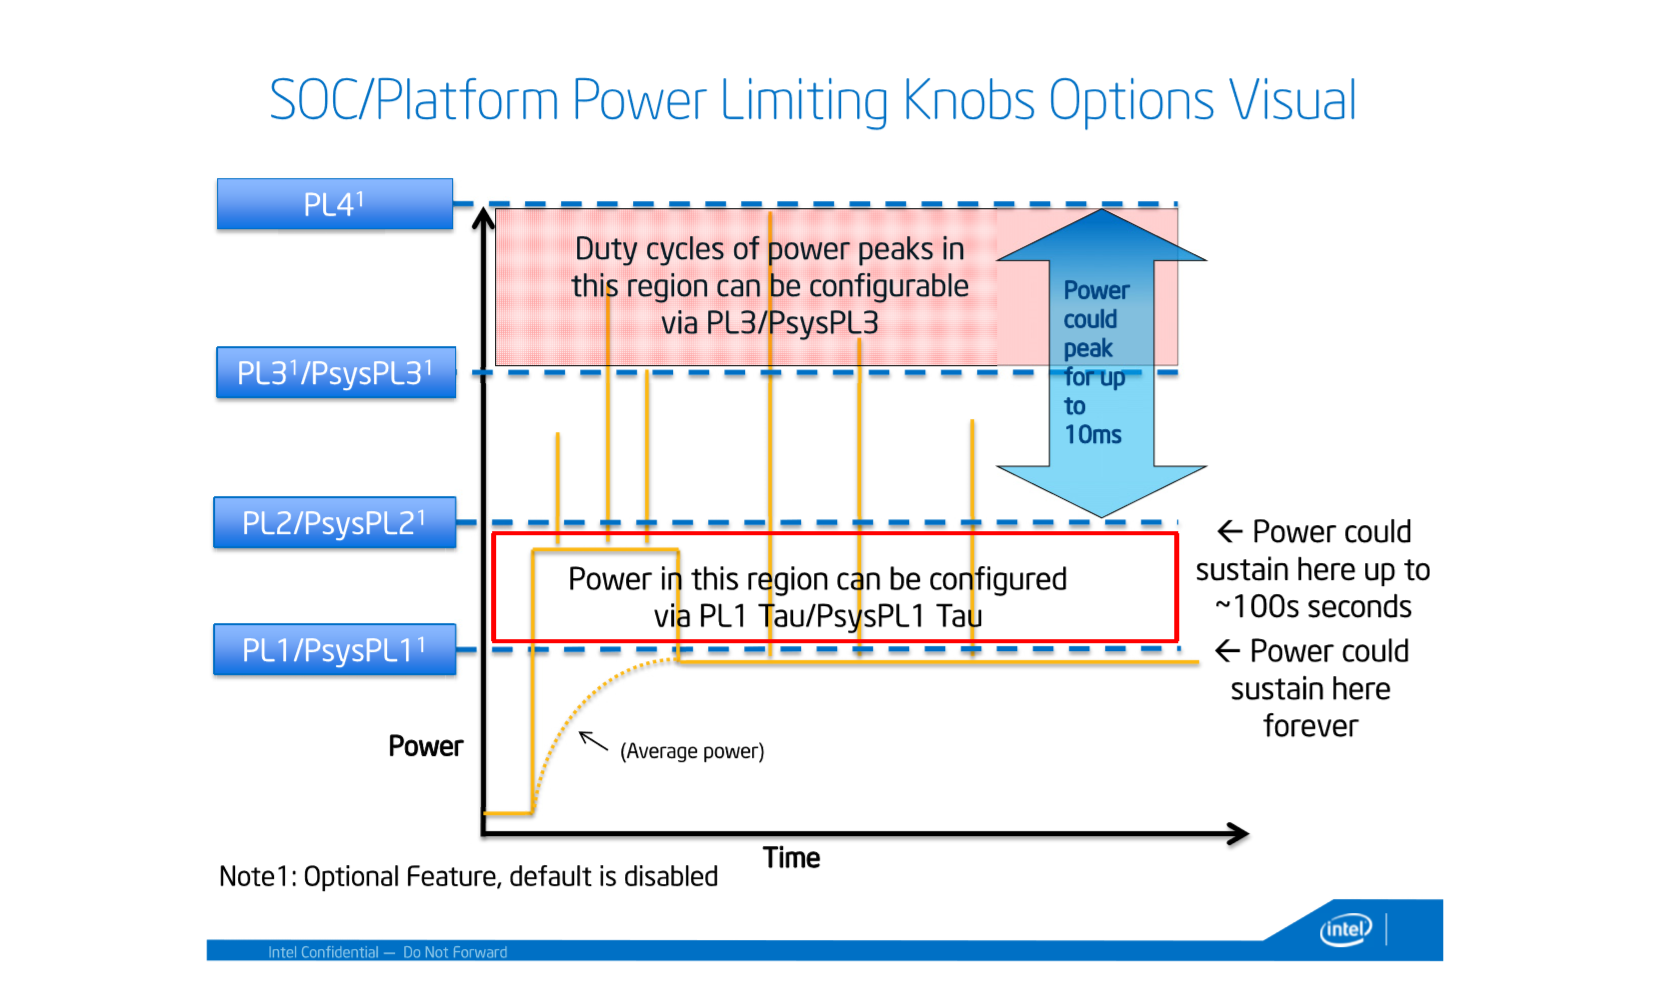
- Once EWMA power, or exponential weighted moving average power, is roughly equal to power limit 1, there is no more power budget for turbo boosting and frequency downclocks. That’s when it steps down to power limit 1 levels, exhibiting the lower frequency we’ll see in testing later. This is the Intel specification. If it were following what we’re seeing in some motherboards, you’d see power and frequency blasted at those peak frequency and PL2 levels instead.
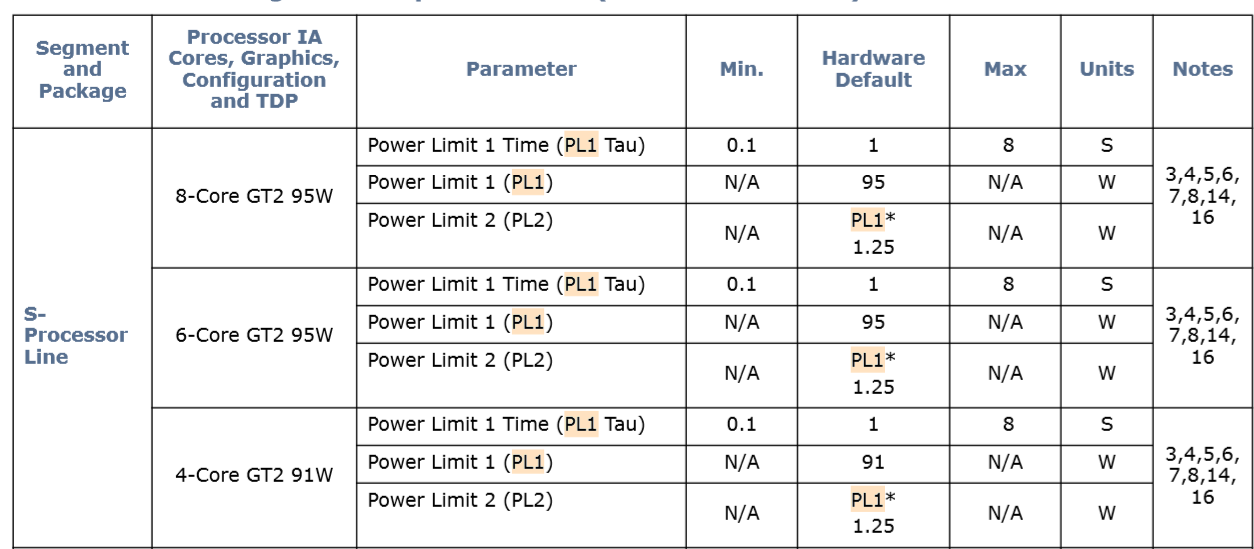
- In this same image, Tau is the Turbo time parameter, which is dependent on EWMA and follows the same curve. Intel allows for up to 100 seconds of PL2, or infinite of PL1. Power is allowed to PL4 for 10ms. By Intel’s spec, the hardware default for PL1 is 95 on an 8C CPU, or 119W for PL2 for the limited duration permitted. It is allowed to boost up to 119W briefly.
We should also note that TDP is a sort of difficult-to-use number, as it isn’t a literal power consumption definition. It’s perceived as that, and TDP is often nearly at 1:1 with power consumption, but it is more of a measurement of the cooling capabilities required to keep the CPU within thermal design.
Test Platform
We’ll keep this short. Testing was conducted on the following platform:
- Intel i9-9900K Stock CPU (unless otherwise noted)
- 16GB Corsair Vengeance LPX 3200MHz 16-18-18-36 (2x DIMMs)
- EVGA 1600W SuperNOVA Titanium PSU
- NZXT Kraken X62 (Max Speed)
- ASUS Z390 Maximus XI Hero
- EVGA Z390 FTW
- MSI Z390 Godlike
We’re measuring power in two places: We have EPS12V measurements at the PSU cables via current clamp, then we also have HWINFO software measurements. The two ensure that we have reliability and can trust the data, as they are used to validate one another. Hardware is always going to be the most reliable, but when it works, software can be the most accurate. In this instance, the two numbers are nearly identical, so that makes things easy. We’re also going to be showing the power within the first 30-60 seconds, which will better illustrate at what point any Turbo duration throttles kick-in.
For testing, a truncated GN Logo Blender run is used at 20% render resolution. This runs for approximately 3-4 minutes, depending on motherboard and settings. Once we validated the performance and behavior of each board, we committed the most important boards to a full GN Logo Blender run at 50% resolution (used in our reviews). This takes about 30 minutes on a “good” CPU, and so is a highly stressful test that will blow past Turbo duration limits quickly. The test is also an AVX workload in the real world (Blender 2.79), making it more relatable than Prime95. We are not modifying the CPU at all. All modifications are done at a BIOS level for various motherboard settings, but not for the CPU itself. Those are defined in the content.
All other performance results shown in the full Blender load used the parts described therein. Remaining questions about those parts should be directed toward our 9900K test methodology section.
i9-9900K Power Consumption During Blender
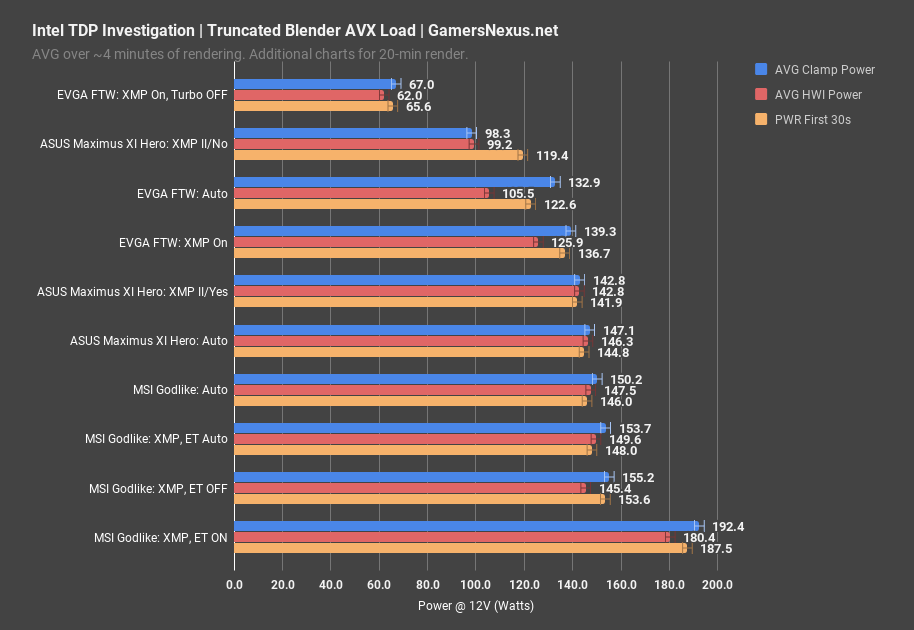
Power consumption is the most important for this one, seeing as it is a TDP rating discussion.
This chart shows a lot of range. First of all, none of these results involve manual overclocking. We only ever changed one or two settings, one of which would have been XMP. Out of all of these results, there’s only one that follows Intel’s specification: That’s the ASUS Maximus XI Hero with “No” selected to the enhancement prompt after enabling XMP. For this one, we measured about 98W down the EPS12V cables, which is within reasonable margin of error for the 95W TDP specification. This is within spec. For the first 30 seconds, we observed dwindling power consumption from 140W to 120W, before eventually falling off to 98W. This is due to turbo boost duration policies, something we’ll show in another chart later. This is what all of the boards should look like for power metrics.
Intel i9-9900K Turbo Duration Drop-Off & PL1 vs. PL2
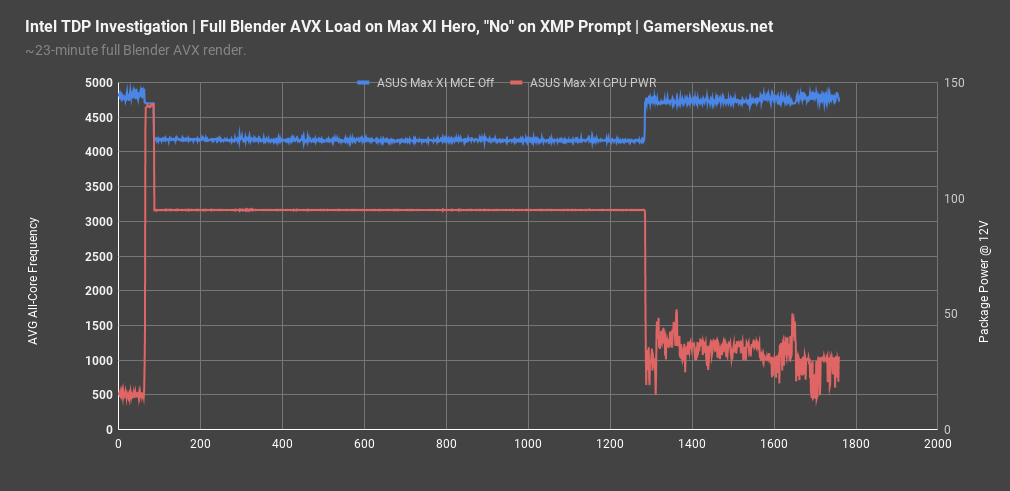
For reference, here’s what the frequency functionality looks like when operating under settings with MCE disabled via XMP II and the “No” prompt. This plot takes place over a 23-minute Blender render, so this is a real-world use case of the i9-9900K. Notice that there is a sharp fall-off after about 30 seconds, where average all-core frequency plummets from 4.7GHz to 4.2GHz. Notice that the power consumption remains at almost exactly 95W for the entire test, pegged to 94.9W and relatively flat. This corresponds to the right axis, with frequency on the left. This feels like an RTX flashback, where we’re completely power-limited. The difference is that this is under the specification, despite the CPU clearly being capable of more. You’ll see that the frequency picks up again when the workload ends, leaving us with unchallenged idle frequencies.
Back to Power Consumption
Let’s get that power chart back on the screen.
Here’s the weird thing: If you leave the ASUS board to just auto, without any form of XMP enabled, then the Multicore Enhancement feature is left to “Auto” as well. In this version of Multicore Enhancement, instead of boosting to the maximum single-core frequency, which is very obvious when done and violates spec, ASUS is extending the turbo boost duration. That’s the new form of MCE. It’s tricky and well-hidden. Rather than boost visibly different numbers like applying the single-core boost multiplier to all cores, the board is allowing turbo to last ad infinitum. The fact that the board operates outside of spec when auto but inside of spec when XMP is on is odd, to say the least. You’d expect a more consistent policy. It seems as if ASUS hasn’t decided if it wants to be within spec and lose to other boards or exit spec and exceed TDP.
Let’s get the EVGA outlier out of the way: This is what power consumption looks like when you completely disable Intel’s turbo boost functionality. It’s obviously awful, as you’re not really supposed to run the CPU this slow. This establishes that Turbo is within TDP specifications, but only when turbo duration is properly controlled by the motherboard manufacturer. EVGA did not appear to have an MCE option of any kind and only had a normal turbo toggle, so we decided to use it as a vessel for testing that power consumption baseline.
Next, the other end of the chart shows the MSI Godlike with Enhanced Turbo explicitly enabled as pulling 192W down the EPS12V cables. For reference, Enhanced Turbo is natively set to “Auto,” which has an infinite turbo duration and violates TDP under all motherboard settings. Enabling Enhanced Turbo explicitly will boost all-core frequency to 5.0GHz.
If we highlight the complete auto MSI configuration, that has us at 150W draw – not anywhere close to the power figures cited by Intel. Technically, this makes MSI the ones at fault, but we don’t know if there are any behind-the-scenes politics that could influence things. MSI also exits spec with Enhanced Turbo set to Auto, which keeps the 4.7GHz ratio, but also removes the turbo duration limit. Disabling Enhanced Turbo explicitly leaves us in the same spot: Turbo durations still have no limit and power is still at about 150W-155W.
MSI Z390 Godlike (ET Auto) Turbo Duration vs. ASUS Maximus XI Hero (MCE Off)
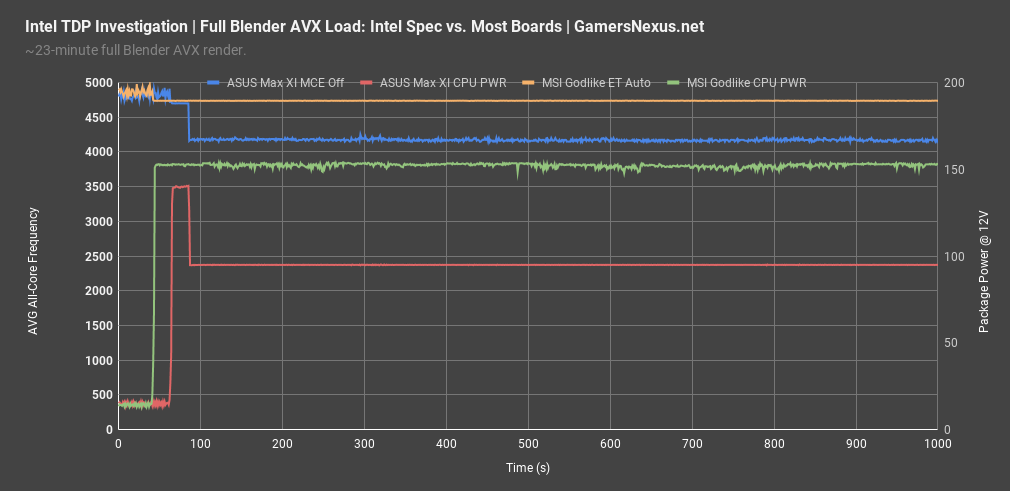
Here’s the frequency versus time plot when MSI’s Godlike is involved. For this setup, the ASUS board is still set to follow spec and has MCE disabled. The MSI board is under its Auto ET settings, which are the same as its Disabled ET settings. In this example, the MSI board is holding strong to 4735MHz, which is violating the spec in multiple ways: For one, BCLK is 100.8, which we already discussed. For two, the turbo duration limit is removed under these auto settings – and all settings, actually – and so it holds a higher ratio. Power draw is also higher, pegged to 152W instead of 95W from ASUS. That extra 60W goes a long way for performance.
Back to power one more time: With ASUS, selecting “Yes” to the prompt puts us at around 142W, right around the others. At this point, the only difference between EVGA, MSI, and ASUS is the automatic voltage provision. EVGA has the tightest Vcore, and so draws less power – but it is also exiting turbo duration spec.
For reference, our initial review was done with the correct setting: We used the ASUS motherboard with XMP II and “No” selected at the prompt, and so our results follow the Intel specification and guidelines. If we used a different motherboard, though, our results would be higher, and our thermals would be significantly higher.
Performance Impact of 9900K Turbo Duration (Truncated)
We have two performance tests to look at. The first one is a truncated test, rendering our GN Logo scene at only 20% resolution. You can see the normal GN Logo render in our intro animation to our videos. It’s one frame from our intro animation to this video. The second performance test is the normal 50% resolution render, which takes half an hour on even a good CPU.
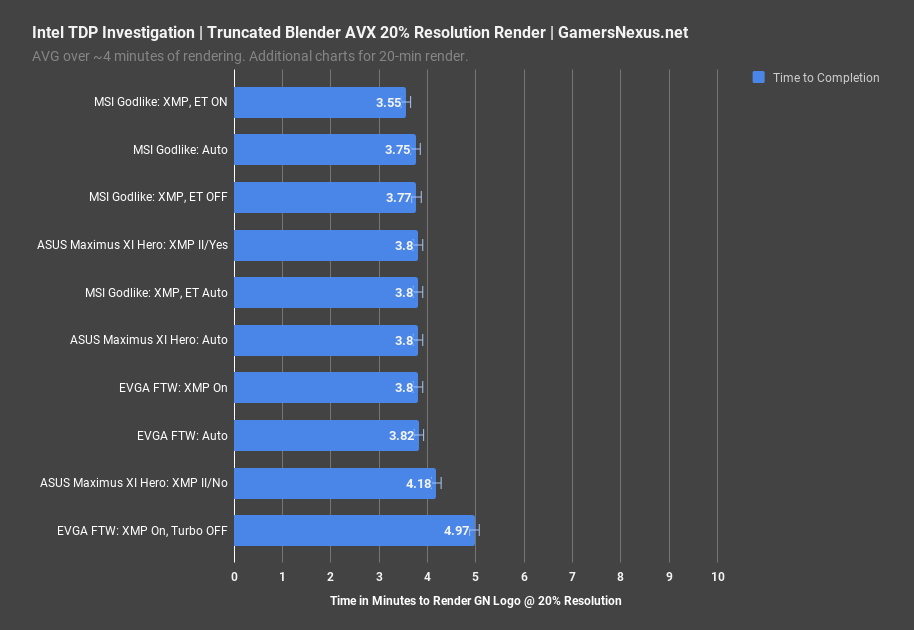
For the 20% resolution test, you’ll see that the only three items outside of error margins are quickly identifiable. At the low-end of the chart, the EVGA FTW with turbo completely disabled is obviously bad. That’s where Intel is at 65W with the 9900K. More critically, the ASUS Hero with MCE completely disabled, selecting “no” at the XMP prompt, performs noticeably worse than the other motherboards. ASUS gets punished for partially following Intel’s spec, though their auto setting still exceeds it, so we can’t give them too much credit. At 4.2 minutes to render the logo, we’re taking 11% longer to render the logo than the rough average of 3.8 minutes for the other boards.
MCE Off vs. MCE On in Z390 (vs. 2700[X])
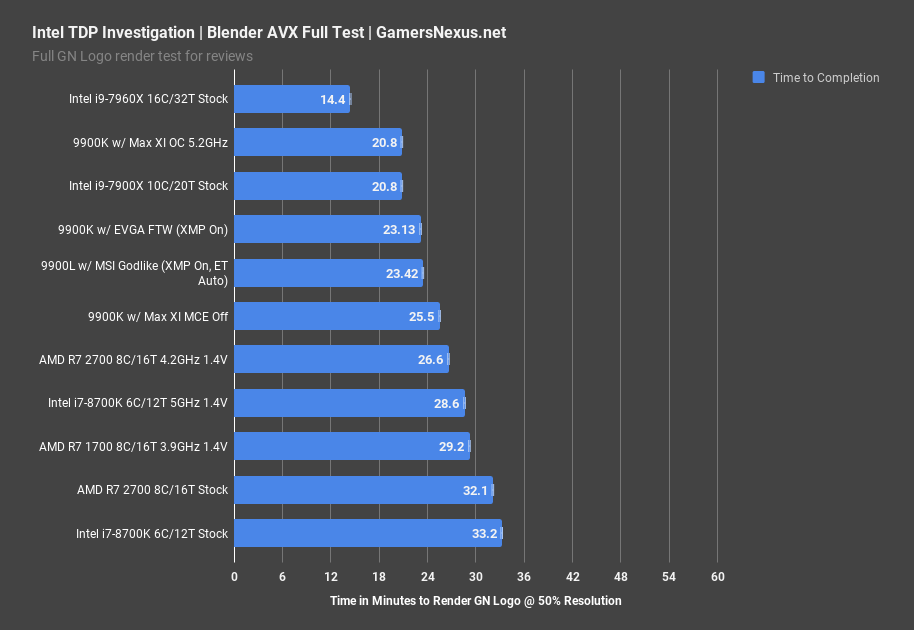
Here’s the full render. We only have a few of the 9900K references on here as the test takes so long. It’s just enough to make a point.
Our original review used the correct settings to follow Intel spec, and so is the worst of the 9900K results. That’s at 25.5 minutes, which is just ahead of the R7 2700 at 4.2GHz. It’s about a minute faster. It’s about 3 minutes faster than the 8700K at 5GHz, and significantly slower than the 7900X stock.
With the MSI Godlike and EVGA FTW extended turbo durations, we saw render time reduced by about 9.3%. That’s noteworthy and diminishes the gap between the 7900X while widening the gap between the 2700 and 2700X stand-in at 4.2GHz. Finishing in 23 minutes instead of 25.5 might not sound a lot, but it’s all about scale. If you’re an animator, you’re likely rendering thousands of frames. A 10% time requirement reduction per frame will add up very fast, and so it is misleading to show performance numbers outside of spec. But at the same time, if all the boards pretty much violate the spec, maybe it isn’t misleading. If that’s the reality, then it is accurate to performance in most cases, but inaccurate insofar as power consumption. Either way, both cannot be accurate simultaneously.
We’ll discuss thermal impact in our next instalment of this series.
Conclusion: Responsibilities of Motherboard Makers & Intel
Blasting past the turbo duration limits has a few consequences, all of which have shown themselves in recent reviews. Of note, voltages will run higher, power consumption will run higher, and thermals will therefore be higher as steady state is achieved. This contributes to the perception of hot, power-hungry processors. It also contributes to higher scores in sustained load tests, like our long-term Blender benchmark. The differences don’t enumerate as aggressively in short tests (because turbo is allowed for a duration of at least ~30-100 seconds in PL2, or 10ms in PL4), but those differences multiply as load becomes longer. A 10% difference against a 20-minute 3D render amounts to a couple of minutes for that frame, but for people rendering thousands of frames (most people rendering), that adds up very fast. Our own GN Logo animation at full resolution would take 3,000 minutes (50 hours) to render under the Intel turbo duration guidance (see: Maximus XI with MCE Off), whereas it would take 2,760 minutes (46 hours) under the stock settings from MSI or the “enhanced” ASUS settings. That gets noticeable fast, and that’s only for a 2-second animation at 60FPS.
At some point, you’re left asking who’s really at fault. Maybe Intel isn’t being strict enough, as most of the turbo policies are “guidance,” not enforced specification or requirements. Maybe the motherboard manufacturers are stepping out of bounds. We have heard rumor that Intel will crack-down harder on board manufacturers for violating these specs this generation, and we hope that’s true. It’s an interesting dichotomy between companies like Intel and NVIDIA: For NVIDIA, too much power is exhibited, to a point where we get calls weekly from NVIDIA’s partners complaining about some new overstepping of boundaries. For Intel, the boundaries are too weakly defined, resulting in manufacturers walking all over Intel. This makes Intel look both good and bad, so it is up to Intel to determine how strictly it wants to enforce its turbo policies and TDP: the “good” is higher performance in benchmarks, whereas the “bad” is exiting the suggested “TDP” (for what that metric is worth) and overdrawing on power while overheating in temperature.
By and large, despite motherboard manufacturers’ propensity to ignore specifications, we must also note that Intel is the one that decided to set a TDP of 95W, not the manufacturers. If all motherboards (except one, using one setting) are running far north of TDP – even when considering TDP does not equal power consumption – then perhaps the TDP should be changed. The CPU can run within thermal design spec, it can run within power target, and yet almost all of the motherboards will not run at this spec. Some can’t even be manually forced to run at the turbo duration guidance. Again: Intel must enforce its spec if it hopes to claim operating at those numbers. We can blame motherboard makers for not following spec, but if none of them follow spec, the problem is deeper.
ASUS gets small credit for enforcing spec with “No” selected at the XMP prompt (MCE off), but the company isn’t an angel. ASUS still doesn’t follow PL2 turbo duration guidance with “Auto” settings.
Anyway, if you wondered why power consumption and thermals are high in some reviews, that’s why. All our testing for review was done on the ASUS Maximus XI Hero with “No” at the prompt, therefore MCE was off, and so our results reflect Intel’s specification. Those who use other boards may operate outside of that guidance, but then again, if that’s how the board natively operates, it’s still a valid benchmark, a valid review, and still validly represents performance on that platform. It is a real use case, just one that probably shouldn’t exist. That isn’t the fault of the reviewers, though.
Editorial, testing: Steve Burke
Video: Andrew Coleman