NVLink Titan RTX Benchmarks vs. 2080 Ti SLI: Gaming & Power Consumption
Posted on
We already reviewed an individual NVIDIA Titan RTX over here, used first for gaming, overclocking, thermal, power, and acoustic testing. We may look at production workloads later, but that’ll wait. We’re primarily waiting for our go-to applications to add RT and Tensor Core support for 3D art. After replacing our bugged Titan RTX (the one that was clock-locked), we were able to proceed with SLI (NVLink) testing for the dual Titan RTX cards. Keep in mind that NVLink is no different from SLI when using these gaming bridges, aside from increased bandwidth, and so we still rely upon AFR and independent resources.
As a reminder, these cards really aren’t built for the way we’re testing them. You’d want a Titan RTX card as a cheaper alternative to Quadros, but with the memory capacity to handle heavy ML/DL or rendering workloads. For games, that extra (expensive) memory goes unused, thus demeaning the value of the Titan RTX cards in the face of a single 2080 Ti.
This is really just for fun, in all honesty. We’ll look at a theoretical “best” gaming GPU setup today, then talk about what you should buy instead.
Test Methodology
Testing methodology has completely changed from our last GPU reviews, which were probably for the GTX 1070 Ti series cards. Most notably, we have overhauled the host test bench and had updated with new games. Our games selection is a careful one: Time is finite, and having analyzed our previous testing methodologies, we identified shortcomings where we were ultimately wasting time by testing too many games that didn’t provide meaningfully different data from our other tested titles. In order to better optimize our time available and test “smarter” (rather than “more,” which was one of our previous goals), we have selected games based upon the following criteria:
- Game Engine: Most games run on the same group of popular engines. By choosing one game from each major engine (e.g. Unreal Engine), we can ensure that we are representing a wide sweep of games that just use the built-in engine-level optimizations
- API: We have chosen a select group of DirectX 11 and DirectX 12 API integrations, as these are the most prevalent at this time. We will include more Vulkan API testing as more games ship with Vulkan
- Popularity: Is it something people actually play?
- Longevity: Regardless of popularity, how long can we reasonably expect that a game will go without updates? Updating games can hurt comparative data from past tests, which impacts our ability to cross-compare new data and old, as old data may no longer be comparable post-patch
Game graphics settings are defined in their respective charts.
We are also testing most games at all three popular resolutions – at least, we are for the high-end. This includes 4K, 1440p, and 1080p, which allows us to determine GPU scalability across multiple monitor types. More importantly, this allows us to start pinpointing the reason for performance uplift, rather than just saying there is performance uplift. If we know that performance boosts harder at 4K than 1080p, we might be able to call this indicative of a ROPs advantage, for instance. Understanding why performance behaves the way it does is critical for future expansion of our own knowledge, and thus prepares our content for smarter analysis in the future.
For the test bench proper, we are now using the following components:
GPU Test Bench (Sponsored by Corsair)
Component | Courtesy of | |
CPU | GamersNexus | |
GPU | This is what we’re testing! | Often the company that makes the card, but sometimes us (see article) |
Motherboard | ASUS | |
RAM | Corsair | |
PSU | Corsair | |
Cooler | NZXT | |
SSD | Plextor 256-M7VC | GamersNexus |
NVLink Titan RTX SLI Benchmark vs. 1080 Ti SLI, 2080 Ti SLI - Sniper Elite 4
Sniper Elite 4 comes up first, running at 4K/High with DirectX 12 and Async compute. As always, we select our game benchmarks based on what they illustrate, carefully choosing each one. Sniper is the best representation of a well-optimized DirectX 12 title with asynchronous compute.
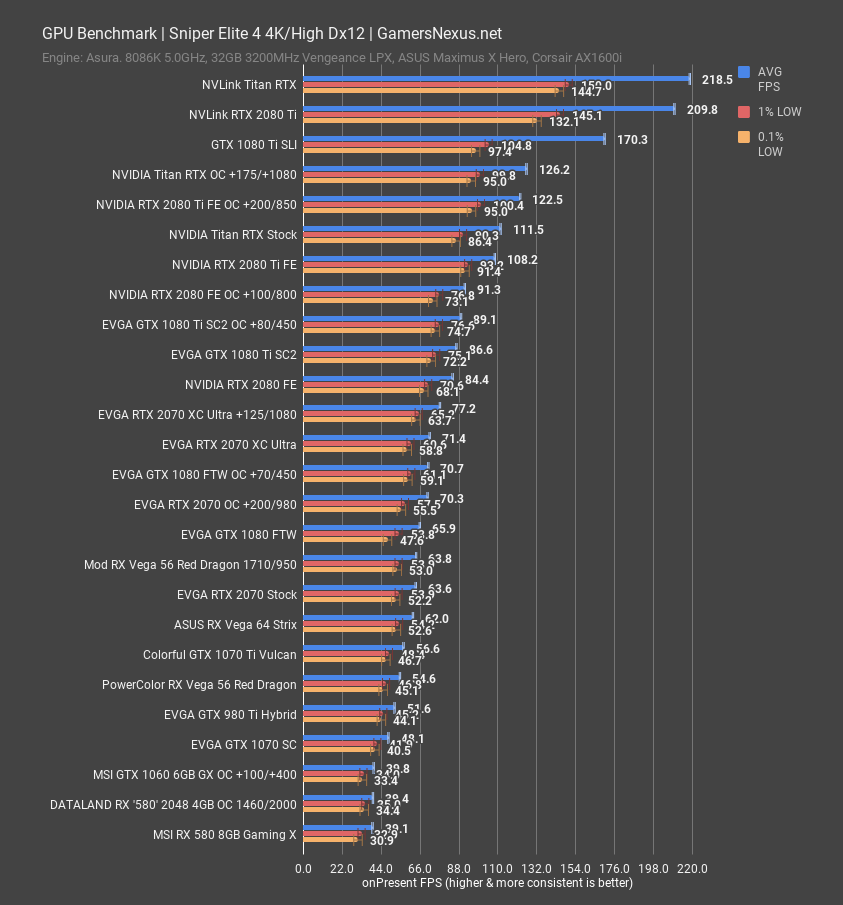
With this configuration SLI Titan RTX cards end up at 219FPS AVG, just ahead of the RTX 2080 Tis in SLI, which run at 210FPS AVG. Lows are well-timed on each device, but we’ll look at frametimes momentarily to better see what’s happening. The 1080 Tis in SLI end up at 170FPS AVG, also strong performers in frametimes. Overall, we see scaling of about 96% over a single Titan RTX card’s 112FPS AVG. The RTX 2080 Tis posted roughly 94% scaling over a single RTX 2080 Ti, so the Titan is consistent with our previous findings. A well-built game will clearly give plenty of room for scaling, although it still doesn’t make any financial sense to go with two Titan RTX cards over two RTX 2080 Ti cards, and even that becomes questionable.
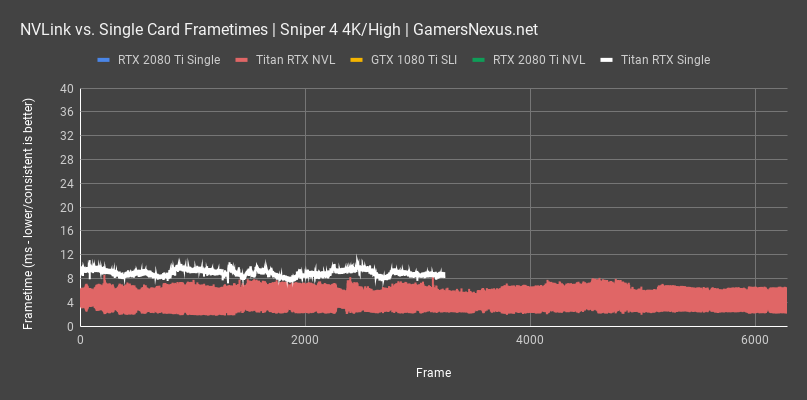
Frametimes should be more interesting to look at. As always, this gives you a look at the frame-to-frame experience and illustrates any potential spikes or stutters that would otherwise be averaged out. We care about lower frametimes, but more importantly, about consistent frametimes with minimum deviation from the mean. More than an 8-12ms deviation will be detectable as a “stutter” by users.
With the Titan RTX cards in NVLink, we immediately see a dense frametime bar that ticks back-and-forth in an oscillating pattern. This isn’t an ideal bar. Every other frame is half the speed of the previous, which may speak to alternate frame rendering patterns. We’re seeing frames at 3.2ms, then 6.3ms, then 3.2ms, then 6.2ms, and so on. Fortunately, this pattern isn’t highly noticeable to the user as it’s just 3ms, but it’s certainly less smooth than a single Titan RTX. A single Titan RTX has frametime variation of less than 1ms per frame, which is incredibly good. You can’t get much smoother delivery than that. The single 2080 Ti looks similar, with variation frame-to-frame of less than 1ms on average.
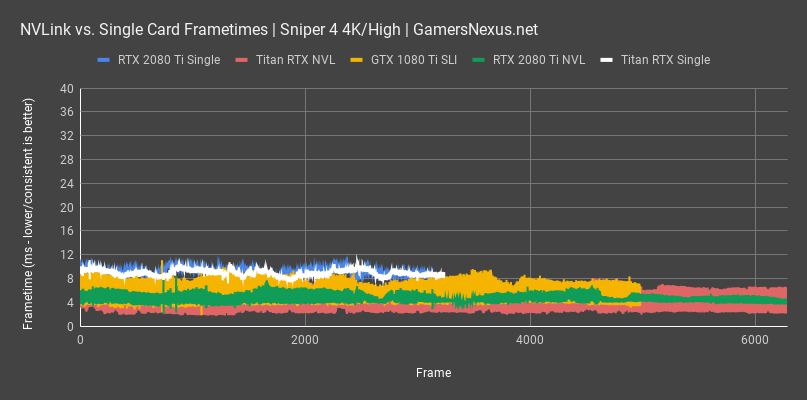
SLI produces a similarly chaotic pattern for the 1080 Tis, although a less chaotic one for SLI 2080 Tis than the Titans. It’s still less consistent than a single card, but ends up somewhere between the dual Titans and single 2080 Ti for consistency. The chart is getting a bit illegible at this point, so we’ll cap it here. Wherever you see thick lines, that’s an SLI configuration. Anywhere you see the thinner lines is a single device.
NVLink Titan RTX SLI Benchmark – F1 2018
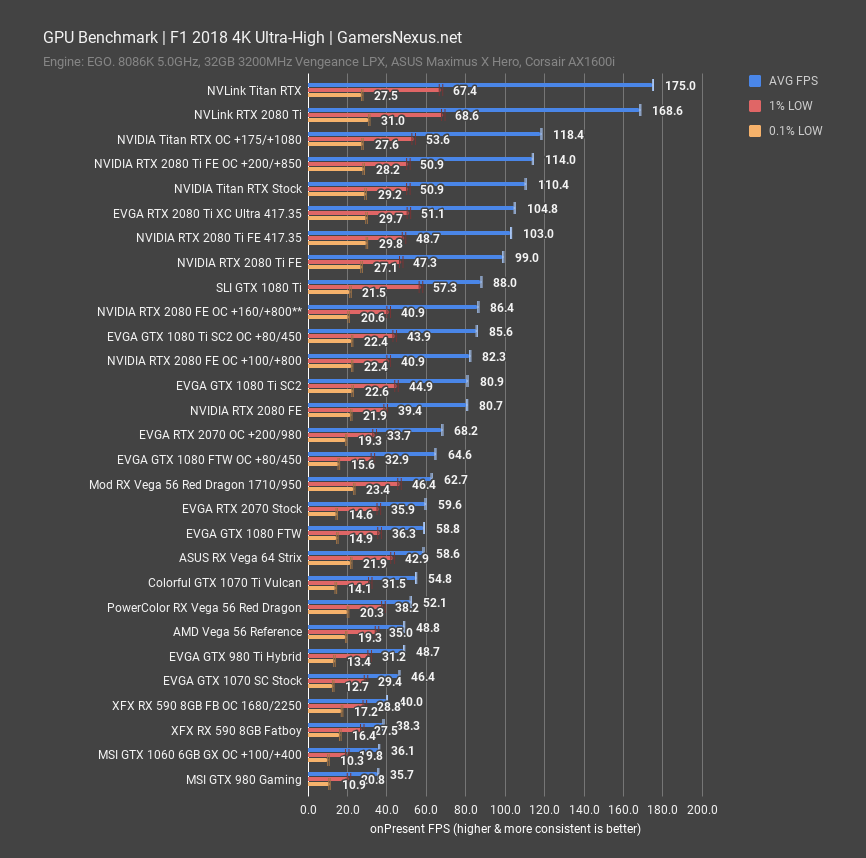
F1 2018 gives us the opposite perspective, instead looking at a well-built DirectX 11 title. This represents most of the games on the market presently. In this title, SLI Titan RTX cards operate a 175FPS AVG, with frametimes scaling minimally from a single card. The single Titan RTX does 110FPS AVG, with lows at 51 and 29FPS, as opposed to the 67 and 28FPS lows of the SLI configuration. In SLI, the Titan RTX cards hold a lead of 3.8% over the dual 2080 Ti cards, which is overall unimpressive. Scaling versus the single Titan RTX is 59%. That’s better than a lot of games when running SLI, but nothing close to what we saw with Sniper. As for CPU limitations, we know from our 1080p tests that this game can minimally push 213FPS AVG, so we aren’t hitting a limitation there just yet.
NVLink Titan RTX SLI Benchmark – Far Cry 5
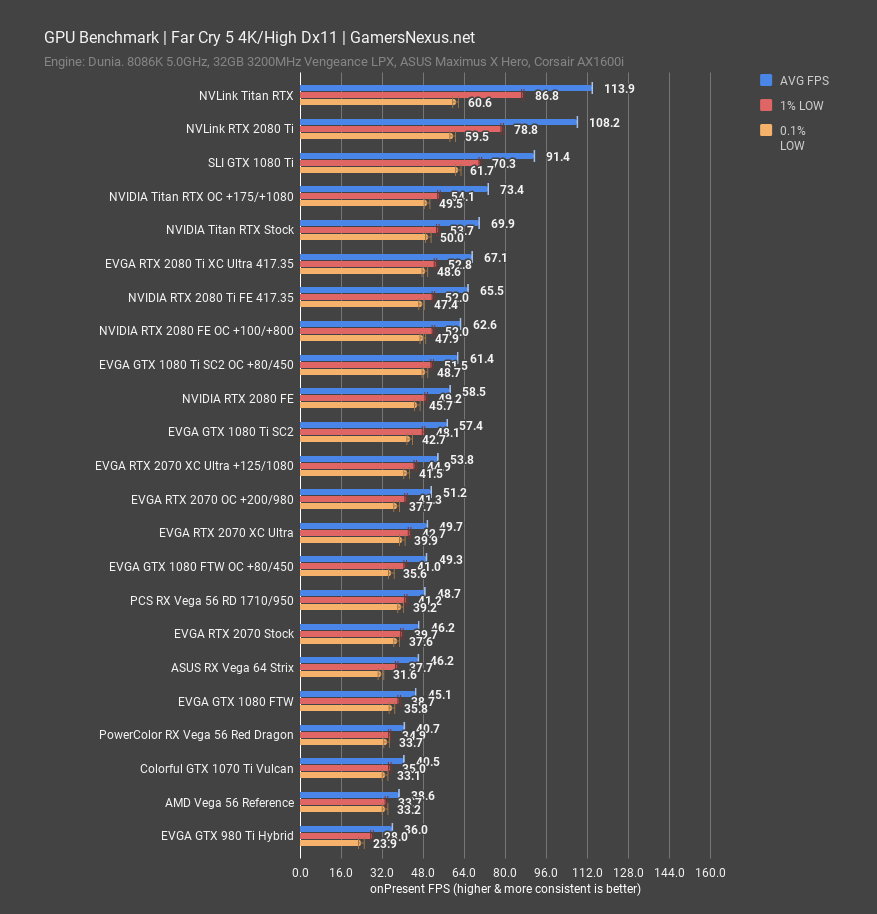
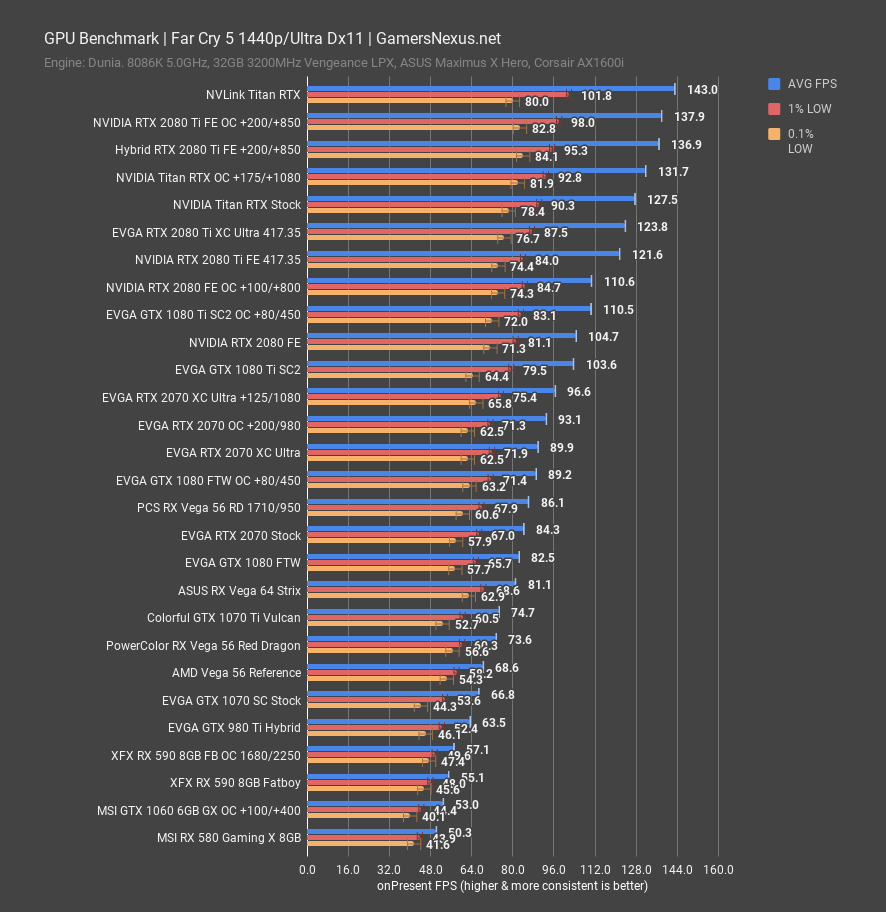
Far Cry 5 at 4K places the Titan RTX NVLink cards at 114FPS AVG, scaling about 5.3% ahead of the NVLink RTX 2080 Ti cards, or about 25% over SLI 1080 Ti cards. As for scaling over a single device, the dual Titan RTXs end up 63% ahead of a single Titan RTX, with dual 2080 Tis about 65% scaled and dual 1080 Tis about 59% positively scaled.
1440p testing shows us that we weren’t hitting a CPU limit in the previous chart. NVLink Titans do 143FPS AVG, but scaling is now limited to about 12% over a single Titan RTX. It’s this point that we’re hitting CPU bottlenecks. We won’t bother showing it, but at 1080p, the limit was also 143FPS AVG. That seems to be the cap for the CPU.
NVLink Titan RTX SLI Benchmark – GTA V
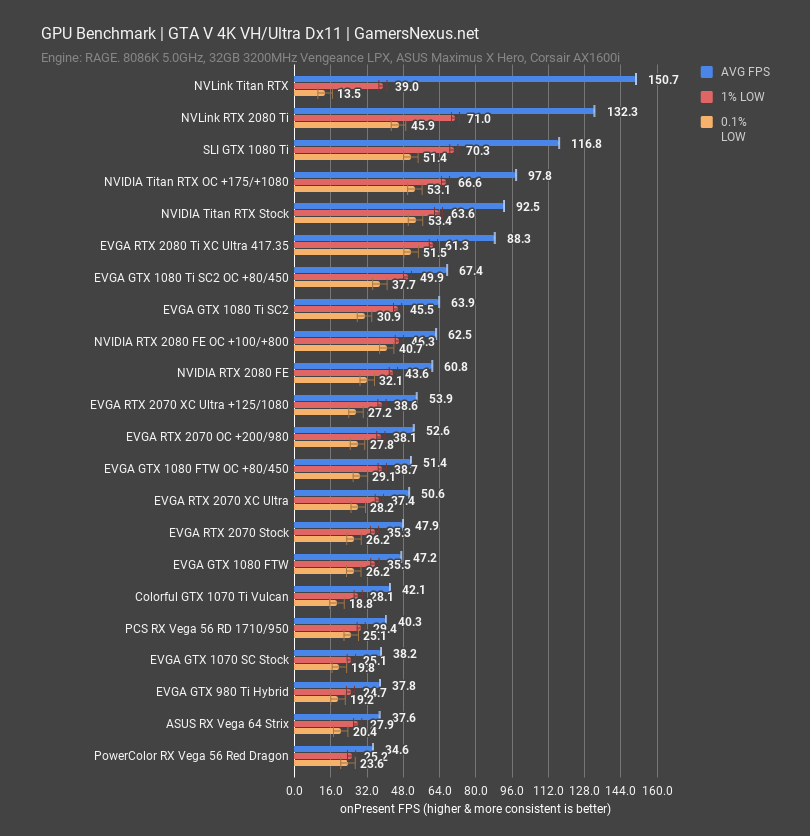
GTA V deserves a bit of a prelude before we get into the numbers. If you missed it previously, we discovered an issue with GTA V where i5 CPUs would bounce off of the framerate cap of 187.5FPS, but do so in a hard way. This resulted in higher-performing i5 CPUs getting punished for their high performance, because they’d stutter hard with each hit to 187.5FPS. This was never resolved by Rockstar, and the best solution was to just increase the graphics quality until framerate became worse on average. A higher framerate gave a worse experience.
That’s seen again here, despite using an i7-8086K. We never saw this in our previous testing, so it’s somewhat unique. At 4K, our SLI Titan RTX cards are hitting 151FPS AVG, which would look find if we only looked at averages. In reality, the frametimes are inconsistent, with a 1% low hitting 39FPS and 0.1% low hitting 13.5FPS. It’s instances like this where our 1% and 0.1% lows work well to illustrate limitations of the AVG. The SLI 2080 Ti cards didn’t encounter this same issue, as framerate was low enough to not trip GTA V’s game engine limitations.
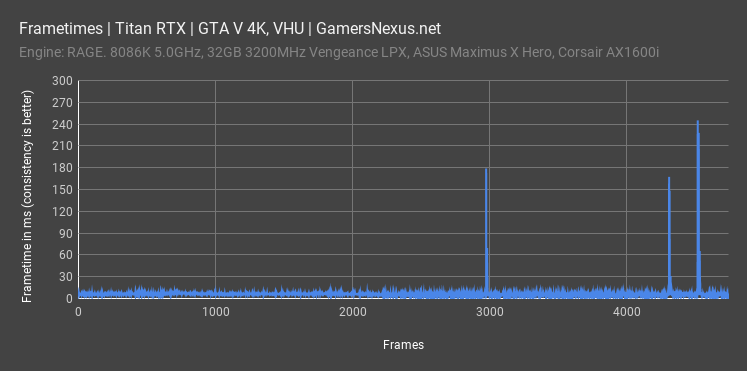
Here’s the example of why average framerate is insufficient for just about anything. In this scenario, the chart looks great for the Titan RTX card for most of the test; that is, until we hit about the 3000th frame, where we encounter a 180ms render time. This means that you’re waiting for nearly a fifth of a second to get a new frame, which is very noticeable. This happens again toward the end, then again in rapid succession, where we encounter multiple 240ms frametimes in a row.
Performance is dismal in this title, despite overall high averages. Oddly, the 2080 Tis in SLI don’t seem to get hit as hard. The solution is to boost graphics settings until FPS is lower on average, which will help dodge these issues. It seems to be a GTA engine bug.
SLI Titan RTX Power Consumption
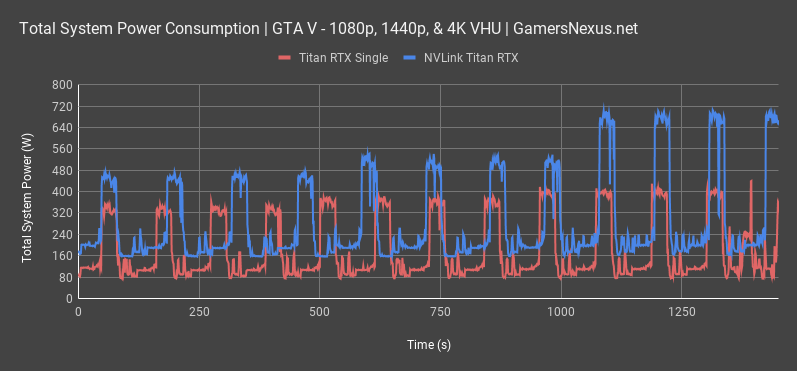
Here’s a look at power consumption during our GTA V test passes. The first set of tests shows 1080p results, plotting 480W for total system power with the SLI Titans, or about 330W for the single Titan RTX card. That increases to 560W at 1440p, as we were heavily CPU limited at 1080p, with the single card climbing to 400W. At 4K, the total system power consumption for SLI Titan RTX cards is 720W, with the single Titan RTX still capped at about 400W.
Conclusion
This is clearly not worth buying for gaming configurations. We knew that going into it, and we hopefully tempered expectations with the intro. NVIDIA built these cards for a purpose, it’s just not the one to which we applied them. For VRAM-bound applications, the Titan RTXs seem like budget-friendly options for the professional world. We may look at that later, but for today, we’re working on some more extreme overclocking setups with the Titan RTXs in SLI.
Editorial, Testing: Steve Burke
Video: Andrew Coleman, Keegan Gallick