Following unrelenting rumors pertaining to its pricing and existence, nVidia's GTX 980 Ti is now an officially-announced product and will be available in the immediate future. The GTX 980 Ti was assigned an intensely competitive $650 price-point, planting the device firmly in a position to usurp the 780 Ti's positioning in nVidia's stack.
The 980 Ti redeploys the GTX 980's “The World's Most Advanced GPU” marketing language, a careful indication of single-GPU performance against price-adjacent dual GPU solutions. This video card takes the market positioning of the original GTX 780 Ti Kepler device in the vertical, resulting in the following bottom-up stack:
- GTX 980 4GB (now $500, reduced from $550 MSRP).
- GTX 980 Ti ($650 launch MSRP).
- GTX Titan X (still $1000, more or less).
Until Pascal arrives, nVidia is sticking with its maturing Maxwell architecture. The GTX 980 Ti uses the same memory subsystem and compression technology as previous Maxwell devices.
This GTX 980 Ti review benchmarks the video card's performance against the GTX 980, Titan X, 780 Ti, 290X, and other devices, analyzing FPS output across our suite of test bench titles. Among others tested, the Witcher 3, GTA V, and Metro: Last Light all make a presence.
NVIDIA GeForce GTX 980 Ti Benchmark & Dx12 Updates Video
(Note: At time of publication, the video was still pending upload and may be unavailable for a brief period).
NVIDIA GeForce GTX 980 Ti Specs vs. GTX 980, Titan X, & GTX 780 Ti
| GTX 980 Ti | GTX Titan X | GTX 980 | GTX 780 Ti | |
| GPU | GM200 | GM200 | GM204 | GK-110 |
| Fab Process | 28nm | 28nm | 28nm | 28nm |
| Texture Filter Rate (Bilinear) | 176GT/s | 192GT/s | 144.1GT/s | 210GT/s |
| TjMax | 92C | 91C | 95C | 95C |
| Transistor Count | 8B | 8B | 5.2B | 7.1B |
| ROPs | 96 | 96 | 64 | 48 |
| TMUs | 176 | 192 | 128 | 240 |
| CUDA Cores | 2816 | 3072 | 2048 | 2880 |
| Base Clock (GPU) | 1000MHz | 1000MHz | 1126MHz | 875MHz |
| Boost Clock (GPU) | 1075MHz | 1075MHz | 1216MHz | 928MHz |
| GDDR5 Memory / Memory Interface | 6GB / 384-bit | 12GB / 384-bit | 4GB / 256-bit | 3GB / 384-bit |
| Memory Bandwidth (GPU) | 336.5GB/s | 336.5GB/s | 224GB/s | 336GB/s |
| Mem Speed | 7Gbps | 7Gbps | 7Gbps (9Gbps effective - read below) | 7Gbps |
| Power | 1x8-pin 1x6-pin | 1x8-pin 1x6-pin | 2x6-pin | 1x6-pin 1x8-pin |
| TDP | 250W | 250W | 165W | 250W |
| Output | 3xDisplayPort 1xHDMI 2.0 1xDL DVI | 3xDisplayPort 1xHDMI 2.0 1xDual-Link DVI | DL-DVI HDMI 2.0 3xDisplayPort 1.2 | 1xDVI-D 1xDVI-I 1xDisplayPort 1xHDMI |
| MSRP | $650 | $1000 | $550 now $500 | $600 |
Familiar Maxwell Architecture & Memory Subsystem
Because the 980 Ti uses nVidia's existing Titan X GM200 GPU, nothing has changed in terms of processor architecture or its subsystems. The only real differences are illustrated by way of slightly reduced core count – 2816 CUDA cores versus 3072 CUDA cores on the TiX – and halved memory on-board.
For purposes of this review, everything we wrote about Maxwell's architecture and memory subsystems in our GTX 980 and GTX 960 reviews will hold true. We'll briefly recap just a few of the core items before moving on, though, just for a refresher.
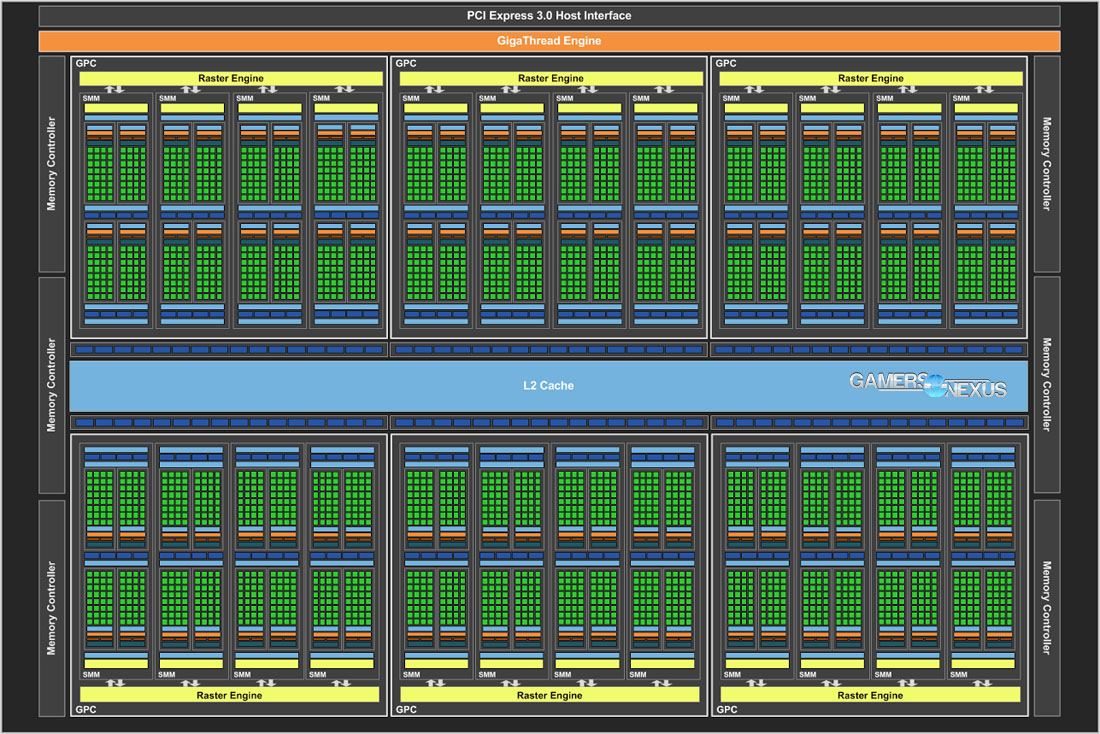
This is the GM200 die. Hosted on this piece of silicon are 22 streaming multiprocessors, each with 128 CUDA cores. The total core count is 2816, but Titan X enables a few additional cores for a total of 3072. The GM200 used herein offers a 384-bit memory interface, operating at 7GHz (effective) memory clock. Extrapolating from this, the 980 Ti has a total of 336.5GB/s of memory bandwidth available for its 6GB GDDR5 VRAM. 96 ROPs and 176 TMUs are present, with 3MB of L2 Cache.
GM200 assigns 96KB of shared memory to each SM against Kepler's 64KB shared memory (780 Ti) that were also used as L1 Cache. GM200 hosts an additional 48KB pool of memory per SMM.
For reference, the GTX 980 hosts 2048 CUDA cores, a 256-bit interface, 64 ROPs, 128 TMUs, and a 224GB/s bandwidth.
The memory subsystem of Maxwell boasts the utilization of efficiency-focused compression techniques, one of which is called “Delta Color Compression.” These techniques are applied to graphics processing in a way that increases the performance efficiency of CUDA cores by roughly 40%. Within the gaming world, this means that lower CUDA core count – seen in the 780 Ti / 980 Ti disparity – and a smaller memory interface can still output equal or superior power. Outside of gaming, professional applications that don't make use of Maxwell's compression techniques may likely excel on an older device with greater core count. This exits the scope of our article, though, and won't be explored here.
The GM200 is not a full double-precision chip, excluding the Titan X and 980 Ti from their older Titan siblings in simulation use case scenarios.
Read more about how delta color compression, MFAA, and other Maxwell technologies work in our GTX 980 review.
DirectX 12_1 Feature Level Support
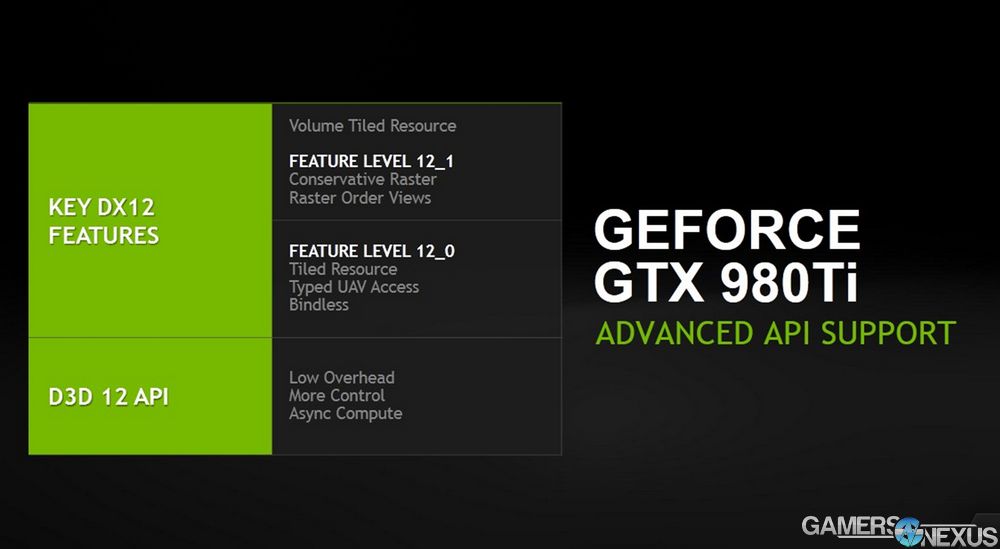
DirectX 12 deserves its own section in our review. Microsoft's new API is just around the corner, slated to replace Dx11 as Windows 10 rolls-out, and promises support for technologies that aim to improve graphics fidelity. We previously conducted an API overhead test that pitted Dx12 against Dx11 and Mantle (consumed to become Vulkan), but there's more to the API than bandwidth reduction and load balancing.
NVidia and Microsoft are making their rounds this week with discussions on Dx 12_1 feature level support items, like conservative rastering and volume tiled resources. It should be heavily emphasized that, although the 980 Ti is being marketed alongside these features, it is not required to take advantage of them. Any DirectX feature level 12_1 video card will support conservative raster and raster order views, with 12_0 supporting tiled resources. Just wanted to clear that up.
To quickly divert from the 980 Ti review, let's take a top-level look at conservative rastering and volume tiled resources.
Dx12 Conservative Raster & Volume Tiled Resources
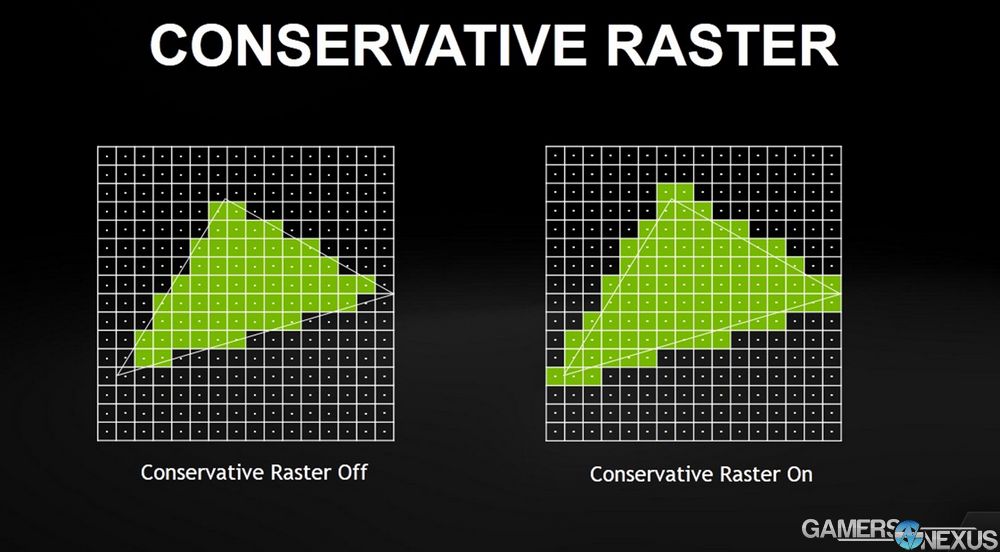
Rastering analyzes the geometry of an in-game object and translates it into pixels. This is done by taking a sample from the center of the pixel – similar in part to how filtration techniques (AA, AF) sample pixels for colors – and then determines whether that pixel is inside or outside of nearby geometry. If the center of the pixel falls inside the geometry, the pixel will be represented by 'green' in the above image.
The problem with this approach is that pixels which are partially contained within geometry – but whose centers are over the line – will fall outside of the 'green' selection window above. This introduces an undesirable shimmering effect in the produced graphic, resulting in fine details losing fluidity and appearing more jagged. In the below image, a shadow is shown to illustrate the difference between a normal raster approach and conservative rastering.
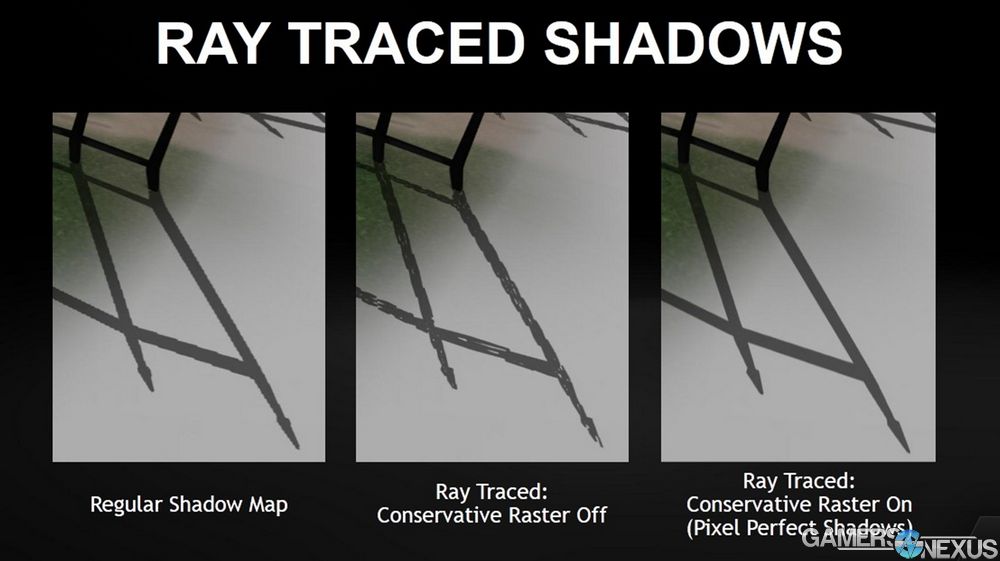
You'll notice that the shadow's edges are jagged and 'pixelated' in one image. To avoid this in the future, conservative raster (Dx feature level 12_1) analyzes the pixels touching geometry borders, then includes any pixels in contact as “in” the geometry. These included pixels expand the border marginally and smooth the image drawn to the screen, going through any normal filtering processes alongside inclusion with the geometry.
The primary means to leverage conservative raster will be through shaded elements, where precision dictates the smoothness of a shadow's appearance in-game. NVidia points toward ray-traced shadows as a possibility when using conservative raster, an approach that can aim to replace shadow mapping in its sub-optimal use cases. Ray tracing – as with light and reflectivity – can be deployed to locate an object's edge, creating a shadow as necessary. Using Dx 12_1 and 12_0 features, game developers can use conservative raster to reduce the cost of deploying ray tracing by creating a data structure that informs the GPU on how it should locate object edges.
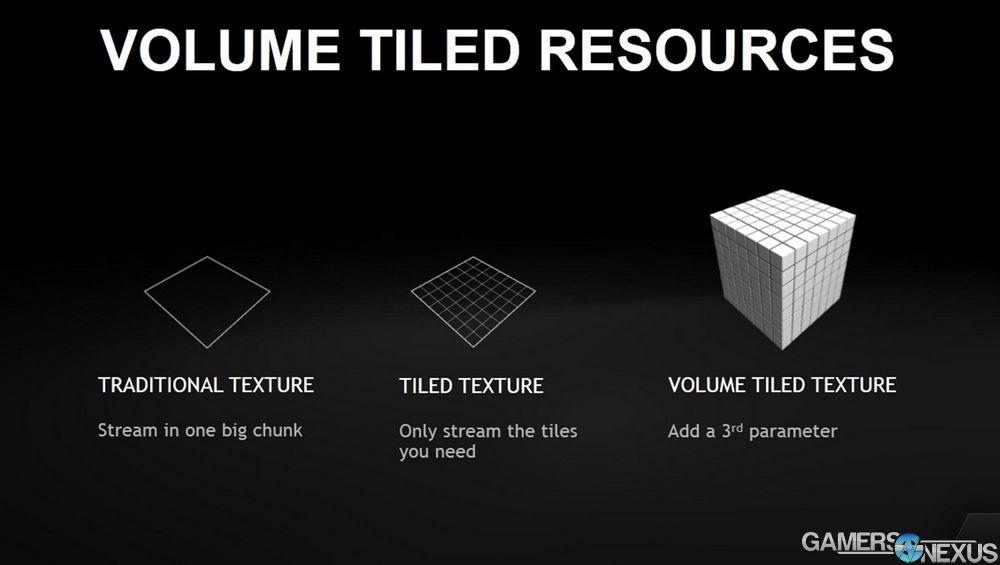
As for volume tiled resources, it's another upgrade to the ancient tiled resources graphics technique, something partially innovated by Richard Garriott (see that interview here).
Introducing the “volume” prefix to “tiled resources” changes things. Volume tiled resources allow the addition of a third parameter to game data structures – that parameter might be, consequently, volume – and aid in load reduction on the GPU when deploying assets for rendering. This is done by ensuring a scene is drawn only with the parts of the texture files that are required, restricting memory access (and processing power) only to assets that will be visually displayed to the user. Maybe a particular texture is substantially larger than the object it's applied to; in this case, volume tiled resources ensure that only the usable area of the texture is drawn and stored, reducing load requirement by eliminating the unused texture components from the pipeline.
NVidia likes to use sparse fluid simulation to best illustrate this discussion point. Smoke, as below, is vastly comprised of empty space (air) that doesn't need to be fed resources in games. The volumetric approach to tiled resources ensures that “focus” is afforded only to actual smoke particles, ignoring all empty air in the vicinity of the smoke cloud. More efficient processing is the end result.
Volume tiled resources allow items to be split into textured picture elements, known to most as texels, and limit focus in areas that are otherwise unoccupied or unnecessary to the scene.
Target Market: 1440, 4K, & VR
Back to the GTX 980 Ti.
The 980 Ti's target market is clearly the higher resolution gaming crowd. Virtual reality support was discussed during our time with nVidia, as seems to be the trend of late, but performant 1440p and 4K output was readily touted as a strong point.
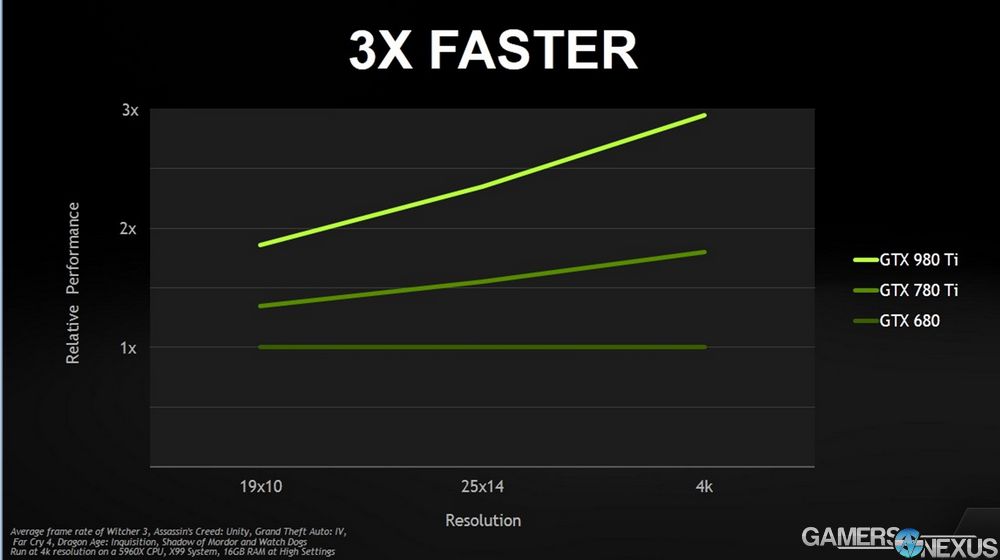
The above image was provided by nVidia, but corresponds with some of our below testing. This shows the scaling effect of higher resolutions on previously released cards – like the 780 Ti, which has nearly a 3x disparity against the 980 Ti in high resolution performance. Closer to 1080p, the gap shrinks, but additional bandwidth and processing power through increased core efficiency (above) ensure greater 1440 to 4K performance on Maxwell architecture.
Continue to Page 2 for the benchmark results.
Video Card Test Methodology
We tested using our updated 2015 GPU test bench, detailed in the table below. Our thanks to supporting hardware vendors for supplying some of the test components. Thanks to Jon Peddie Research for GTX 970 & R9 280X support.
The latest GeForce press drivers were used during testing. AMD Catalyst 15.5 was used. Game settings were manually controlled for the DUT. Stock overclocks were left untouched for stock tests.
VRAM utilization was measured using in-game tools and then validated with MSI's Afterburner, a custom version of the Riva Tuner software. Parity checking was performed with GPU-Z. FPS measurements were taken using FRAPS and then analyzed in a spreadsheet.
Each game was tested for 30 seconds in an identical scenario on the two cards, then repeated for parity.
| GN Test Bench 2015 | Name | Courtesy Of | Cost |
| Video Card | NVIDIA | $650 | |
| CPU | Intel i7-4790K CPU | CyberPower | $340 |
| Memory | 32GB 2133MHz HyperX Savage RAM | Kingston Tech. | $300 |
| Motherboard | Gigabyte Z97X Gaming G1 | GamersNexus | $285 |
| Power Supply | NZXT 1200W HALE90 V2 | NZXT | $300 |
| SSD | HyperX Predator PCI-e SSD | Kingston Tech. | TBD |
| Case | Top Deck Tech Station | GamersNexus | $250 |
| CPU Cooler | Be Quiet! Dark Rock 3 | Be Quiet! | ~$60 |
Average FPS, 1% low, and 0.1% low times are measured. We do not measure maximum or minimum FPS results as we consider these numbers to be pure outliers. Instead, we take an average of the lowest 1% of results (1% low) to show real-world, noticeable dips; we then take an average of the lowest 0.1% of results for severe spikes.
We conducted a large suite of real-world tests, logging VRAM consumption in most of them for comparative analysis. The games and software tested include:
- Far Cry 4 (Ultra 1080, Very High 1080).
- GRID: Autosport (Ultra 1440, Ultra 4K).
- Metro: Last Light (Very High + Very High tessellation at 1080; High / High at 1440).
- GTA V (Very High / Ultra at 1080p).
- Shadow of Mordor (Very High, 1080p).
- 3DMark Firestrike Benchmark
- GTA V
- The Witcher 3
We already know ACU and Far Cry 4 consume massive amounts of video memory, often in excess of the 2GB limits of some cards. GRID: Autosport and Metro: Last Light provide highly-optimized benchmarking titles to ensure stability on the bench. Shadow of Mordor, GTA V, & Battlefield Hardline (not shown here) are new enough that they heavily eat RAM. 3DMark offers a synthetic benchmark that is predictable in its results, something of great importance in benchmarking.
Games with greater asset sizes will spike during peak load times, resulting in the most noticeable dips in performance on the 2GB card as memory caches out. Our hypothesis going into testing was that although the two video cards may not show massive performance differences in average FPS, they would potentially show disparity in the 1% low and 0.1% low (effective minimum) framerates. These are the numbers that most directly reflect jarring user experiences during “lag spikes,” and are important to pay attention to when assessing overall fluidity of gameplay.
Overclocked tests were conducted using MSI Afterburner for application of settings. All devices were tested for performance, stability, and thermals prior to overclocking to ensure clean results. On the OC bench, devices were set to maximize their voltage ceiling with incremental gains applied to the core clock (GPU) frequency. MSI Kombustor, which loads the GPU 100%, was running in the background. Once stability was compromised -- either from crashing or artifacting -- we attempted to resolve the issue by fine-tuning other OC settings; if stability could not be achieved, we backed-down the core clock frequency until we were confident of stability. At this point, the device was placed on a burn-in test using Kombustor and 100% load for 30 minutes. If the settings survived this test without logged fault, we recorded the OC settings and logged them to our spreadsheet.
Final OCs were applied and tested on two games for comparison.
Thermals were reported using Delta T over ambient throughout a 30-minute burn-in period using 3DMark FireStrike - Extreme, which renders graphics at 1440p resolution. This test loads the VRAM heavily, something Kombustor skips, and keeps the GPU under high load that is comparable to gaming demands. Temperatures were logged using MSI Afterburner.
GTX 980 Ti Benchmark – GTA V at 4K, 1080 vs. 980, Titan X, 290X, etc.
Following our GTA V benchmark, we revisit the game using the 980 Ti to determine FPS output at various settings.
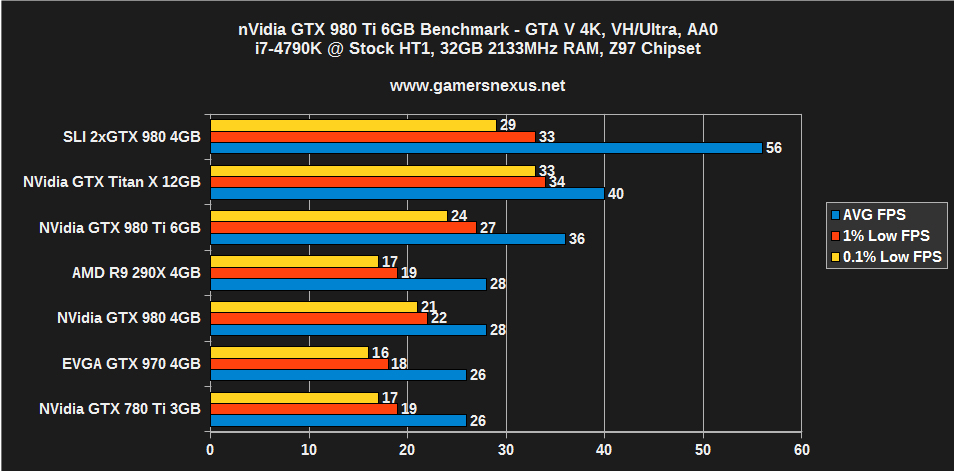
GTA V produces one of the most noticeable differences between the 980 Ti and Titan X – which is really saying something, considering there's an average 4FPS disparity between the two, though 99 and 99.9 percentile framerates are more noticeably gapped. This difference is likely resultant of GTA V's generous utilization of VRAM, a realm where the Titan X holds superiority strictly by capacity.
Still, the two cards are very similar in output. The GTX 980 and R9 290X output the same average FPS (depending on how you test the game – different scenes provoke trade-offs), but the 980 offers higher 1% and 0.1% metrics.
Either way, it's clear that none of these cards – sans the SLI solution – is particularly suited for GTA V at 4K with ultra settings (AA off; Advanced Graphics off). By lowering grass quality and a few other items that we defined in our GTA V performance optimization guide, 50 to 60FPS could be achieved at 4K with either the TiX or 980 Ti. There is no strong case to be made in favor of the TiX, though the 980 Ti wins-out in price.
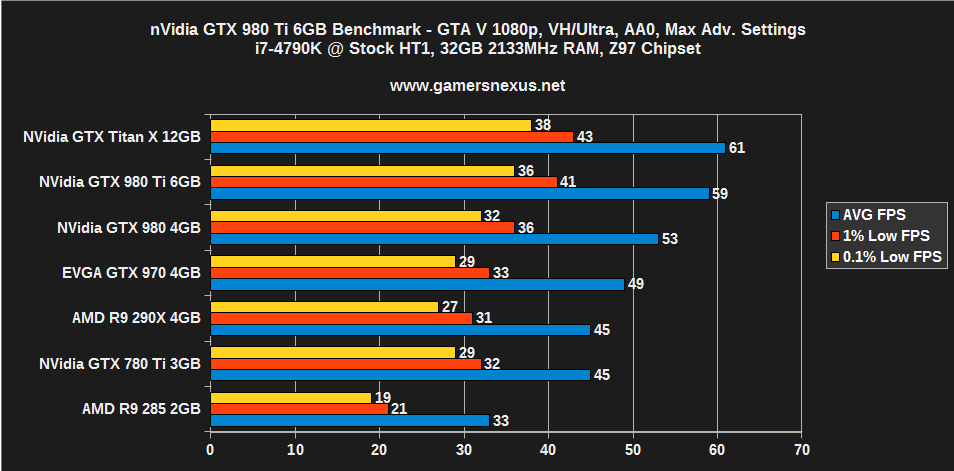
The gap shrinks at 1080p with max settings (AA off; Advanced Graphics maxed). The TiX and 980 Ti are effectively identical in performance, with the GTX 980 trailing closely – but at a noticeable gap – behind the two.
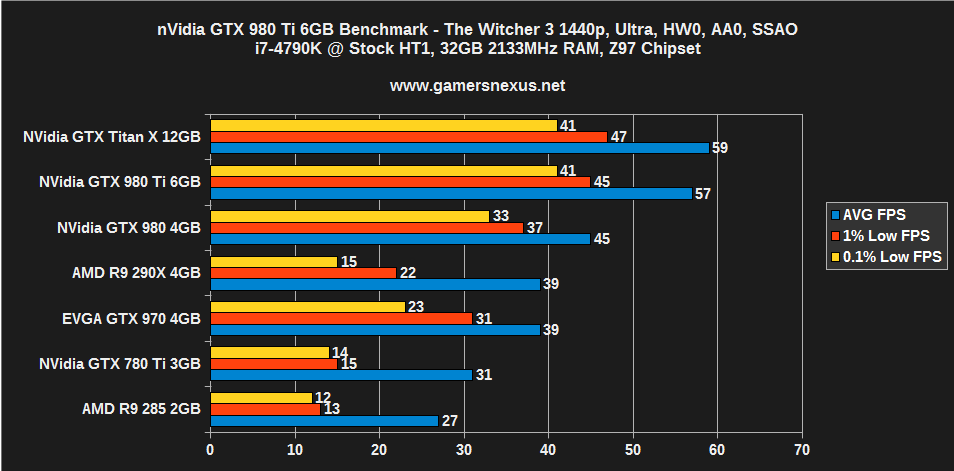
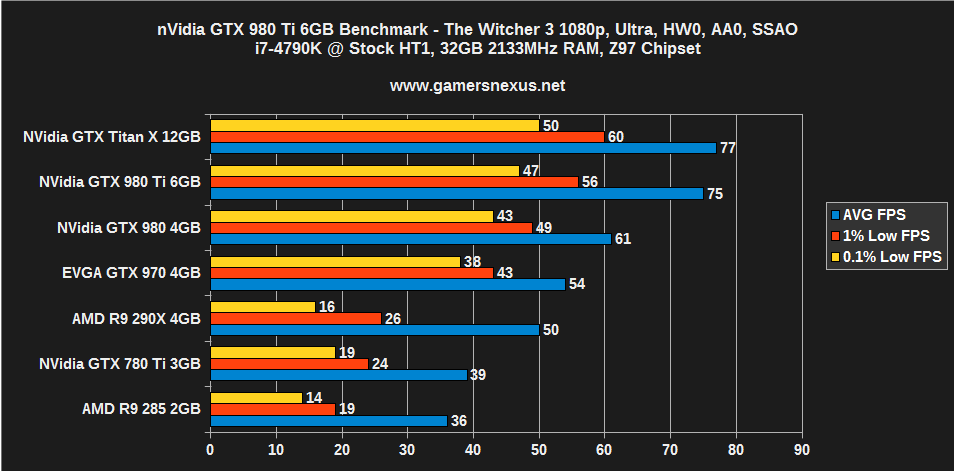
GTX 980 Ti Benchmark – The Witcher 3 at 4K, 1440, 1080
The Witcher 3 is an abusive game when it comes to system performance. Our original Witcher 3 benchmark called the game “poorly optimized,” but patches 1.03 and 1.04 substantially improved performance. These charts use the latest patch and exhibit boosted performance over launch day. Our optimization guide can be found here.
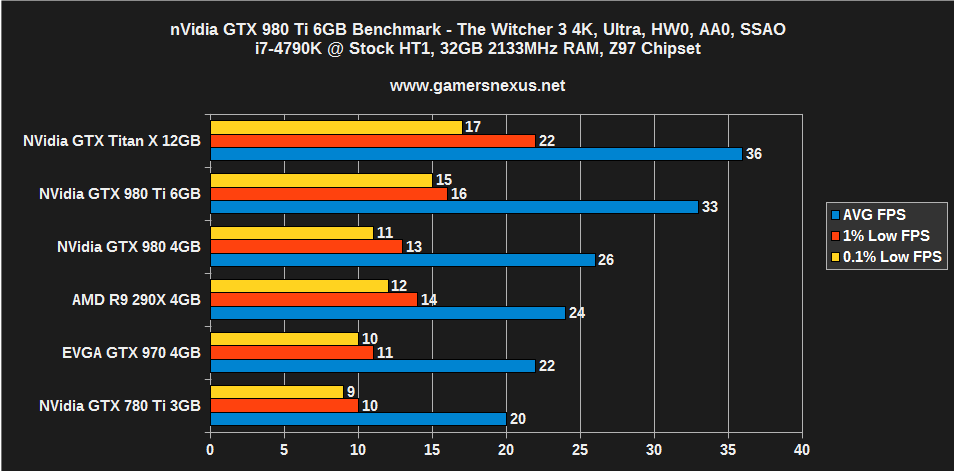
No card is particularly stunning at 4K, but there is a vast difference in performance between the 980 and 980 Ti. The TiX and 980 Ti are, again, unnoticeably similar.
Dropping foliage viewing distance would improve framerates to a point of near playability at 4K; other options could be reduced for further gains, but the Witcher will play best at 1440p on these high-end devices.
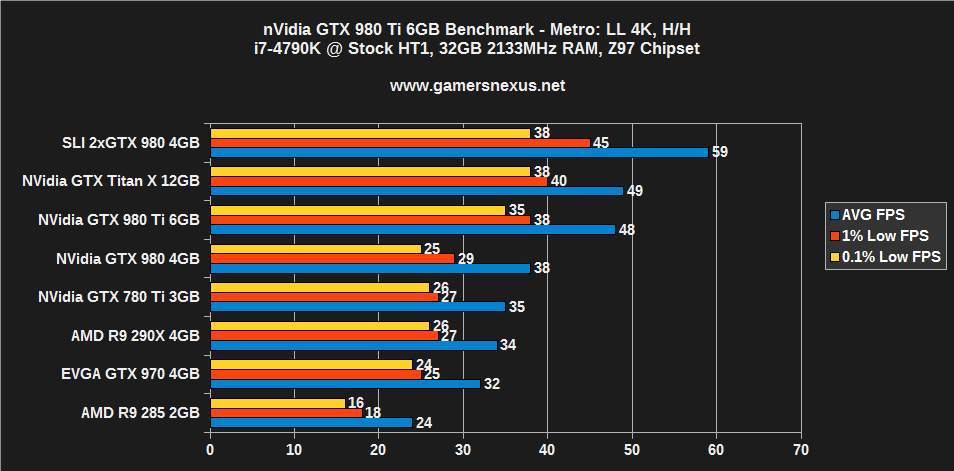
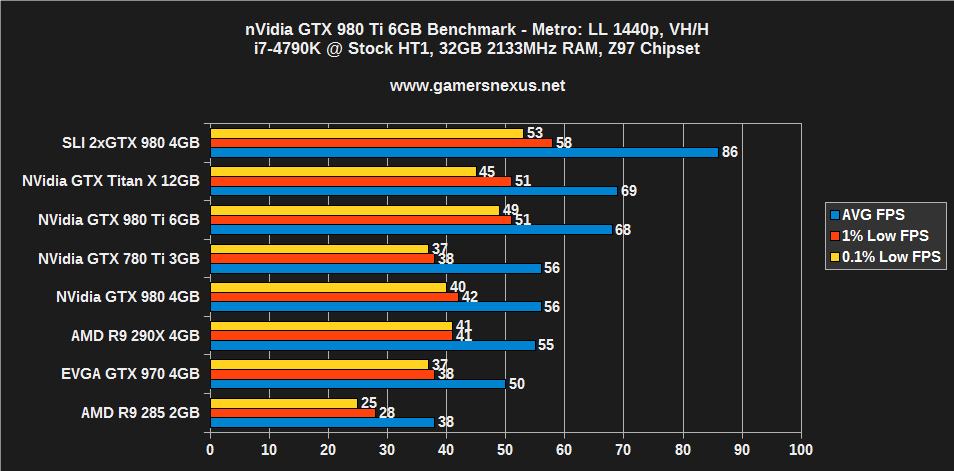
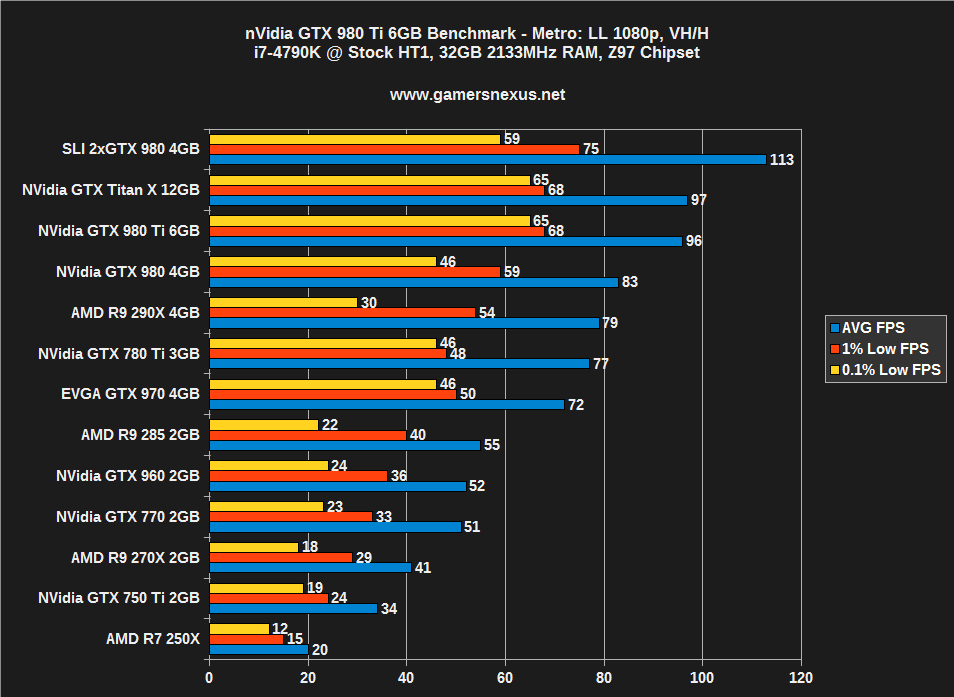
GTX 980 Ti Benchmark – Metro: Last Light at 4K, 1440, 1080 vs. 980, Titan X, etc.
Metro is one of the most consistent benchmarks we've ever used. In this case, the same holds true – there's no noticeable difference between the TiX and 980 Ti, but the GTX 980 trails a marked 10FPS behind in average output. This 10FPS gap is the difference between a playable game and reducing settings, and should be noted.
GTX 980 Ti Benchmark – Far Cry 4 at 4K, 1440, 1080 vs. 290X, Titan X, 980, 970
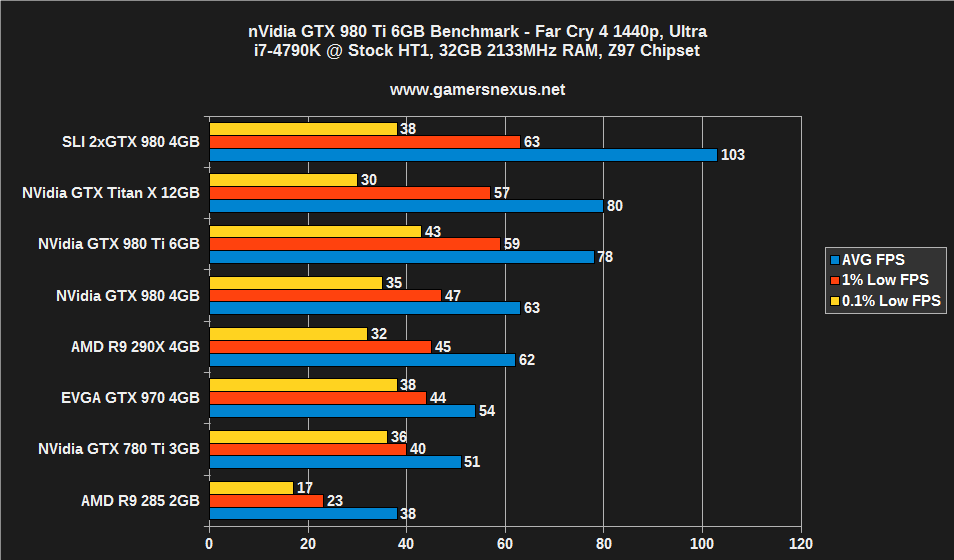
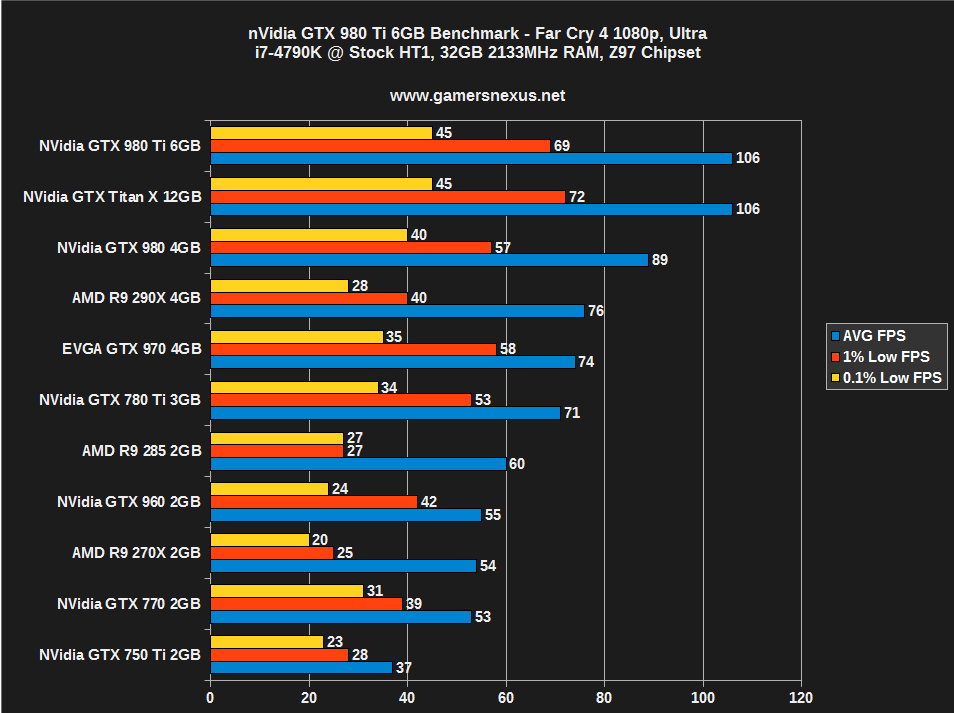
More of the same, here.
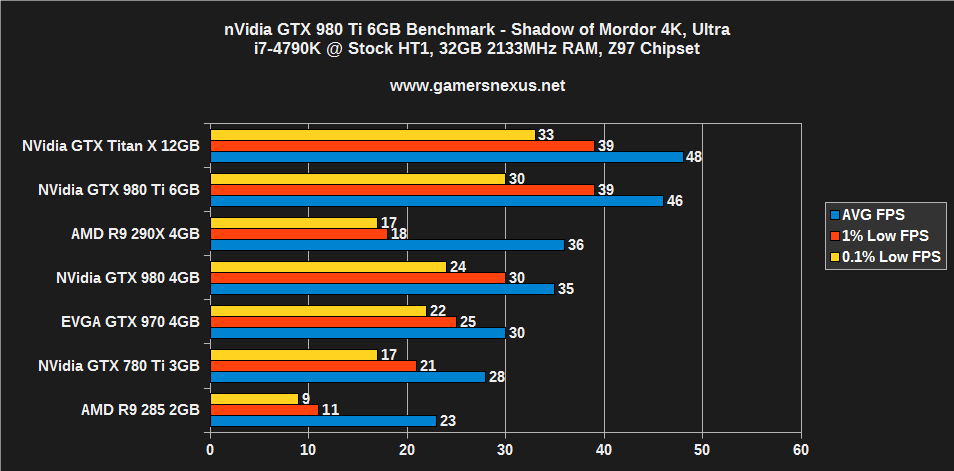
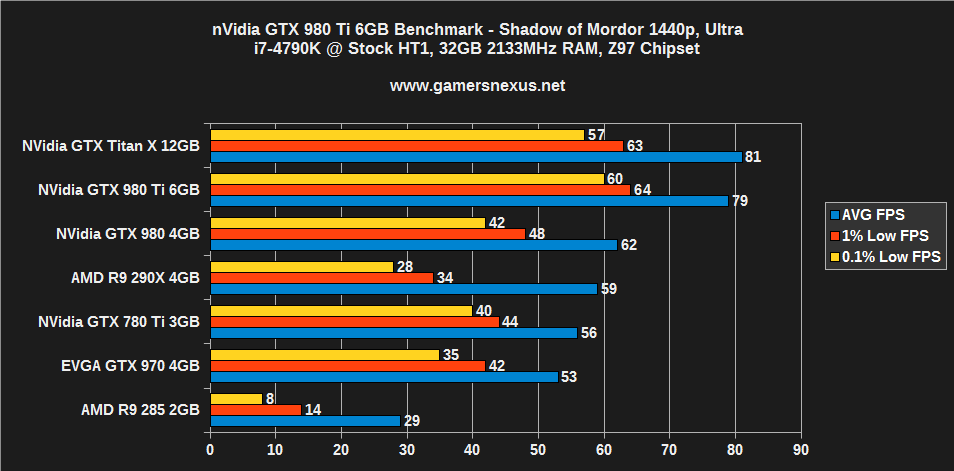
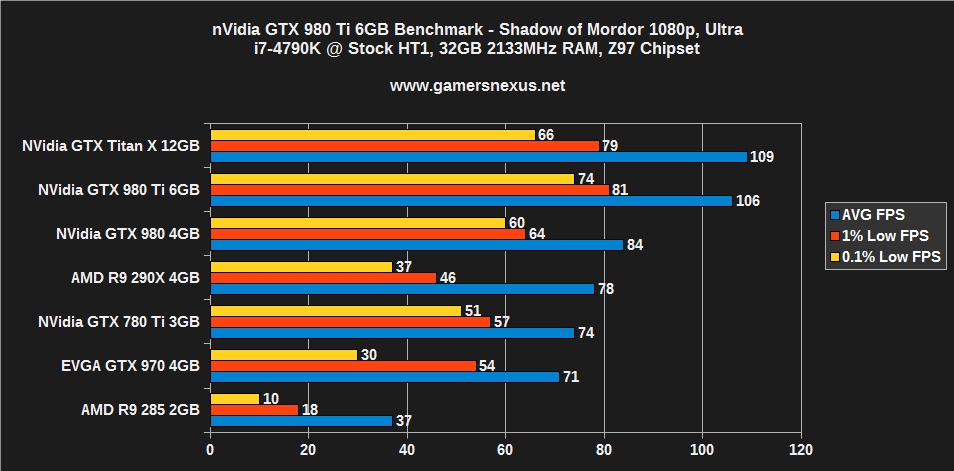
GTX 980 Ti Benchmark – Shadow of Mordor at 4K, 1440, 1080
Again, the gap between AMD's R9 290X ($280) – which has poorer frametimes (1% / 0.1% lows) than the other cards – and the GTX 980 trail noticeably behind the 980 Ti. The TiX and 980 Ti are effectively identical.
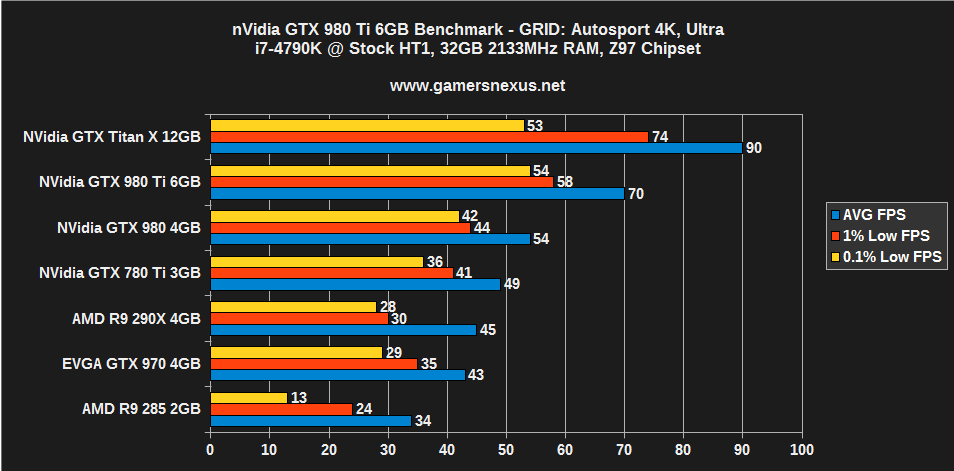
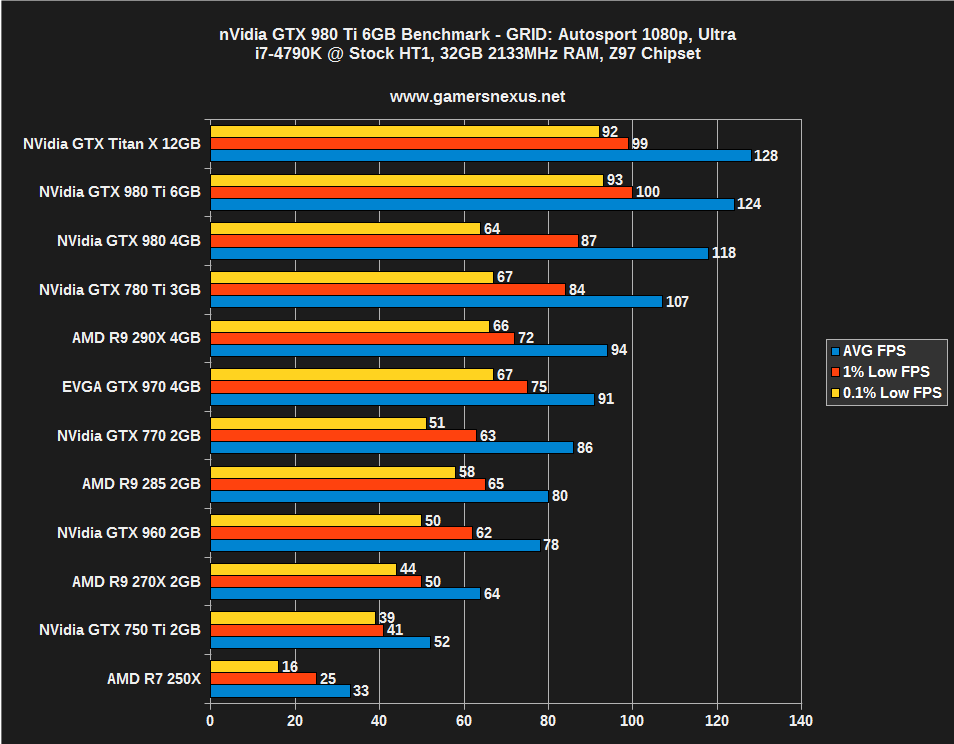
GTX 980 Ti Benchmark – GRID: Autosport at 4K, 1080
GRID finally produces a visible disparity between the TiX and 980 Ti, something we re-tested a few additional times for parity. The GTX 980 to 980 Ti gap is also noticeably larger than elsewhere. For GRID, a GTX 980 is still a passable solution for 4K / Ultra.
Overclocking the GTX 980 Ti (And Thermals) – Still to Come
UPDATE: Our overclocking results are now live. View the accompanying GTX 980 Ti overclocking article here.
At the time of this review our GTX 980 Ti is undergoing extensive burn-in testing for overclocking attempts. This review will be updated with overclocking results once we are confident that they have achieved stability – likely within a few hours of initial publication.
Conclusion: The GTX 980 Ti is a Fiercely Priced 4K Card
NVidia's GTX 980 Ti is interesting. At $650, it's only $100 away from where most GTX 980s will soon rest – or $150 from MSRP – and that makes it an appealing purchase. The performance delta between the 980 and 980 Ti is large enough that there are noticeable gains in higher resolution gaming, but that also doesn't relegate the 980 to the trash – it's still a viable gaming solution for most users. At 1080 especially, the GTX 980 would be a better buy of the two, just looking at pure value and famerate output.
 The Titan X never offered a particularly compelling argument for purchase, something further emphasized by our Titan X vs. SLI 980 testing (with the GTX 980s costing about the same). The card is a single-GPU powerhouse with an impressive amount of VRAM, but that VRAM just isn't put to use in modern games that we're aware of. For nearly all reasonable gaming use cases, the GTX 980 Ti is a substantially better purchase and offers comparatively unbeatable value for high-resolution performance.
AMD is slated to announce its impending GPUs in an official capacity at some point in the immediate future – there's a press conference at Computex on Tuesday, which sounds promising – but as of now, the company can't touch nVidia's single GPU performance. The 295X2 is not present for testing, but wouldn't be a linear comparison anyway given the two GPU approach to processing.
The 980 Ti doesn't invalidate the GTX 980 and owners shouldn't feel “buyer's remorse” for a purchase, though some manufacturers may offer step-up programs should an upgrade be desired. As far as we're concerned, the GTX 980 remains a powerful, cost-efficient card, but builders with slightly more cash should seriously consider the upgrade to a Ti if building for 1440 or 4K.
- Steve “Lelldorianx” Burke.