AMD's RX 480 Reference received our recommendation as a go-to for the $200-$300 market, but was immediately challenged by the release of the GTX 1060; the choice isn't so clear now, but both cards have appropriate use cases. Still, as with the Founders Edition card reviews, we recommended that our readers wait until AIB partner models of the RX 480 begin shipping, as the cooling performance will improve clock-rate stability on the Polaris 10 chip.
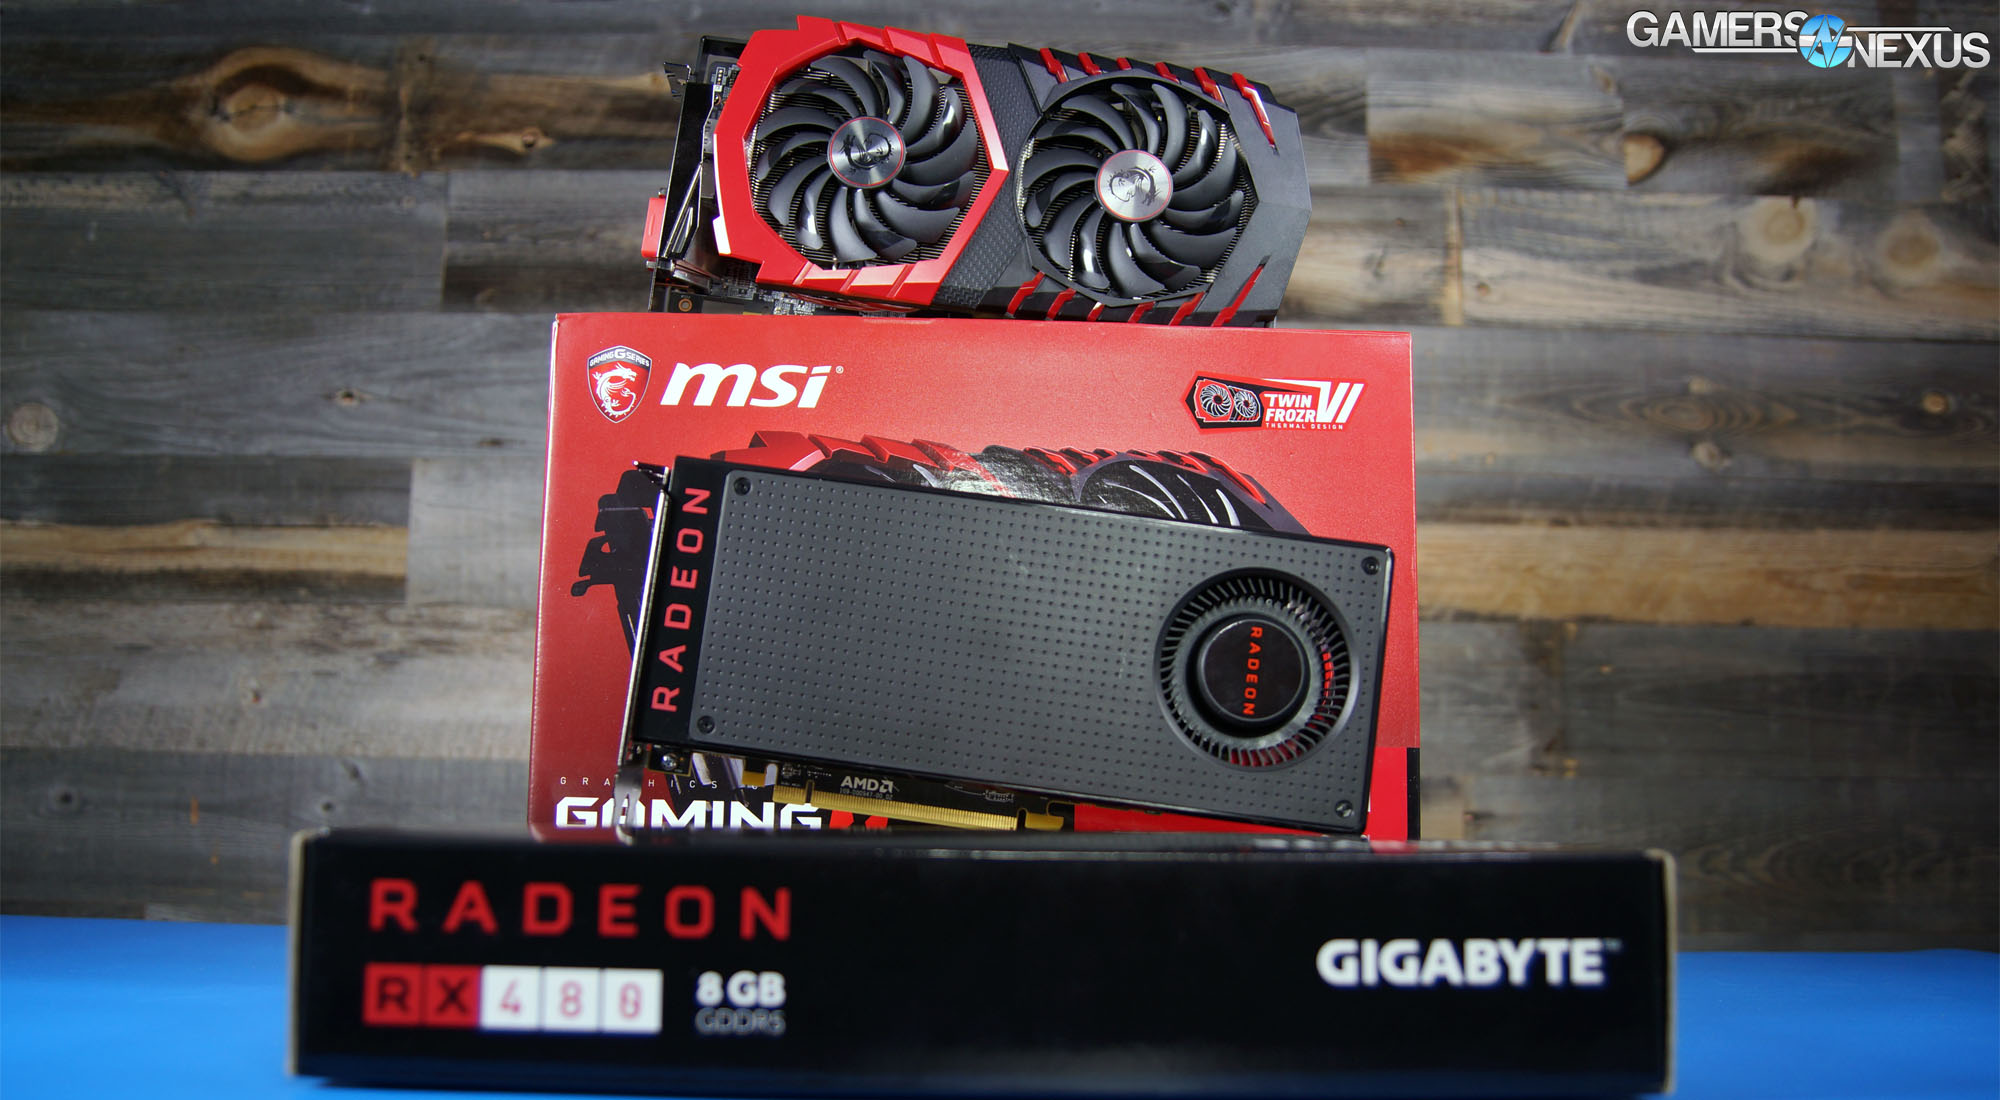
We finally received one of those AIB partner models. The MSI RX 480 Gaming X uses the Twin Frozr VI cooling solution – described in our Computex exclusive – and ships pre-overclocked to 1303MHz from ~1266MHz. The 8GB card's price should rest at $265, or $15 more than the reference RX 480 8GB ($250), and MSI will also be selling 4GB variants of the Gaming X. Our previous coverage of the RX 480 4GB vs. 8GB will help answer questions as to whether the lower capacity card is worth it.
Here's the specs listing of the RX 480, including reference clock-rate:
AMD RX 460, RX 470, & RX 480 Specs
| AMD RX 480 | AMD RX 470 | AMD RX 460 | |
| Architecture | Polaris 10 | Polaris 10 | Polaris 11 |
| Compute Units (CUs) | 36 | 32 | 14 |
| Stream Processors | 2304 | 2048 | 864 |
| Base / Boost Clock | 1120MHz / 1266MHz | 926MHz / 1206MHz | 1090MHz / 1200MHz |
| COMPUTE Performance | >5 TFLOPS | Up to 4.9TFLOPs | Up to 2.2TFLOPs |
| Graphics Command Processor (GCP) | 1 | 1 | 1 |
| ACEs | 4 | 4 (?) | 2 |
| HWS | 2 | 2 (?) | 2 |
| TMUs | 144 | 128 | 56 |
| ROPs | 32 | 32 | 16 |
| Geometry Processors | 4 | 4 (?) | 2 |
| Peak Texture Filter Rate | 182.3GT/s | 154.4GT/s | 57.6GT/s |
| Peak Pixel Filter Rate | 40.5GP/s | 38.6GP/s | 19.2GP/s |
| L2 Cache | 2MB | ? | 1MB |
| LSU | 576x32b | ? | 256x32b |
| VRAM Capacity | 4GB GDDR5 @ 7Gbps 8GB GDDR5 @ 8Gbps | 4GB GDDR5 | 2GB GDDR5 |
| Memory Interface | 256-bit | 256-bit | 128-bit |
| Memory Speed | 7Gbps (4GB model) 8Gbps (8GB model) | 6.6Gbps | 7Gbps |
| Memory Bandwidth | 224GB/s (4GB model) 256GB/s (8GB model) | 211GB/s | 112GB/s |
| TDP | 150W | 120W* | 75W |
| Power Connectors | 6-pin | 6-pin | None (Slot only) |
| Display Port | 1.3 HBR / 1.4 HDR | 1.3/1.4 HDR | 1.3/1.4 HDR |
| Release Date | June 29 | August 4 | August 8 |
Polaris 10 vs. Polaris 11 Specs & Architecture
| Polaris 10 | Polaris 11 | |
| Compute Units (CUs) | 36 | 16 |
| COMPUTE Performance | “>5 TFLOPS” | “>2 TFLOPS” |
| Memory Interface | 256-bit | 128-bit |
| Architecture | Gen 4 GCN | Gen 4 GCN |
| Playback Support | 4K encode/decode | 4K encode/decode |
| Output Standard | DP1.3/1.4 HDR | DP1.3/1.4 HDR |
MSI makes a few changes to this:
MSI RX 480 Gaming X Specs
| MSI RX 480 Gaming X | AMD RX 480 Reference | |
| Architecture | Polaris 10 | Polaris 10 |
| GPU | Ellesmere | Ellesmere |
| Fab Process | 14nm FinFET | 14nm FinFET |
| Stream Processors | 2304 | 2304 |
| Core / Boost Clock | 1303MHz | 1120 / 1266MHz |
| Memory Capacity | 4GB or 8GB | 4GB or 8GB |
| Memory Interface | 256-bit | 256-bit |
| Memory Clock | 8Gbps | 8Gbps |
| Release Date | Mid August | June 29 |
| Price | $265 | $250 |
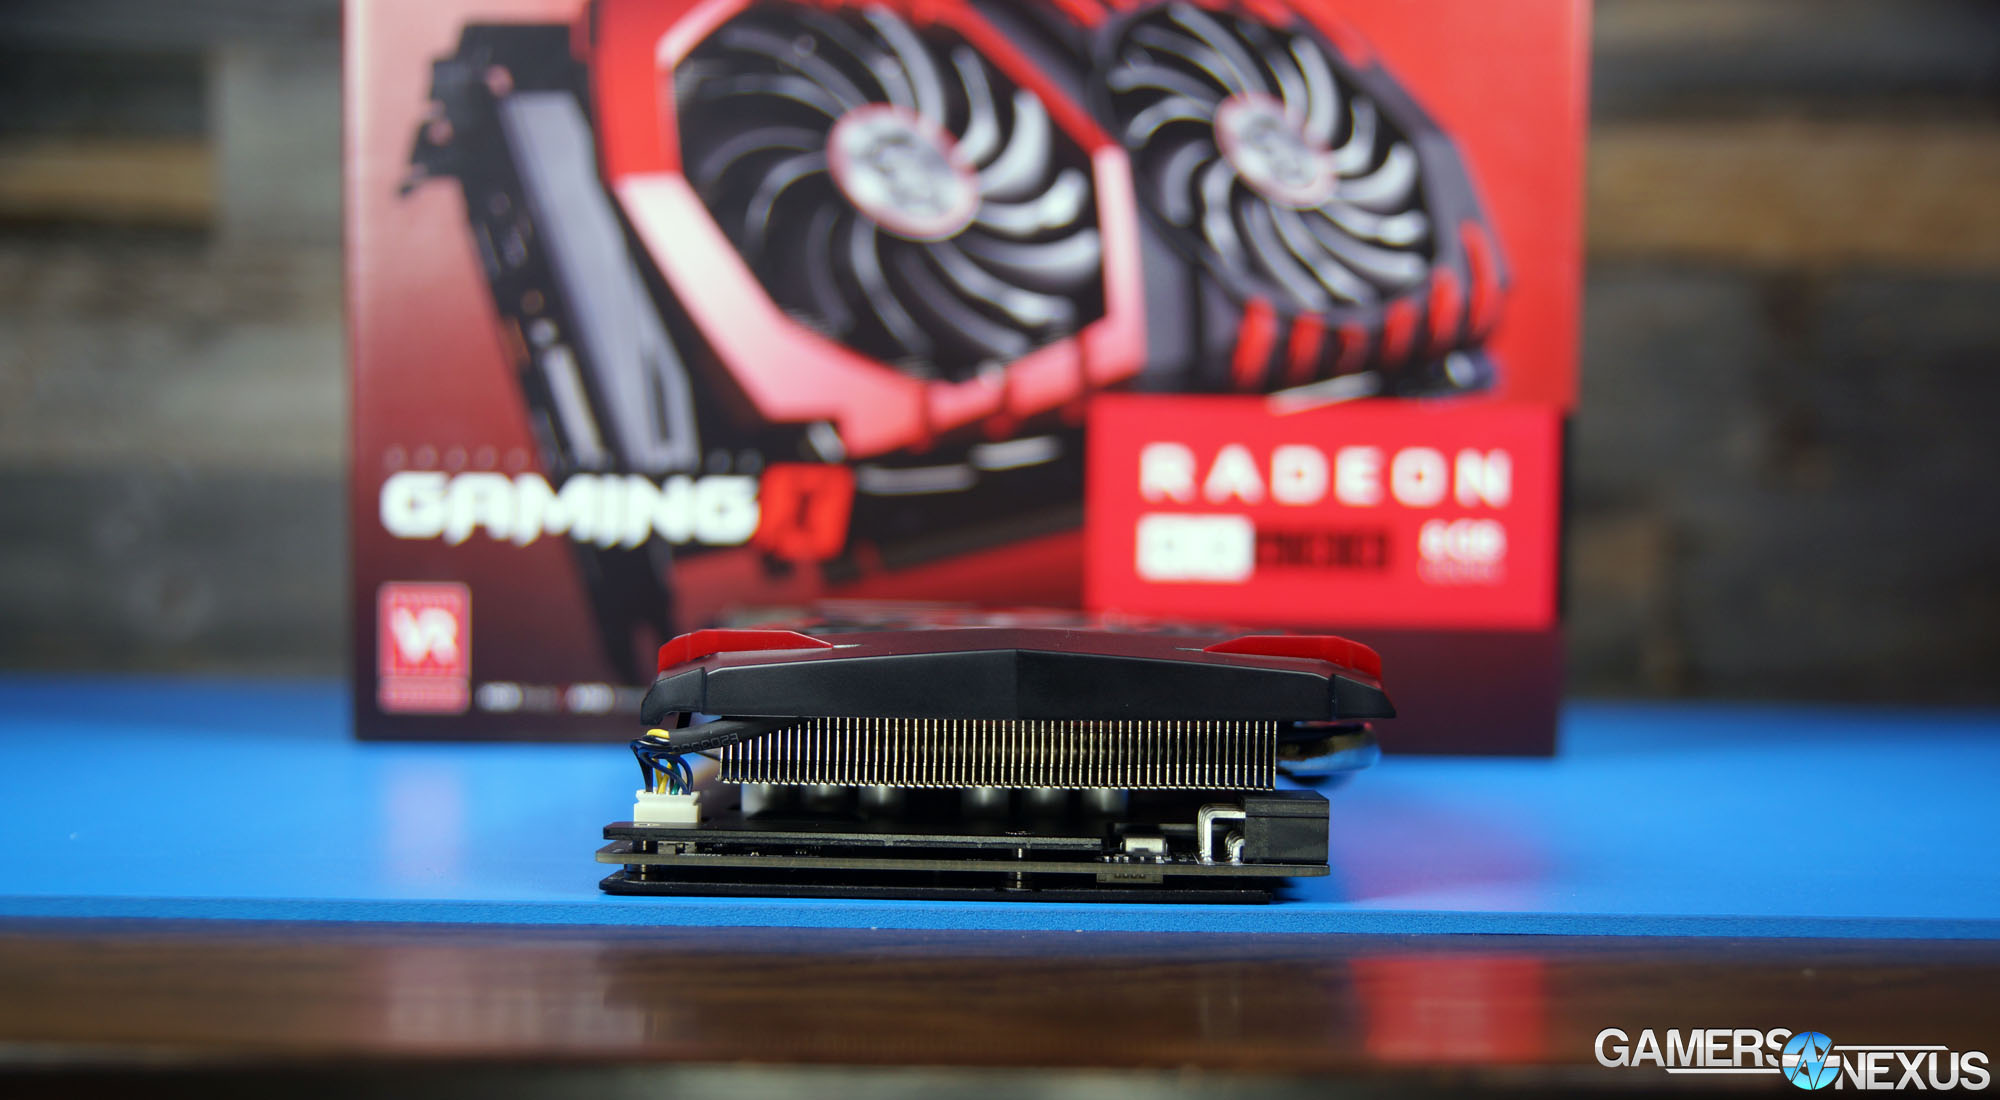
MSI advertises the core clock as reaching up to 1316MHz, though we measured output around 1303MHz on average. The pre-overclocked card includes MSI's Twin Frozr VI cooler, using a dual-push fan cooling solution and large aluminum heatsink for passive dissipation. As with every other Twin Frozr VI cooler we've recently looked at, the RX 480 Gaming X's implementation allows the card to operate at 0RPM fan speeds for temperatures lower than 60C. This operation prioritizes silence, an effective 0dB output, and allows the heatsink to perform its duties of sinking the lower heat generation.
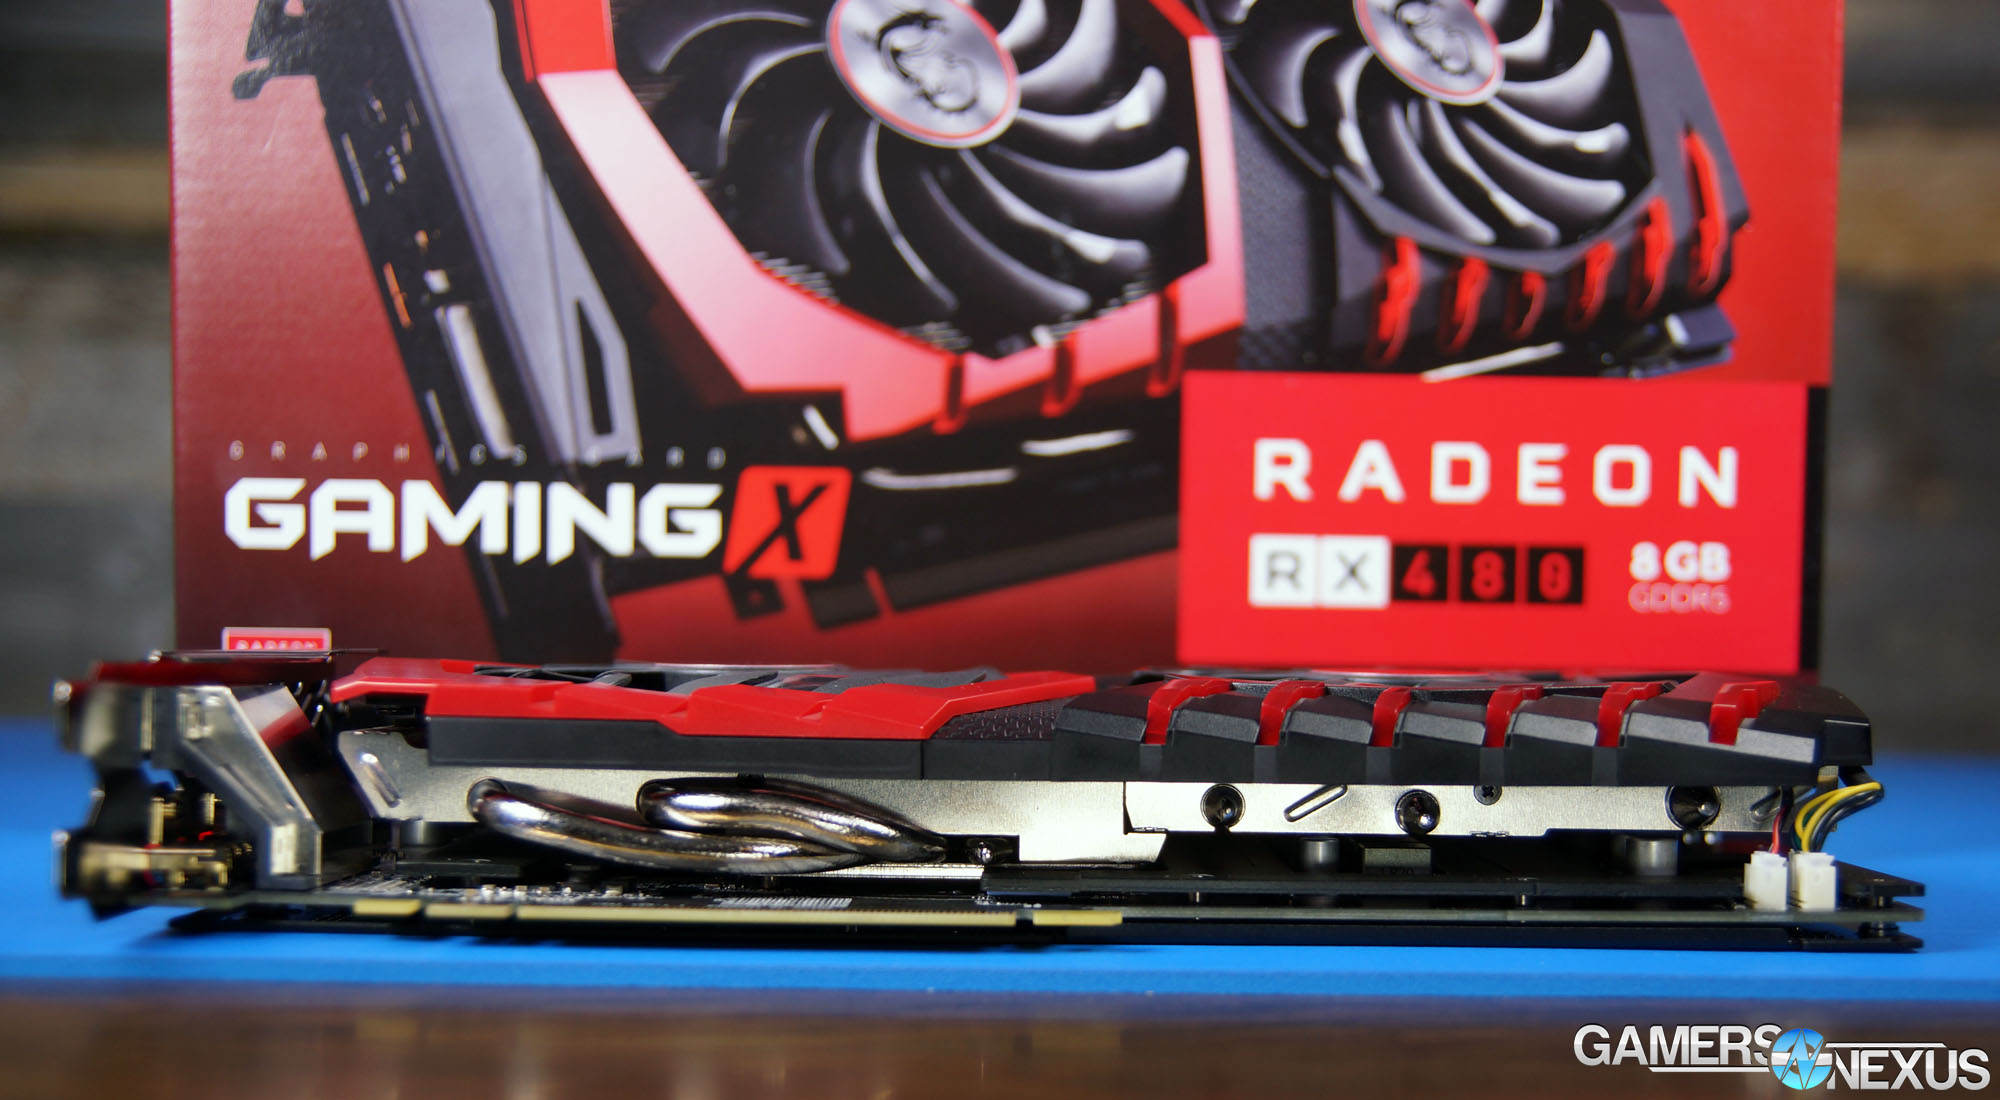
Aiding that conduction are the three heatpipes routed through the copper coldplate, measured at 8mm, 6mm, and 6mm. MSI's newest version (VI) of the Twin Frozr cooler uses a squared-out heatpipe toward the coldplate, which helps ensure maximum surface area contact between the coldplate, aluminum fins, and the heatpipe itself. The rest of the pipes are the usual rounded design, but the tapered/squaring design is new with this generation.
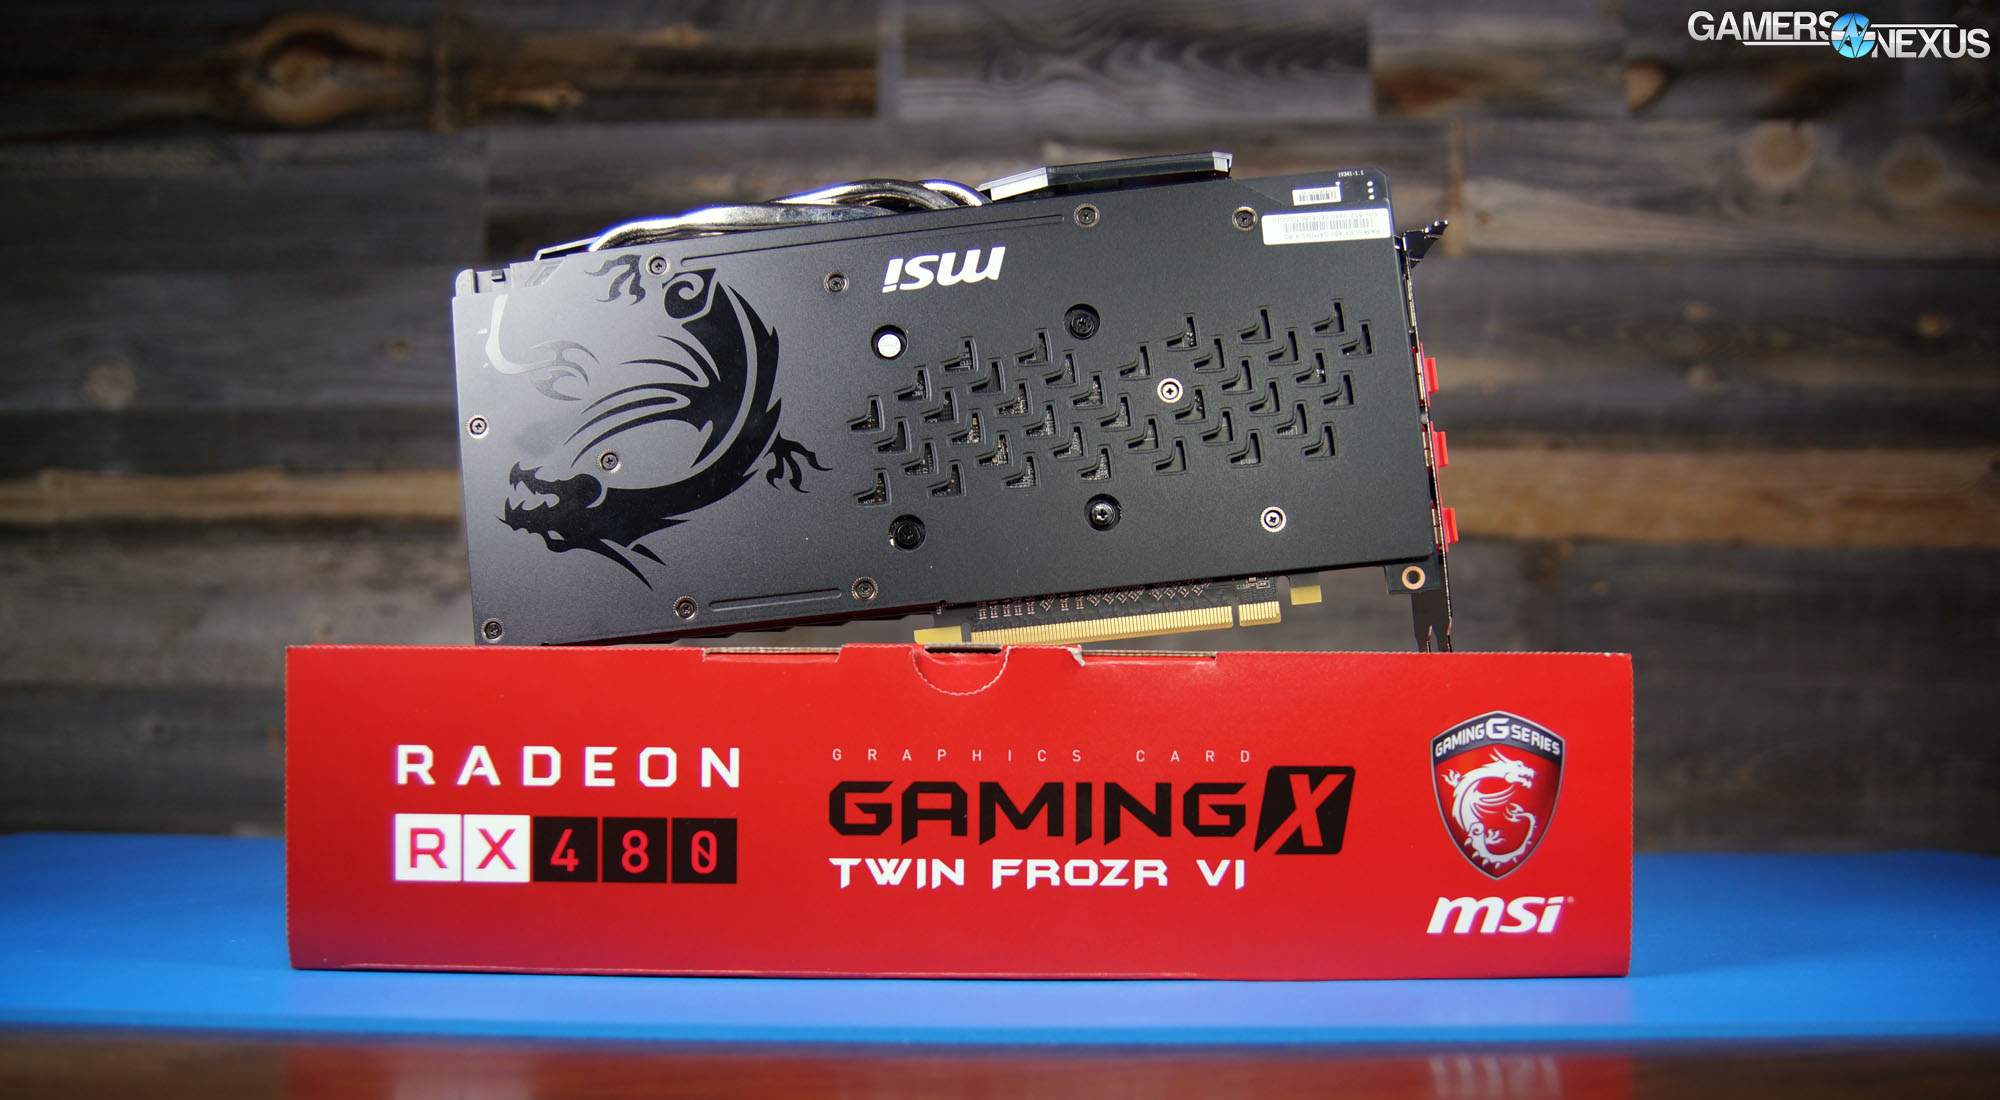
MSI's custom PCB is flanked by a thick baseplate and backplate – one on either side – used for structural and thermal advantages. The structural impact is likely obvious: The card won't experience sag in the same fashion that an unsupported card with a large heatsink might. Thermally, the baseplate is outfitted with thermal pads that make direct contact to the VRAM modules and MOSFETs. This sinks heat across the surface of the baseplate, which is then cooled actively by air intake from the axial fans. The PWM is also engaged by the baseplate.
New alternating dispersion / traditional fan blades ensure that air gets trapped and propelled into the fins. The PCB is also larger than reference (in width and height), allowing for the large fans mounted to the card.
The MSI card we received was shipped at its maximum clock-rate setting, though users of the MSI software will be able to switch between different “modes;” these modes allow prioritization of silence, performance, or a mix between the two. The software further enables RGB LED light management, found embedded within the nametag of the card.
Looking down the right side of the cooler, we're able to see the chokes, capacitors, and fan cables. MSI's fan cables are easily accessible in the lower-right of the card – though not quite as well designed as Sapphire's Nitro – and can be swapped by the user if necessary for RMA.
Continue to page 2 for testing methodology.
Game Test Methodology
We tested using our GPU test bench, detailed in the table below. Our thanks to supporting hardware vendors for supplying some of the test components.
The latest AMD drivers were skipped for testing, following serious stability issues. 16.7.2 were used for testing GTA V & DOOM (incl. Vulkan patch) on the RX 480. Drivers 16.6.2 were used for all other devices or games. NVidia's unreleased 368.64 drivers were used for game (FPS) testing on the GTX 1060. The 368.69 drivers were used for other devices. Game settings were manually controlled for the DUT. All games were run at presets defined in their respective charts. We disable brand-supported technologies in games, like The Witcher 3's HairWorks and HBAO. All other game settings are defined in respective game benchmarks, which we publish separately from GPU reviews. Our test courses, in the event manual testing is executed, are also uploaded within that content. This allows others to replicate our results by studying our bench courses. In AMD Radeon Settings, we disable all AMD "optimization" of graphics settings, e.g. filtration, tessellation, and AA techniques. This is to ensure that games are compared as "apples to apples" graphics output. We leave the application in control of its graphics, rather than the IHV. In NVIDIA's control panel, we disable G-Sync for testing (and disable FreeSync for AMD).
Windows 10-64 build 10586 was used for testing.
Each game was tested for 30 seconds in an identical scenario, then repeated three times for parity.
Average FPS, 1% low, and 0.1% low times are measured. We do not measure maximum or minimum FPS results as we consider these numbers to be pure outliers. Instead, we take an average of the lowest 1% of results (1% low) to show real-world, noticeable dips; we then take an average of the lowest 0.1% of results for severe spikes.
| GN Test Bench 2015 | Name | Courtesy Of | Cost |
| Video Card | This is what we're testing! | - | - |
| CPU | Intel i7-5930K CPU | iBUYPOWER | $580 |
| Memory | Corsair Dominator 32GB 3200MHz | Corsair | $210 |
| Motherboard | EVGA X99 Classified | GamersNexus | $365 |
| Power Supply | NZXT 1200W HALE90 V2 | NZXT | $300 |
| SSD | HyperX Savage SSD | Kingston Tech. | $130 |
| Case | Top Deck Tech Station | GamersNexus | $250 |
| CPU Cooler | NZXT Kraken X41 CLC | NZXT | $110 |
For Dx12 and Vulkan API testing, we use built-in benchmark tools and rely upon log generation for our metrics. That data is reported at the engine level.
Video Cards Tested
- MSI RX 480 Gaming X
- MSI GTX 1060 Gaming X ($290)
- NVIDIA GTX 1060 FE ($300)
- AMD RX 480 8GB ($240)
- NVIDIA GTX 1080 Founders Edition ($700)
- NVIDIA GTX 980 Ti Reference ($650)
- NVIDIA GTX 980 Reference ($460)
- NVIDIA GTX 980 2x SLI Reference ($920)
- AMD R9 Fury X 4GB HBM ($630)
- AMD MSI R9 390X 8GB ($460)
- And more
Thermal Test Methodology
We strongly believe that our thermal testing methodology is the best on this side of the tech-media industry. We've validated our testing methodology with thermal chambers and have proven near-perfect accuracy of results.
Conducting thermal tests requires careful measurement of temperatures in the surrounding environment. We control for ambient by constantly measuring temperatures with K-Type thermocouples and infrared readers. We then produce charts using a Delta T(emperature) over Ambient value. This value subtracts the thermo-logged ambient value from the measured diode temperatures, producing a delta report of thermals. AIDA64 is used for logging thermals of silicon components, including the GPU diode. We additionally log core utilization and frequencies to ensure all components are firing as expected. Voltage levels are measured in addition to fan speeds, frequencies, and thermals. GPU-Z is deployed for redundancy and validation against AIDA64.
All open bench fans are configured to their maximum speed and connected straight to the PSU. This ensures minimal variance when testing, as automatically controlled fan speeds will reduce reliability of benchmarking. The CPU fan is set to use a custom fan curve that was devised in-house after a series of testing. We use a custom-built open air bench that mounts the CPU radiator out of the way of the airflow channels influencing the GPU, so the CPU heat is dumped where it will have no measurable impact on GPU temperatures.
We use an AMPROBE multi-diode thermocouple reader to log ambient actively. This ambient measurement is used to monitor fluctuations and is subtracted from absolute GPU diode readings to produce a delta value. For these tests, we configured the thermocouple reader's logging interval to 1s, matching the logging interval of GPU-Z and AIDA64. Data is calculated using a custom, in-house spreadsheet and software solution.
Endurance tests are conducted for new architectures or devices of particular interest, like the GTX 1080, R9 Fury X, or GTX 980 Ti Hybrid from EVGA. These endurance tests report temperature versus frequency (sometimes versus FPS), providing a look at how cards interact in real-world gaming scenarios over extended periods of time. Because benchmarks do not inherently burn-in a card for a reasonable play period, we use this test method as a net to isolate and discover issues of thermal throttling or frequency tolerance to temperature.
Our test starts with a two-minute idle period to gauge non-gaming performance. A script automatically triggers the beginning of a GPU-intensive benchmark running MSI Kombustor – Titan Lakes for 1080s. Because we use an in-house script, we are able to perfectly execute and align our tests between passes.
Continue to page 3 for thermals & endurance.
MSI RX 480 Gaming X Thermal Benchmark vs. Reference
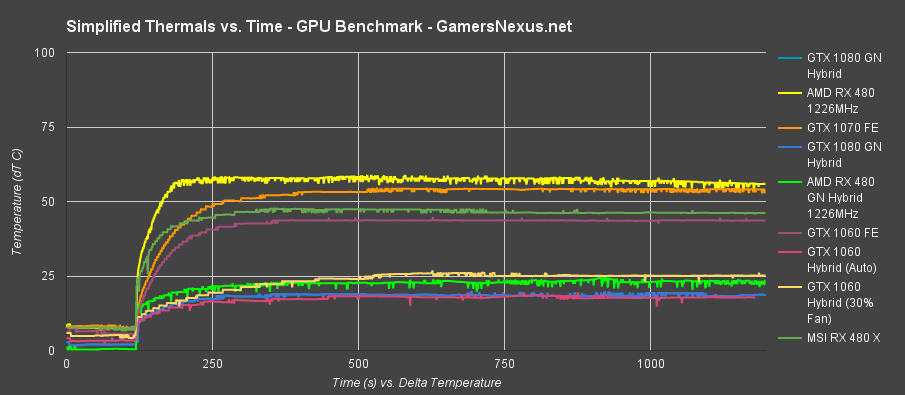
Our thermal testing is some of the most extensive of all our tests. The first chart is a simplified “peak average thermals” chart, making for easier comparison between coolers and load/idle values. The chart presents our over time data with averages across several hundred rows.
These numbers are produced as a “delta T over ambient” value, meaning that we subtract ambient from the results. Because simply checking a thermostat and relying on a single ambient value produces significant variance in results, we use a thermocouple reader with K-Type thermocouples for active logging of the test environment's ambient temperature. The ambient value is subtracted second-to-second from the logged GPU Diode value.
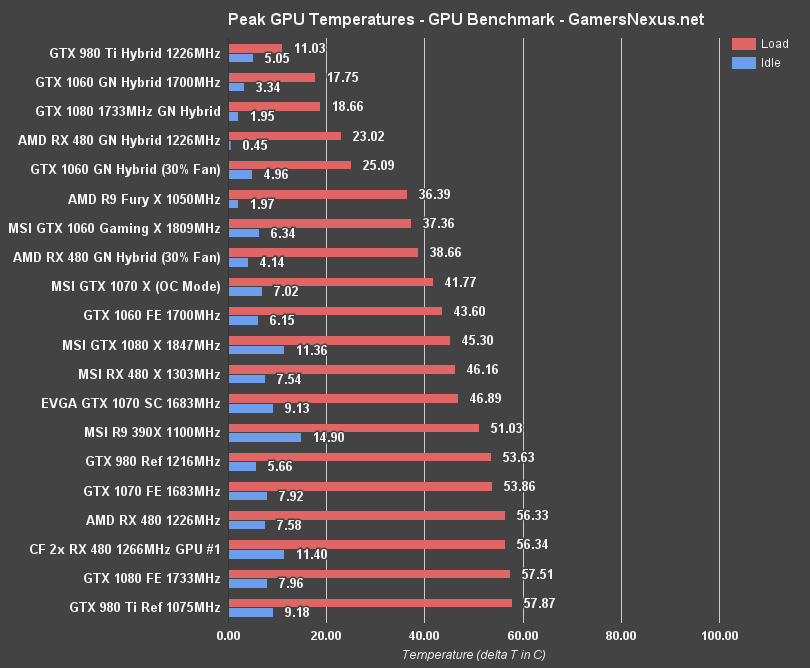
The peak average temperature (delta T over ambient) of the MSI RX 480 Gaming X, using MSI's updated Twin Frozr VI cooler, posts a load output of 46.16C, with an idle of 7.54C. The 7.54C temperature is sustained solely with the heatsink; no fans are enabled during idle with the MSI card.
The reference RX 480 from AMD performs about 10C warmer (~56C) in its delta T value, and does so with higher fan RPMs (the nature of a small blower fan) and higher noise output. If you missed our RX 480 “Hybrid” project, we put the reference GPU & PCB under water and cooled it with an Arctic Hybrid kit. That's also present in this chart, posting a temperature of ~23C load and ~0.45C idle (delta T over ambient, again).
MSI RX 480 Gaming X Thermals Over Time
The below chart shows the thermals as plotted against time. This helps us validate results internally, but also presents data in a different view:
The test begins execution at the 120-second mark, pursuant to our in-house scripting & automation for thermal testing.
MSI RX 480 Gaming X Clock Stability vs. Reference
Our endurance benchmarks run the cards for a few-hour burn-in, checking for clock-rate stability over time as it opposes thermals. For the reference RX 480, we saw fairly stable clock-rate output, but it was still variable within the base-to-boost range. Here's a look at that:
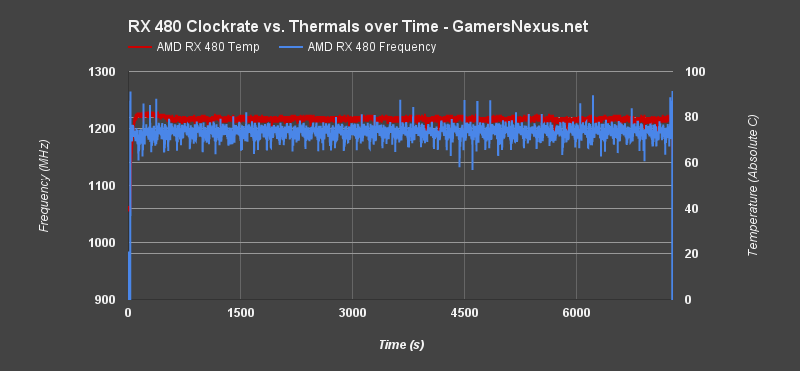
(Note: Above scale is different from below; we do this to highlight the swings).
The chart above shows frequency & temperature versus time. Notice that the clock-rate fluctuates constantly, mostly an attempt to control thermals to the stock target 80C within the Radeon software.
By throwing an aftermarket cooler onto the card, the clock-rate is largely flattened (improved) to output a more stable clock-rate. We saw this in the RX 480 Hybrid testing. Here's a look at MSI's endurance run:
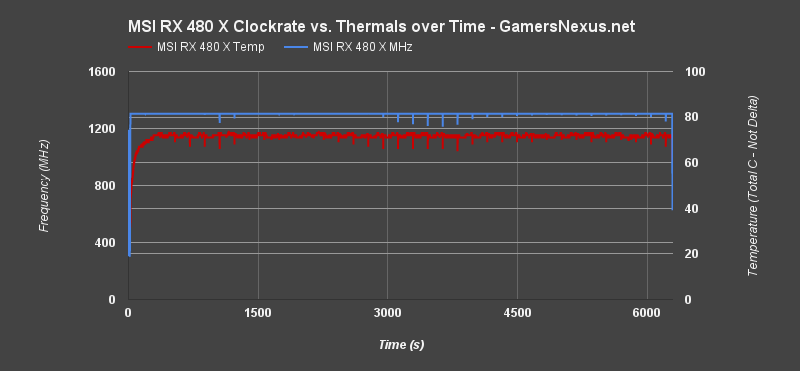
Much flatter. There are only a few dips below the boosted 1303MHz clock-rate.
Continue to page 4 for Dx12 & Vulkan benchmarks.
Dx12, Vulkan, OpenGL Benchmarks vs. Dx11
This page explores performance using the new DirectX 12 and Khronos Group Vulkan APIs, leveraging a few game/benchmark titles to compare metrics versus DirectX 11. Comparative testing between Dx12 and Vulkan uses only average FPS (as opposed to our OpenGL & Dx11 tests, which use AVG, 1% low, and 0.1% low frametimes). We're able to simplify charts for a more head-to-head comparison in this regard, and we then produce separate charts (see: Ashes) for frame latency differences.
Some of this data is shown as percent change or ms latency, so it is not all just straight FPS. The charts help us look at async compute performance and acceptance of new APIs. OpenGL (DOOM) is also present.
Comparative Dx12 vs. Dx11 FPS in Ashes of Singularity – MSI RX 480 vs. Reference
Ashes of the Singularity is more of a benchmark than a game at this point, but it is still one of the few games built ground-up with Dx12 in mind. This makes Ashes a better representation of Dx12's capabilities than games which were just wrapped with a new API call.
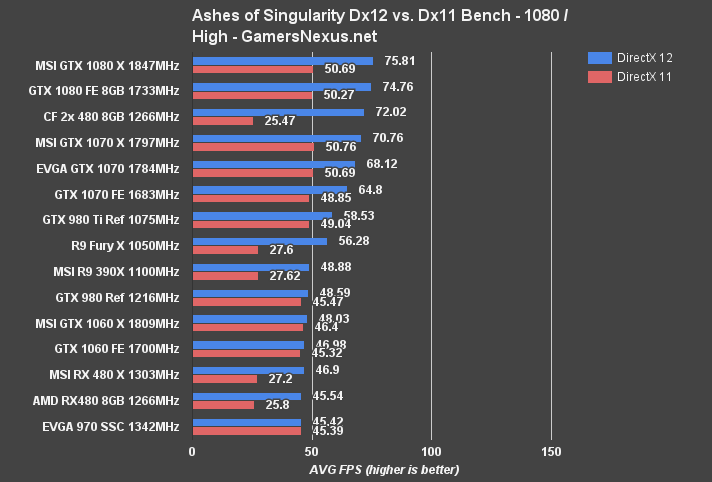
We're seeing a performance output of ~46.9FPS AVG on the MSI RX 480, with the reference card at 45.54FPS AVG for Dx12. The Dx11 performance is, as it always has been with this game, dismal for AMD. Dx12 sees large scaling gains.
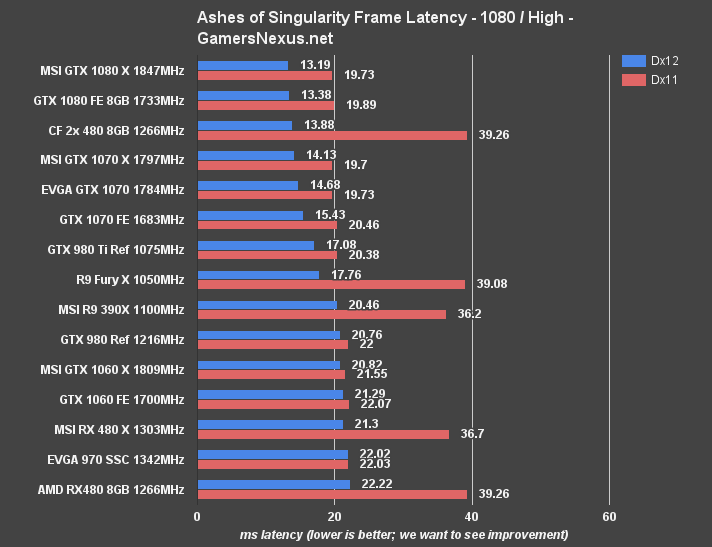
Average frametimes improve with the MSI card, resultant of its boosted clock-rate, landing the card at ~21.3ms AVG time between frames for Dx12.
DOOM Benchmark – Vulkan vs. OpenGL on RX 480 vs. GTX 1060, 390X
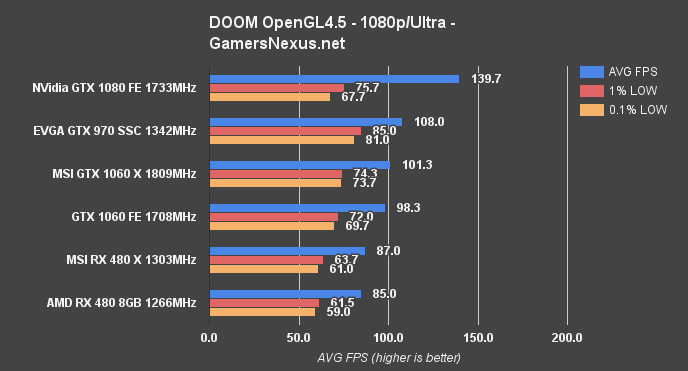
Using OpenGL only – we're not on the Vulkan comparison yet – the MSI RX 480 drives DOOM at 1080p/Ultra with an average FPS output of 87. The reference card runs at 85FPS, just a few points lower. 1% and 0.1% low values are comparable between the two devices. The GTX 1060 outperforms the RX 480 in OpenGL, operating at 98.3FPS AVG.
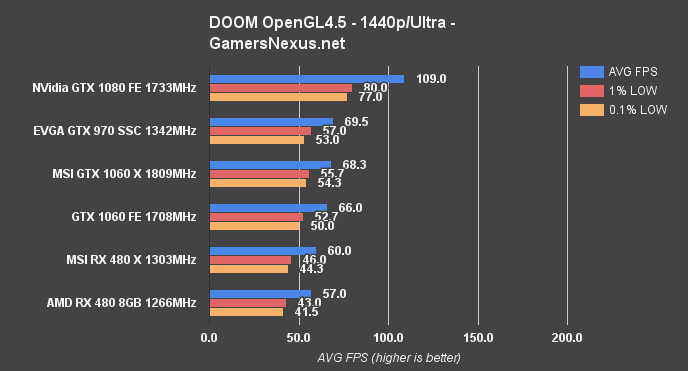
At 1440p (OGL only), we're seeing a difference of 5% between the reference RX 480 and MSI RX 480 Gaming X. The GTX 1060 FE pushes 66FPS and higher 1% / 0.1% low metrics.
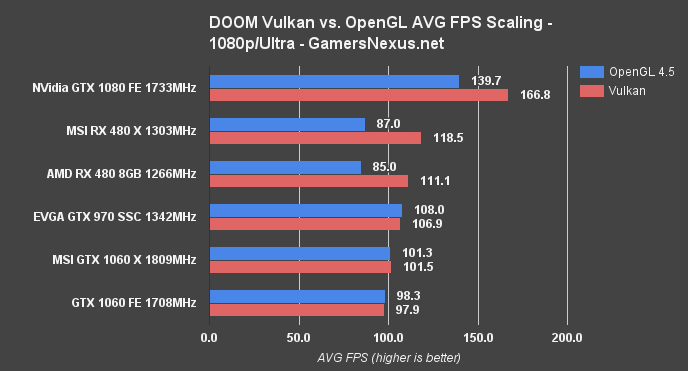
Vulkan changes things considerably. The RX 480 reference card is now at 111FPS AVG, with the MSI RX 480 Gaming X at 118.5FPS AVG. The GTX 1060 FE is nearly identical in performance to its OpenGL throughput, at 97.9FPS. That plants the GTX 1060 FE, which was ahead in OGL, behind the RX 480.
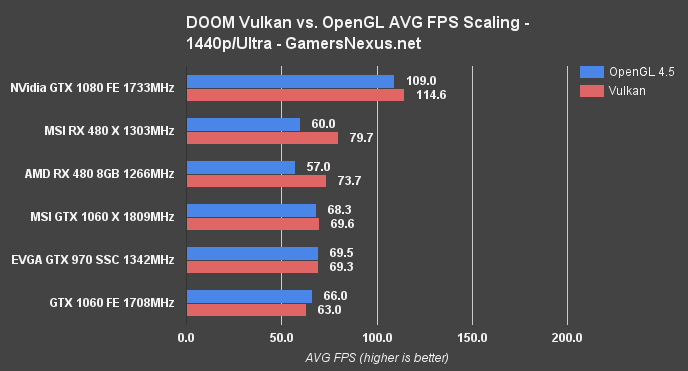
1440p is similar, the RX 480 Gaming X at nearly 80FPS and reference at 74FPS, with the 1060 Gaming X (also an MSI card) at 69.6FPS.
Continue to page 5 for Dx11 benchmarks.
Black Ops 3 Benchmark – MSI RX 480 Gaming X v. GTX 1060, 1070, 390X
Black Ops III tends to show more favorable performance on AMD hardware, which makes it an interesting benchmark title. The game is also exceptionally well optimized for its graphics quality, and routinely exceeds 100FPS at 1080p High.
At 1080p, the MSI RX 480 hits 144FPS AVG, with 117FPS 1% lows and 111FPS 0.1% lows. That's a good gain over the reference RX 480, which is at 132.3FPS AVG, equating a difference of 8.5%. BLOPS3 is a fairly clock-sensitive game. In this instance, the AIB partner card is enough of a jump with the pre-OC to differentiate between 144Hz gaming and just under.
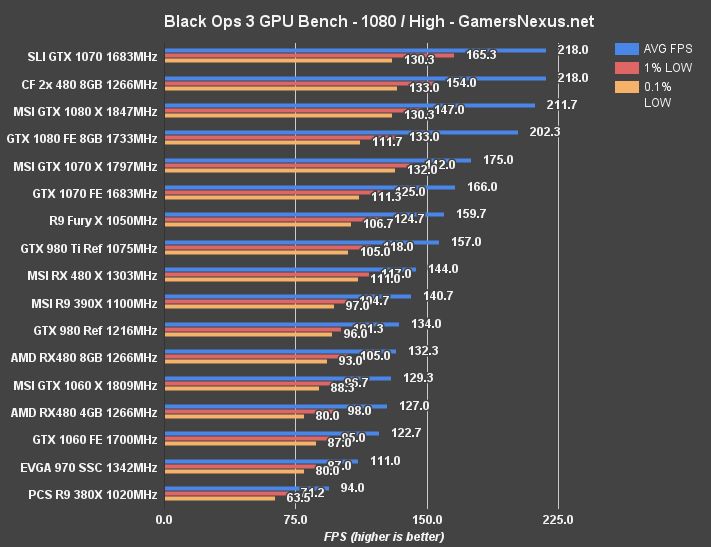
For reference, the GTX 1060 FE card runs at 122FPS AVG at 1080p.
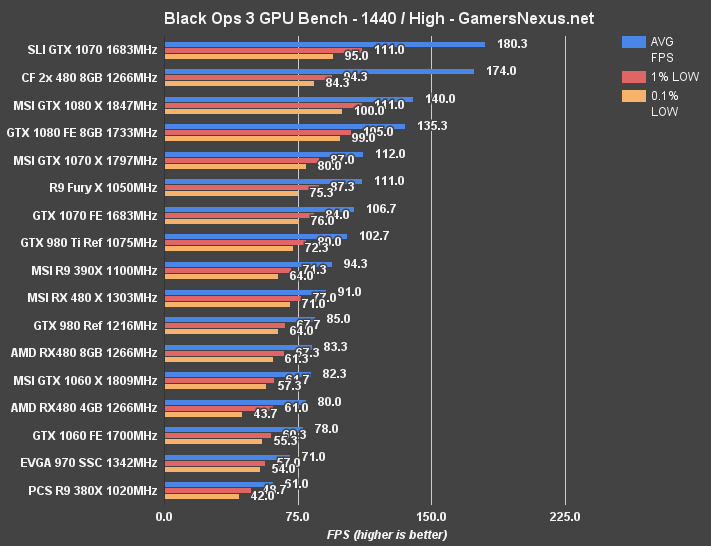
At 1440p, the MSI RX 480 ($265) maintains a 91FPS average, with lows exceeding 60FPS. The reference card operates at around 83FPS AVG. Our 4GB unit had some 0.1% low frametime issues with BLOPS3 at 1440p, but was still at 80FPS AVG. For reference, again, the GTX 1060 sits at 78FPS average, just above the GTX 970 SSC.
For the curious, the MSI RX 480 was pumping 45FPS average at 4K / high, so you'd want to be at 1440p or lower resolution for optimal play. 45FPS is noticeably choppy in Black Ops 3, especially because it's a competitive game.
Mirror's Edge Catalyst Benchmark – MSI RX 480 vs. Reference, 1060, 970
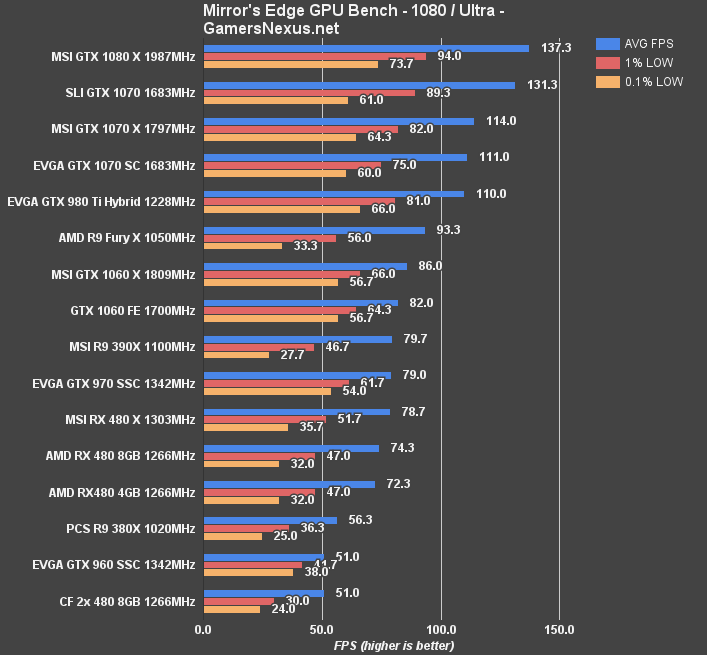
Moving on to Mirror's Edge Catalyst, 1080p Ultra has the MSI RX 480 Gaming X operating at 78.7FPS AVG, with poorly timed 0.1% lows at 35.7FPS. This has the card performing similarly to the EVGA GTX 970 SSC, but with significantly worse low frametimes. For reference, the stock RX 480 from AMD runs a few FPS slower at 74.3 AVG, and the GTX 1060 FE runs at 82FPS AVG.
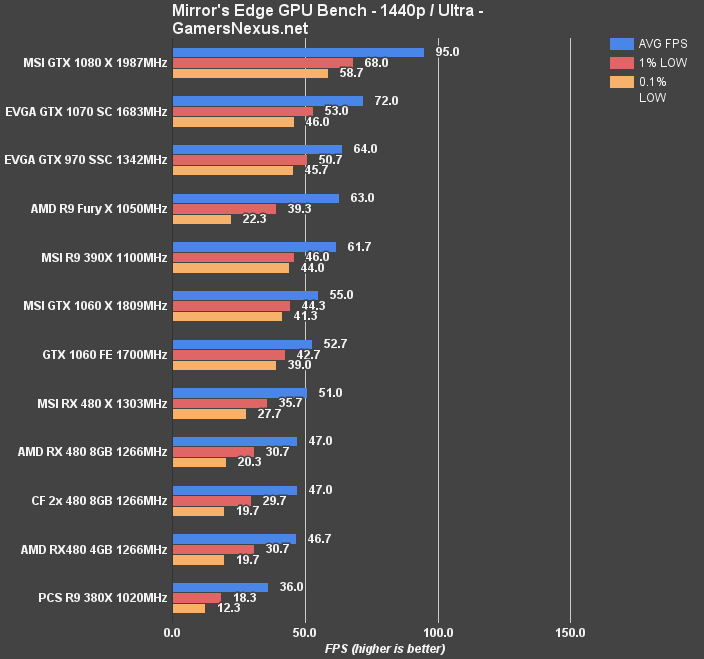
At 1440p, the MSI RX 480 Gaming X sits at 51FPS, closer now to the GTX 1060FE, but the FE card again sustains better 0.1% low framerates.
We did not run Mirror's Edge Catalyst at Hyper or 4K/High for this test; see the reference RX 480 review for that.
The Division Benchmark – MSI RX 480 vs. 1060, 1070, 390X
The Division is clock-sensitive under some settings scenarios. With The Division configured to “high” settings and 1080p, we're seeing some of that behavior emerge as exchanges between GTX 1060 & RX 480 products.
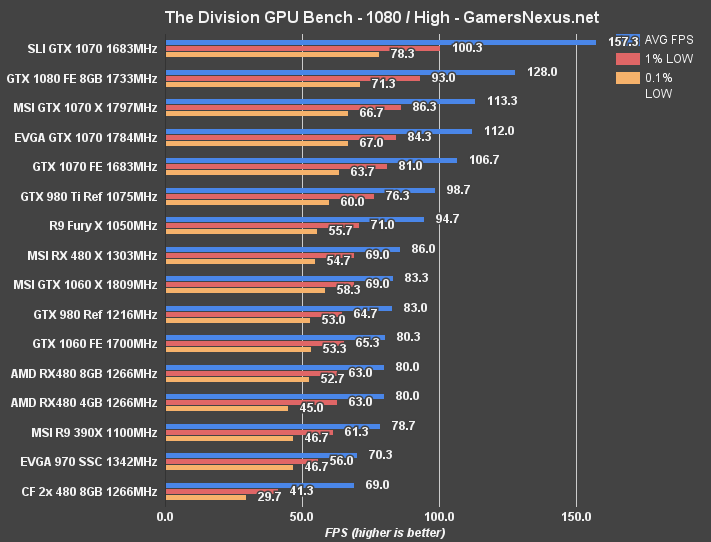
Between reference cards strictly, the GTX 1060 6GB and RX 480 8GB cards are effectively tied in performance. We see some 0.1% low dips on the 4GB model of the RX 480, though they are not as severe as in some other games tested (ACS, Mirror's Edge). The MSI GTX 1060 Gaming X actually drags marginally behind the MSI RX 480 Gaming X once looking at AIB partner models only, a difference of a few FPS (83.3FPS vs. 86FPS, respectively).
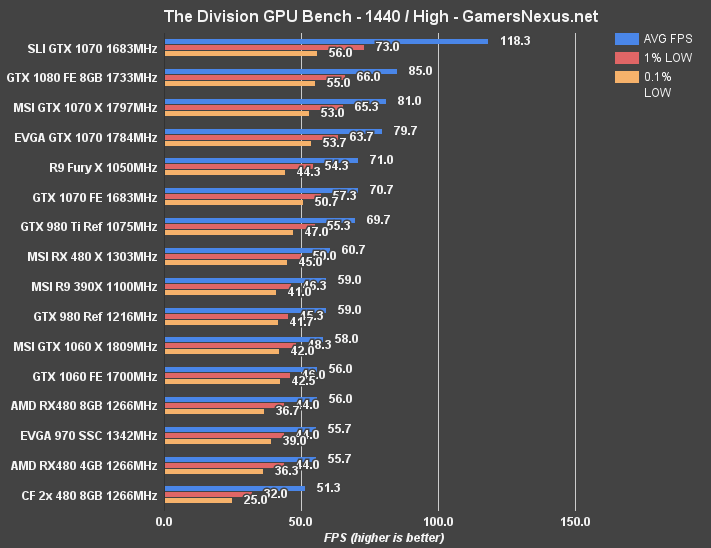
We see similar behavior at 1440p, the MSI RX 480 Gaming X outperforming the R9 390X marginally (+1.7FPS AVG) and also outperforming the GTX 1060 Gaming X. Against the reference card, we're seeing gains upwards of 4-5FPS on the MSI variant.
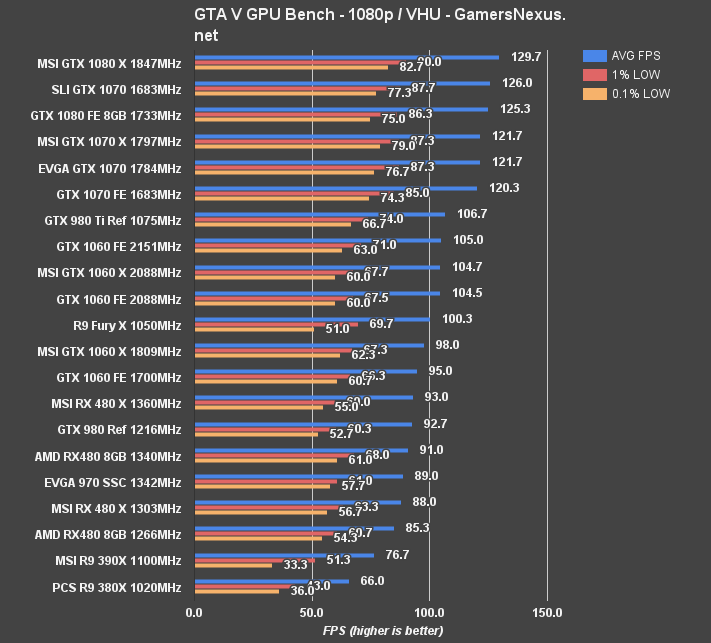
GTA V Benchmark – MSI RX 480 vs. RX 480, 1060
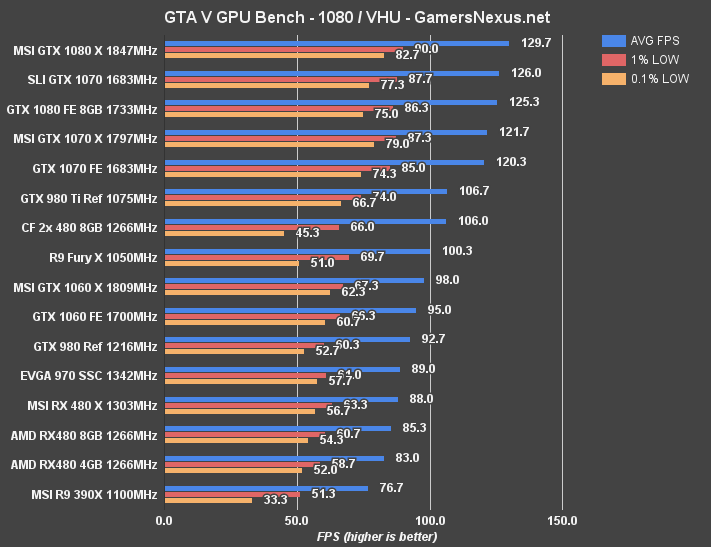
With GTA V at 1080p, the MSI RX 480 Gaming X managed a framerate of 88FPS AVG, with 1% lows at 63FPS, and 0.1% lows not far behind. This testing was with 16.7.2, which had the GTA V stuttering fix. Looking at the reference RX 480, clocked at 1266MHz boost, we see an 85.3FPS average. That's not a huge gain, but does at least post a difference of 3.1%. For reference, the reference GTX 1060 rests at around 95FPS average, with 67FPS 1% lows. That's a difference of 7.6% from the MSI RX 480.
We haven't fully tested our suite at 1440p with GTA V, but just a quick note here: We were hitting 64FPS AVG, 45FPS 1% low, and 39FPS 0.1% lows with the MSI version of the RX 480.
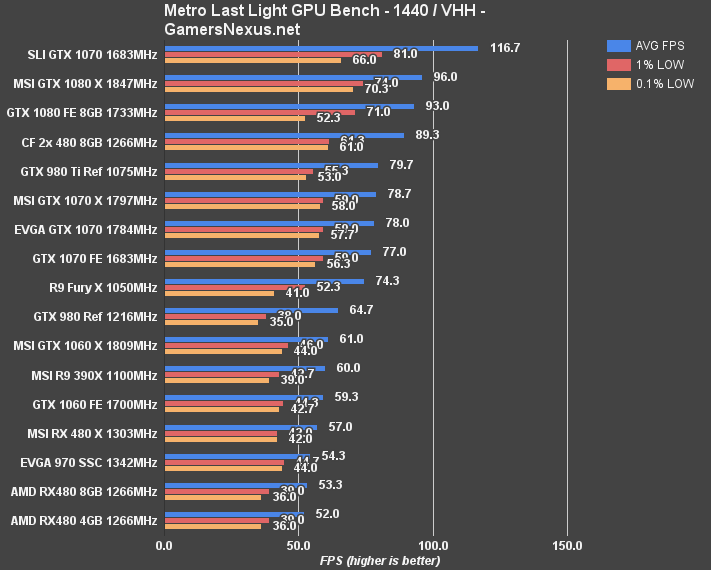
Metro: Last Light Benchmark – MSI RX 480 X vs. RX 480, 1060, 970
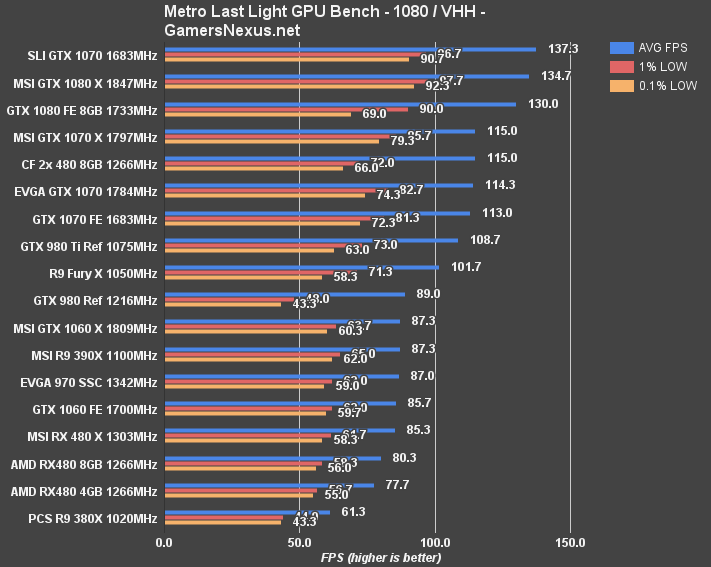
Metro: Last Light remains one of the most reliable games on our benchmark, producing almost perfectly identical results test-to-test.
The RX 480 Gaming X sits at 85.3FPS AVG, a gain over the AMD RX 480 reference card at 80.3FPS. The RX 480 and MSI RX 480 are separated by 6%. The GTX 1060 FE sits at 85.7FPS AVG, with the MSI pre-OC variant at 87.3FPS AVG.
1440p posts the RX 480 Gaming X at 57FPS AVG, versus the stock card output of ~53.3FPS AVG. The GTX 1060 FE remains in an advantaged position, at 59.3FPS AVG.
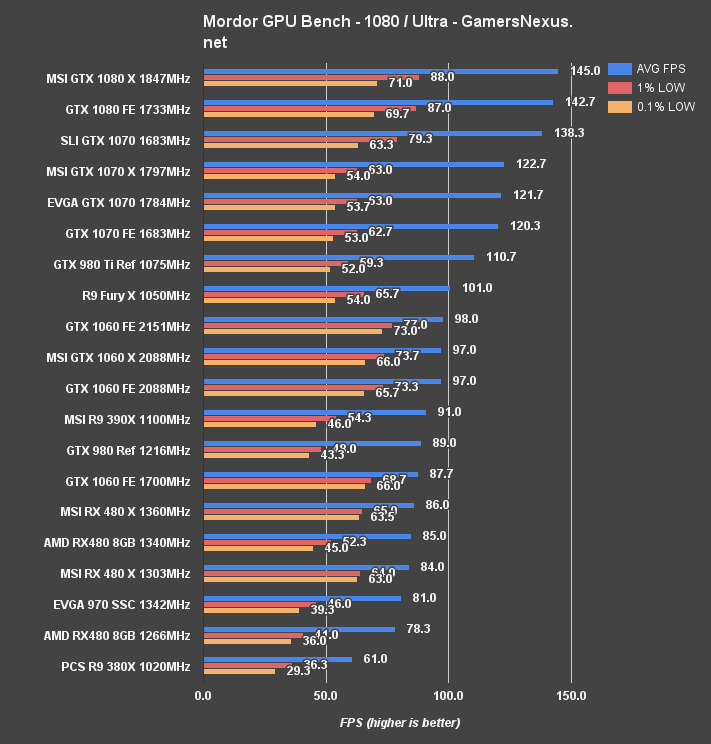
Shadow of Mordor Benchmark – MSI RX 480 Performance
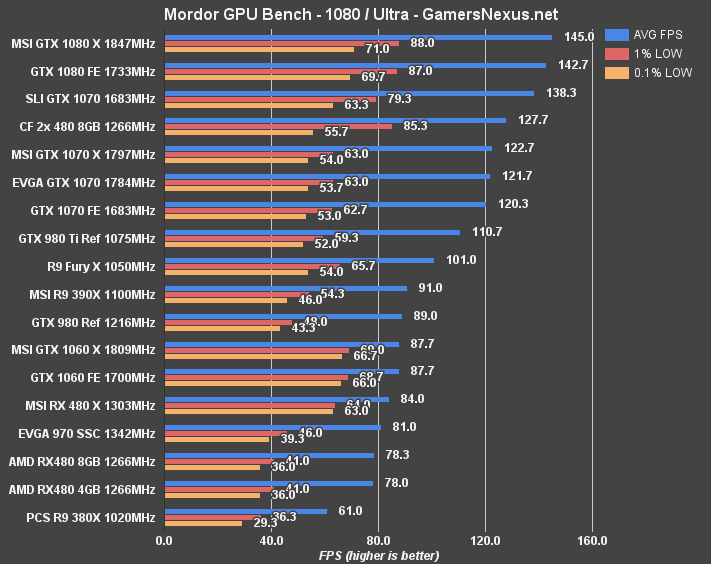
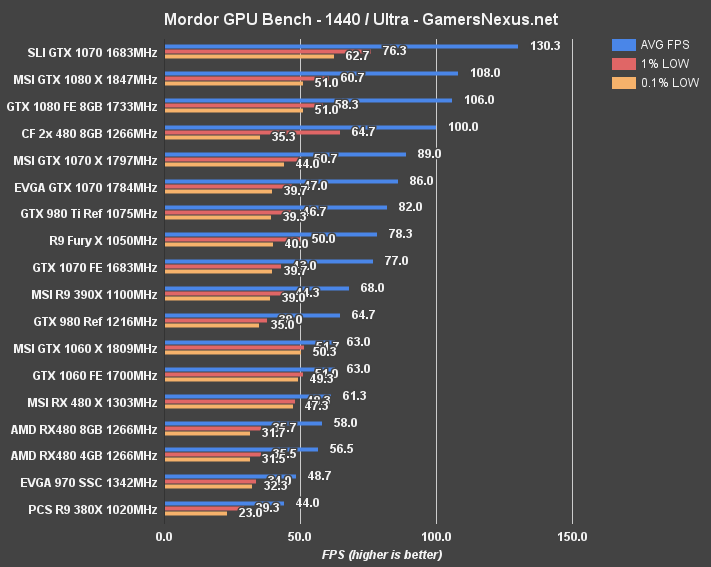
Shadow of Mordor at 1080p/Ultra produces an output of 84FPS AVG on the MSI RX 480 Gaming X, with tightly timed 1% & 0.1% lows (64, 63FPS). Performance is somewhat substantially improved in low framerates versus the reference RX 480, at 78.3FPS AVG with 41FPS 1% lows. The GTX 1060 FE retains its lead with an 87.7FPS AVG and 68.7FPS 1% low.
Continue to page 6 for overclocking & OC FPS performance analysis.
How to Overclock the RX 480
From our initial RX 480 review:
“Overclocking the RX 480 is only possible through AMD's WattMan software right now. Keep in mind that this testing was conducted pre-launch, but it is likely that the usual crew of AIB partner utilities will update as the RX 480 rolls out to market. For now, Afterburner is not compatible, leaving us to rely on AMD's software.
“This time, though, that's an OK thing to rely on. WattMan is a massive improvement over OverDrive (now dead, thankfully), and allows enthusiast-level fine-tuning over most normal OC functions. Something like Afterburner may remove a few restrictions, but there don't seem to be many in place with the Radeon Settings utility.
“WattMan allows dynamic or fixed clock speed modulation, controlled through a toggle and then through sliders (or manually input numbers). We switched to manual control and then configured the numbers to be equal across all 7 DPM states, since we don't much care for power savings when running OC testing. vCore can be tuned per state or left to automated control. Manually tuning vCore allows movement up to 1150mV. Power percent target increases to +50%, which grants us an additional 50% of base power to increase the clock and voltage. Memory overclocking is done with memory MHz offsets and memory voltage control (can be left to 'auto'). Thermal targets and fan RPM targets are relatively self-explanatory.”
MSI RX 480 Gaming X Overclocking Results
The table below shows stepped overclock progression for the MSI RX 480 Gaming X video card. This presents our attempts on a step-by-step basis, and helps illustrate points of failure for the card during the OC process:
| Peak Core CLK | Core Clock (MHz) | Mem CLK (MHz) | Mem Offset (MHz) | Power Target Offset (%) | vCore (mV) | Fan target % | 5m Test | 60m Endurance |
| 1303 | 1303 | 2000 | 0 | 0 | varies | auto | P | P |
| 1340 | 1340 | 2200 | 200 | 50 | 1150 | 33 | P | P |
| 1360 | 1360 | 1150 | F Flicker | - | ||||
| 1360 | 1360 | 2200 | 200 | 50 | 1160 | 40 | P | - |
| 1370 | 1370 | 2200 | 200 | 50 | 1160 | 40 | F Flicker | - |
| 1370 | 1370 | 2250 | 250 | 50 | 1160 | 40 | F Hard Crash | - |
| 1360 | 1360 | 2100 | 100 | 50 | 1150 | 33 | P | - |
| 1360 | 1360 | 2150 | 150 | 50 | 1150 | 33 | P | P |
We settled on a clock-rate of 1360MHz with the MSI RX 480 Gaming X, a +20MHz gain from the reference AMD card. Memory was most stable at 2150MHz, and did not exhibit any flickering or crashes with these settings.
Stock / Reference RX 480 Overclocking Results
Here's our original overclock stepping progression for the RX 480 Reference card:
| Core Clock (MHz) | Mem CLK (MHz) | Mem Offset (MHz) | Power Target (%) | Voltage | vCore Offset | 5m Test | 60m Endurance | Fan target |
| 1266 | 2000 | 0 | 100 | 1.05 | 0 | P | P | Auto |
| 1280 | 2000 | 0 | 150 | 1.075 | 1100 | P | - | 3500 |
| 1300 | 2000 | 0 | 150 | 1.0813 | 1110 | P | - | 3500 |
| 1320 | 2000 | 0 | 150 | 1.0875 | 1110 | P | - | 3500 |
| 1350 | 2000 | 0 | 150 | 1.0875 | 1110 | F | - | 3500 |
| 1340 | 2000 | 0 | 150 | 1.1 | 1130 | F | - | 3500 |
| 1340 | 2000 | 0 | 150 | 1.1 | 1130 | F | - | 3800 |
| 1340 | 2000 | 0 | 150 | 1.1 | 1130 | F | - | 3800 |
| 1340 | 2000 | 0 | 150 | 1.1187 | 1140 | F | - | 3800 |
| 1340 | 2000 | 0 | 150 | 1.125 | 1150 Max | P | - | 3800 |
| 1340 | 2100 | 100 | 150 | 1.125 | 1150 | P | P | 4100 |
| 1350 Max | 2100 | 100 | 150 | 1.125 | 1150 | P | F | 4100 |
| 1340 | 2150 | 150 | 150 | 1.125 | 1150 | P | P | 4100 |
| 1340 | 2200 | 200 | 150 | 1.125 | 1150 | P | P | 4100 |
| 1340 | 2250 | 250 | 150 | 1.125 | 1150 | F Flickering | - | 4100 |
We hit 1340MHz core and 2200MHz memory, and could not progress further.
RX 480 DIY 'Hybrid' Overclocking Results
And here's how we achieved ~1390MHz on a liquid-cooled variant that we hand-built:
| Core Clock (MHz) | Mem CLK (MHz) | Mem Offset (MHz) | Power Target (%) | Voltage | Max Voltage | 5m Test | 60m Endurance | Power Draw |
| 1340 | 2200 | 200 | 150 | 1.125 | 1.313 | P | P | 183.1 |
| 1350 | 2200 | 200 | 150 | 1.125 | 1.313 | P | - | 190.9 |
| 1360 | 2200 | 200 | 150 | 1.125 | 1.313 | P | - | 190.9 |
| 1370 | 2200 | 200 | 150 | 1.125 | 1.313 | P | - | 190.9 |
| 1380 | 2200 | 200 | 150 | 1.125 | 1.15 | P | - | 190.9 |
| 1390 | 2200 | 200 | 150 | 1.125 | 1.15 | - | 190.9 | |
| 1400 | 2200 | 200 | 150 | 1.125 | 1.15 | P | F | 190.9 |
| (switch VRM fan to go to PSU) | ||||||||
| 1400 | 2200 | 200 | 150 | 1.125 | 1.15 | P | F | 192.2 |
| 1400 | 2000 | 0 | 150 | 1.125 | 1.15 | P | F | 192.2 |
| 1395 | 2000 | 0 | 150 | 1.125 | 1.15 | P | F | 192.2 |
| 1390 | 2200 | 200 | 150 | 1.125 | 1.15 | P | P | 192.2 |
| 1390 | 2250 | 200 | 150 | 1.125 | 1.15 | F | - | 192.2 |
MSI RX 480 Gaming X Overclocked FPS Results
Find the FPS impact from overclocking below:
We see the RX 480 Gaming X pass the GTX 1060 pre-OC card in Shadow of Mordor, though it still sits below our manually overclocked GTX 1060 variants. GTA V posts performance at 93FPS AVG for the RX 480 overclocked card (1360MHz), a couple FPS higher than the 1340MHz reference OC.
Continue to the final page for the conclusion.
Conclusion: MSI RX 480 Gaming X Review
MSI's RX 480 Gaming X is what we were looking for when suggesting readers skip the reference model. So far this year, we've recommended against all the reference models from both nVidia and AMD – mostly for thermal reasons, as our extensive analysis has illustrated – except for in very limited use cases. The MSI RX 480 Gaming X is a $15 jaunt from the $250 reference card, but improves cooling performance by about 10C load (~46C vs. ~56C of the reference card) while maintaining lower fan RPMs. Framerates are also improved marginally across the board, though some clock-sensitive games post somewhat significant deltas – Black Ops III, for instance, shows a difference large enough to push us from ~132FPS AVG (reference) to 144FPS AVG (Gaming X), enough for 144Hz play.
Clock-rate stability is also improved with the Twin Frozr VI cooler. We'll re-print those charts to illustrate:
Above: The endurance chart showing frequency vs. temperature vs. time for the reference RX 480.
Above: The endurance chart showing frequency vs. temperature vs. time for the MSI RX 480 Gaming X.
This follows our findings with the RX 480 Hybrid mod that we built, flattening the clock-rate with a superior cooling solution.
Of course, the RX 480 no longer exists in a vacuum; the card first shipped without competition from nVidia, aside from last-gen (Maxwell) hardware. Now, with the GTX 1060 out and reviewed, the RX 480 has some real competition. The GTX 1060 and RX 480 exchange slots depending on game. The RX 480 leads in Vulkan tests with DOOM (though not always in Talos Principle) and leads in Black Ops III Dx11 performance. The GTX 1060, meanwhile, leads in GTA, The Division, Mirror's Edge, and Ashes.
As always, we're not here to tell you which card to buy. The numbers have been presented, and we trust our readership to know its own needs more than we possibly could. Our suggestion is this: If you've got a very specific game in mind that you're playing a lot, find benchmarks for the card on that game, then make a decision on those metrics. If you're playing a wider swathe of games, check our numbers and decide based on similar titles to what you're most commonly playing.
Generally, the GTX 1060 is at least marginally advantaged on average across our test suite, but the RX 480 does shine in some titles – particularly Doom with Vulkan, where it pulls far ahead of the GTX 1060. It just depends on what you're playing. Black Ops III also sees potentially non-trivial gains in some instances, depending on your display frequency targets for a competitive FPS.
Price, of course, also comes into play. At $265, the MSI RX 480 Gaming X is fairly priced in comparison to the reference card. The GTX 1060 cards range $250-$330 – the upper end of that being insane, frankly (see: ASUS – and don't buy it). The lower-end is competitive, though, and so we'd advise making a choice between those cards.
Editorial, Test Lead: Steve “Lelldorianx” Burke
Sr. Test Technician: Mike “Budekai” Gaglione
Test Technician: Andie “Draguelian” Burke
Video Producer: Andrew “ColossalCake” Coleman