Our Gigabyte GTX 1080 Ti Aorus Xtreme ($750) review brings us to look at one of the largest video cards in the 1080 Ti family, matching it well versus the MSI 1080 Ti Gaming X. Our tests today will look at the Aorus Xtreme GPU in thermals (most heavily), noise levels, gaming performance, and overclocking, with particular interest in the efficacy of Gigabyte’s copper insert in the backplate. The Gigabyte Aorus Xtreme is a heavyweight in all departments – size being one of them – and is priced at $750, matching the MSI Gaming X directly. A major point of differentiation is the bigger focus on RGB LEDs with Gigabyte’s model, though the three-fan design is also interesting from a thermal and noise perspective. We’ll look at that more on page 3.
We’ve already posted a tear-down of this card (and friend of the site ‘Buildzoid’ has posted his PCB analysis), but we’ll recap some of the PCB and cooler basics on this first page. The card uses a 3-fan cooler (with smaller fans than the Gaming X-type cards, but more of them) and large aluminum heatsink, ultimately taking up nearly 3 PCI-e slots. It’s the same GPU and memory underneath as all other GTX 1080 Ti cards, with differences primarily in the cooling and power management departments. Clock, of course, does have some pre-OC applied to help boost over the reference model. Gigabyte is shipping the Xtreme variant of the 1080 Ti at 1632/1746MHz (OC mode) or 1607/1721 (gaming mode), toggleable through software if not manually overclocking.
Gigabyte GTX 1080 Ti Aorus Xtreme PCB, VRM, & Tear-Down
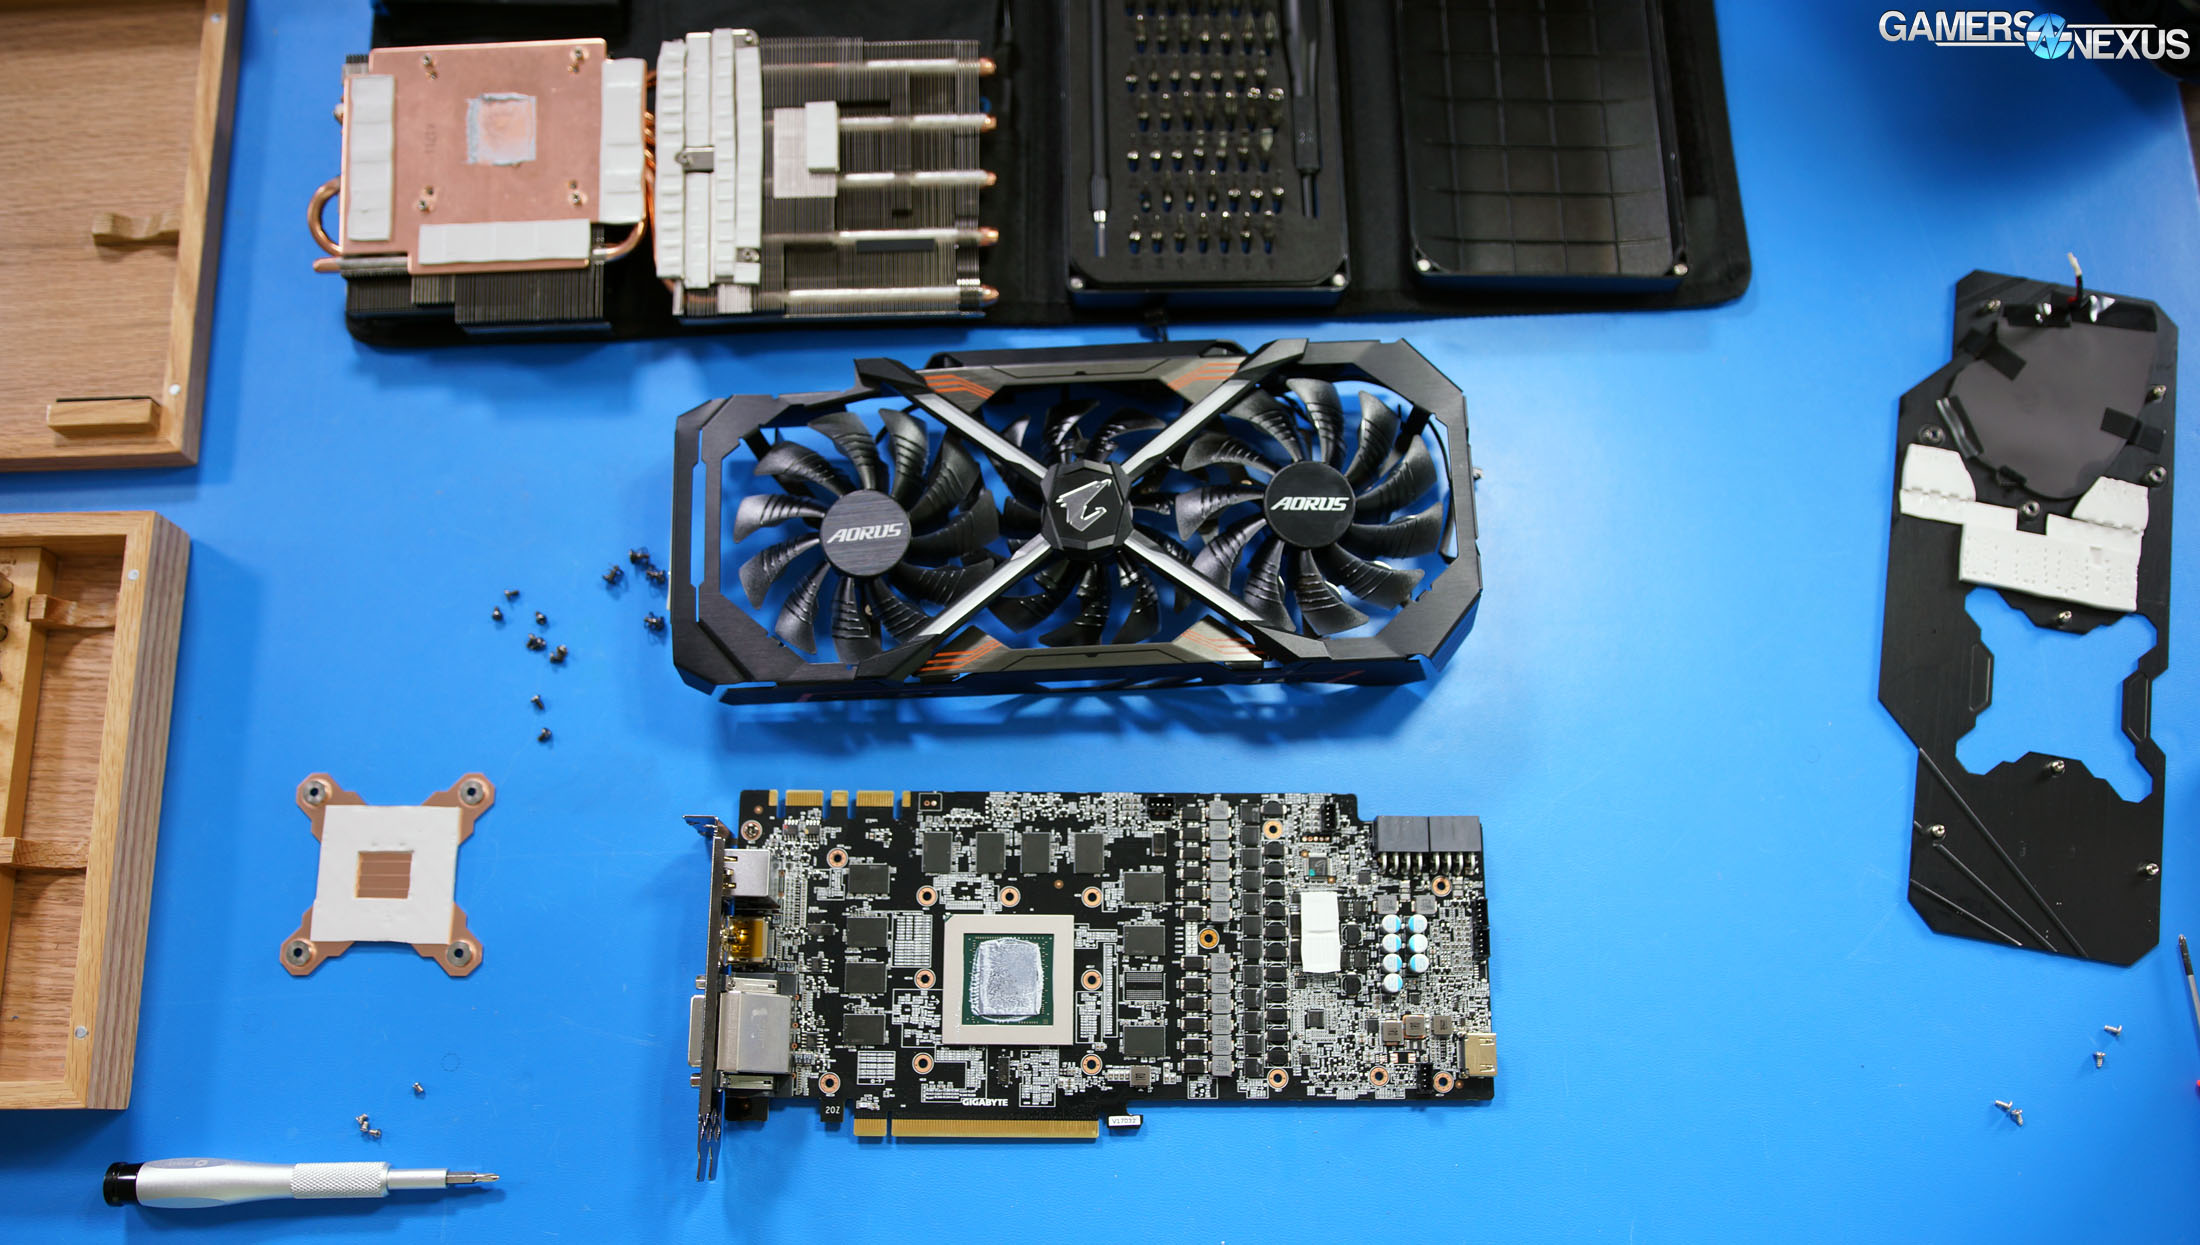
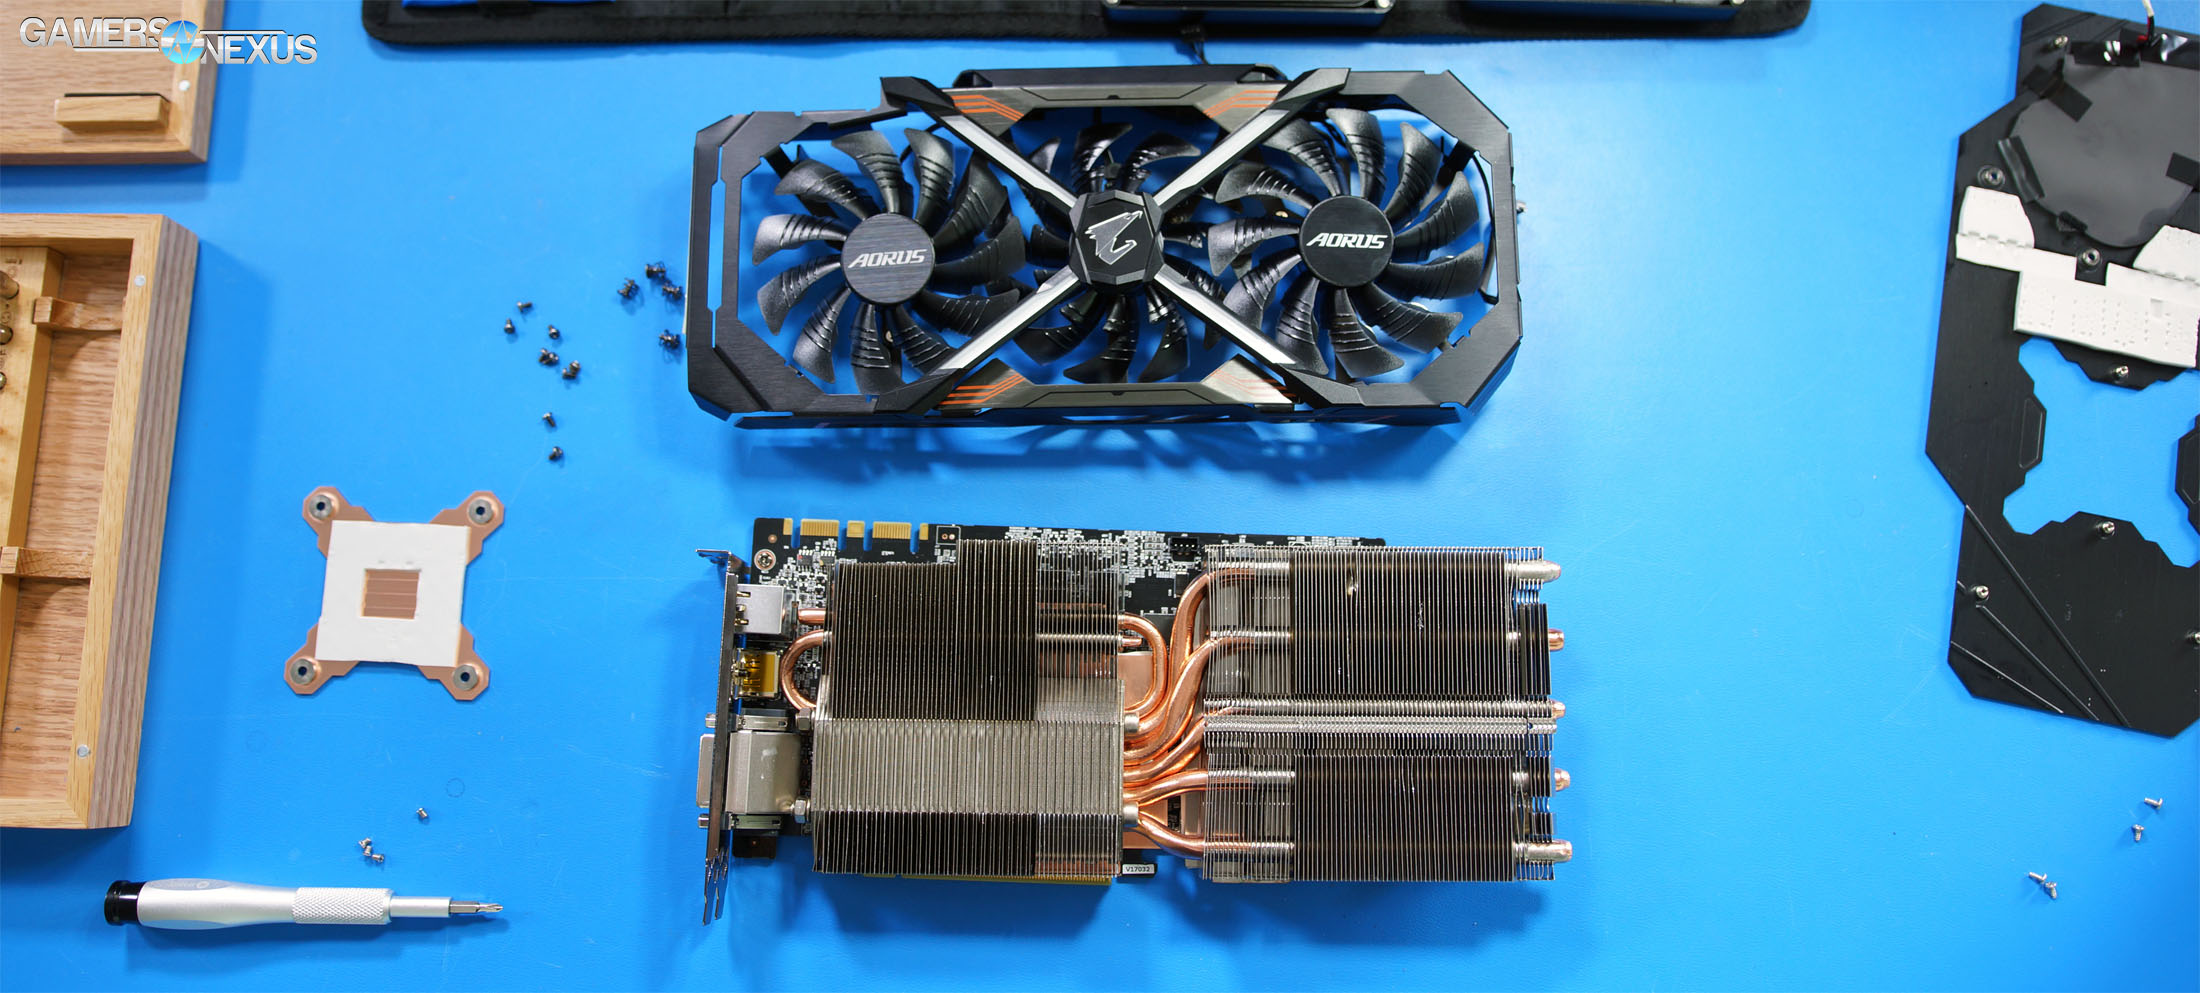
Our tear-down of this card already kicked-off cooler and PCB/VRM discussion, but we can recap a few important pieces here.
Gigabyte’s backplate on the Aorus Xtreme 1080 Ti primarily offers structural support for the card, though would lead you to believe there is also a cooling benefit with the copper insert in the backplate. We’ll test the card in A/B fashion (page 3) to determine if this copper insert actually helps in a meaningful way.
Removing the backplate reveals that the rear-side RGB LED pad is taped in place, with some of the corners overlapping the center of the mounting for front-side FETs and inductors (not covering anything important, just preventing thermal pad contact to the backplate). Regardless, unlike some backplates, this one actually does have thermal pad coverage and contact to the PCB. We recently tested MSI’s cards for this, and will link that coverage where relevant once on page 3.
Internally, Gigabyte is following the new trend of using a copper coldplate that provides coverage to both VRAM and the GPU. The copper plate coverage means that VRAM is getting directly cooled by the same finstack as the GPU, with the heat sinked into the same coldplate as the silicon (though with thermal pads between the VRAM and the plate, not thermalpaste). The VRAM will run cooler as a result, but it also means that the GPU diode temperature will appear to be warmer as a result of sharing its cooling solution with other warm components.
Considering that the new video cards run reasonably cool to begin with, there’s really not much need to fret over a few *C increase on the GPU diode – the tradeoff is worth it.
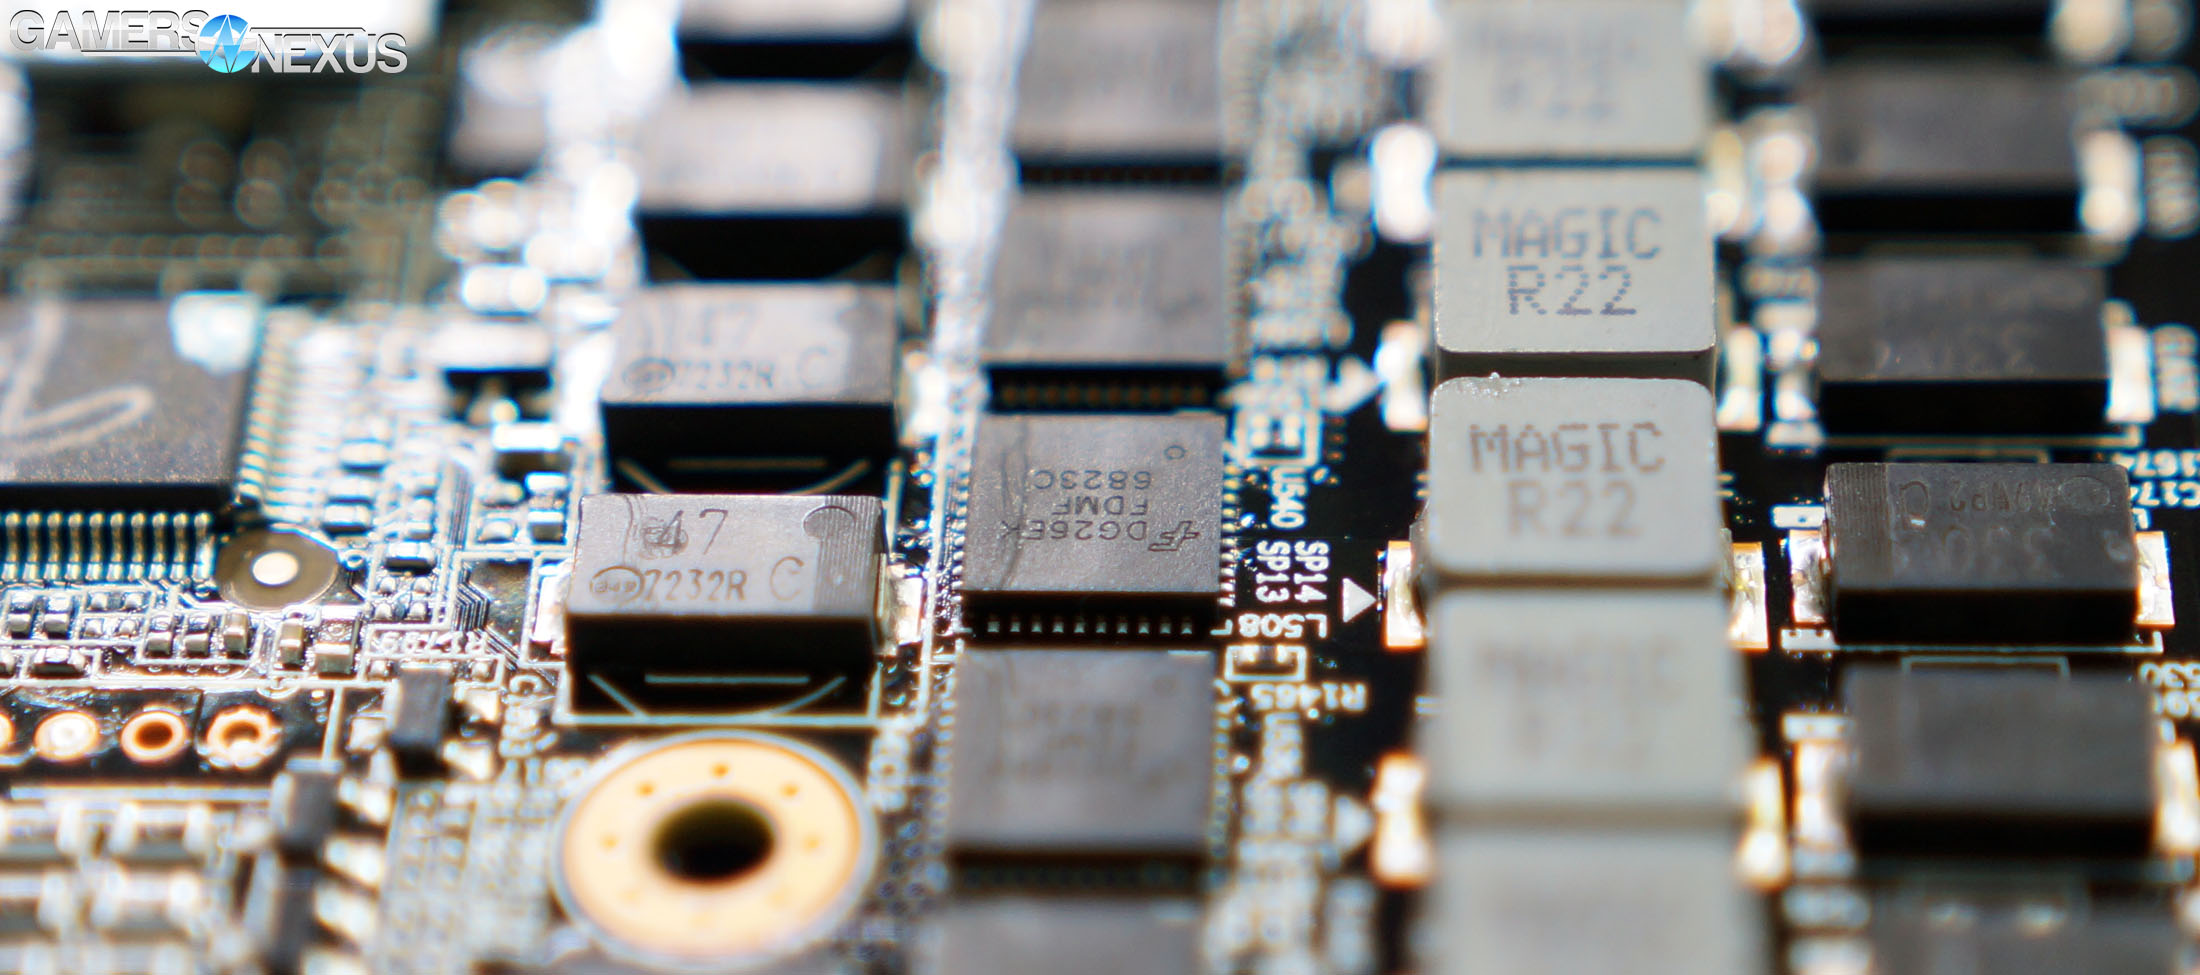
With regard to power design, the Gigabyte Xtreme 1080 Ti is using Fairchild 6823C 50A power stages for a total possible throughput of 600A on the GPU core. It’s a 12-phase VRM that takes up much of the board, and should help in spreading thermal load across a wider surface area. We’ll talk about this more on the thermal testing page.
Continue to Page 2 for the GPU Test Methodology.
GPU Testing Methodology
For our benchmarks today, we’re using a fully rebuilt GPU test bench for 2017. This is our first full set of GPUs for the year, giving us an opportunity to move to an i7-7700K platform that’s clocked higher than our old GPU test bed. For all the excitement that comes with a new GPU test bench and a clean slate to work with, we also lose some information: Our old GPU tests are completely incomparable to these results due to a new set of numbers, completely new testing methodology, new game settings, and new games being tested with. DOOM, for instance, now has a new test methodology behind it. We’ve moved to Ultra graphics settings with 0xAA and async enabled, also dropping OpenGL entirely in favor of Vulkan + more Dx12 tests.
We’ve also automated a significant portion of our testing at this point, reducing manual workload in favor of greater focus on analytics.
Driver version 378.78 (press-ready drivers for 1080 Ti, provided by nVidia) was used for all nVidia devices. Version 17.3.1 was used for AMD.
A separate bench is used for game performance and for thermal performance.
Thermal Test Bench
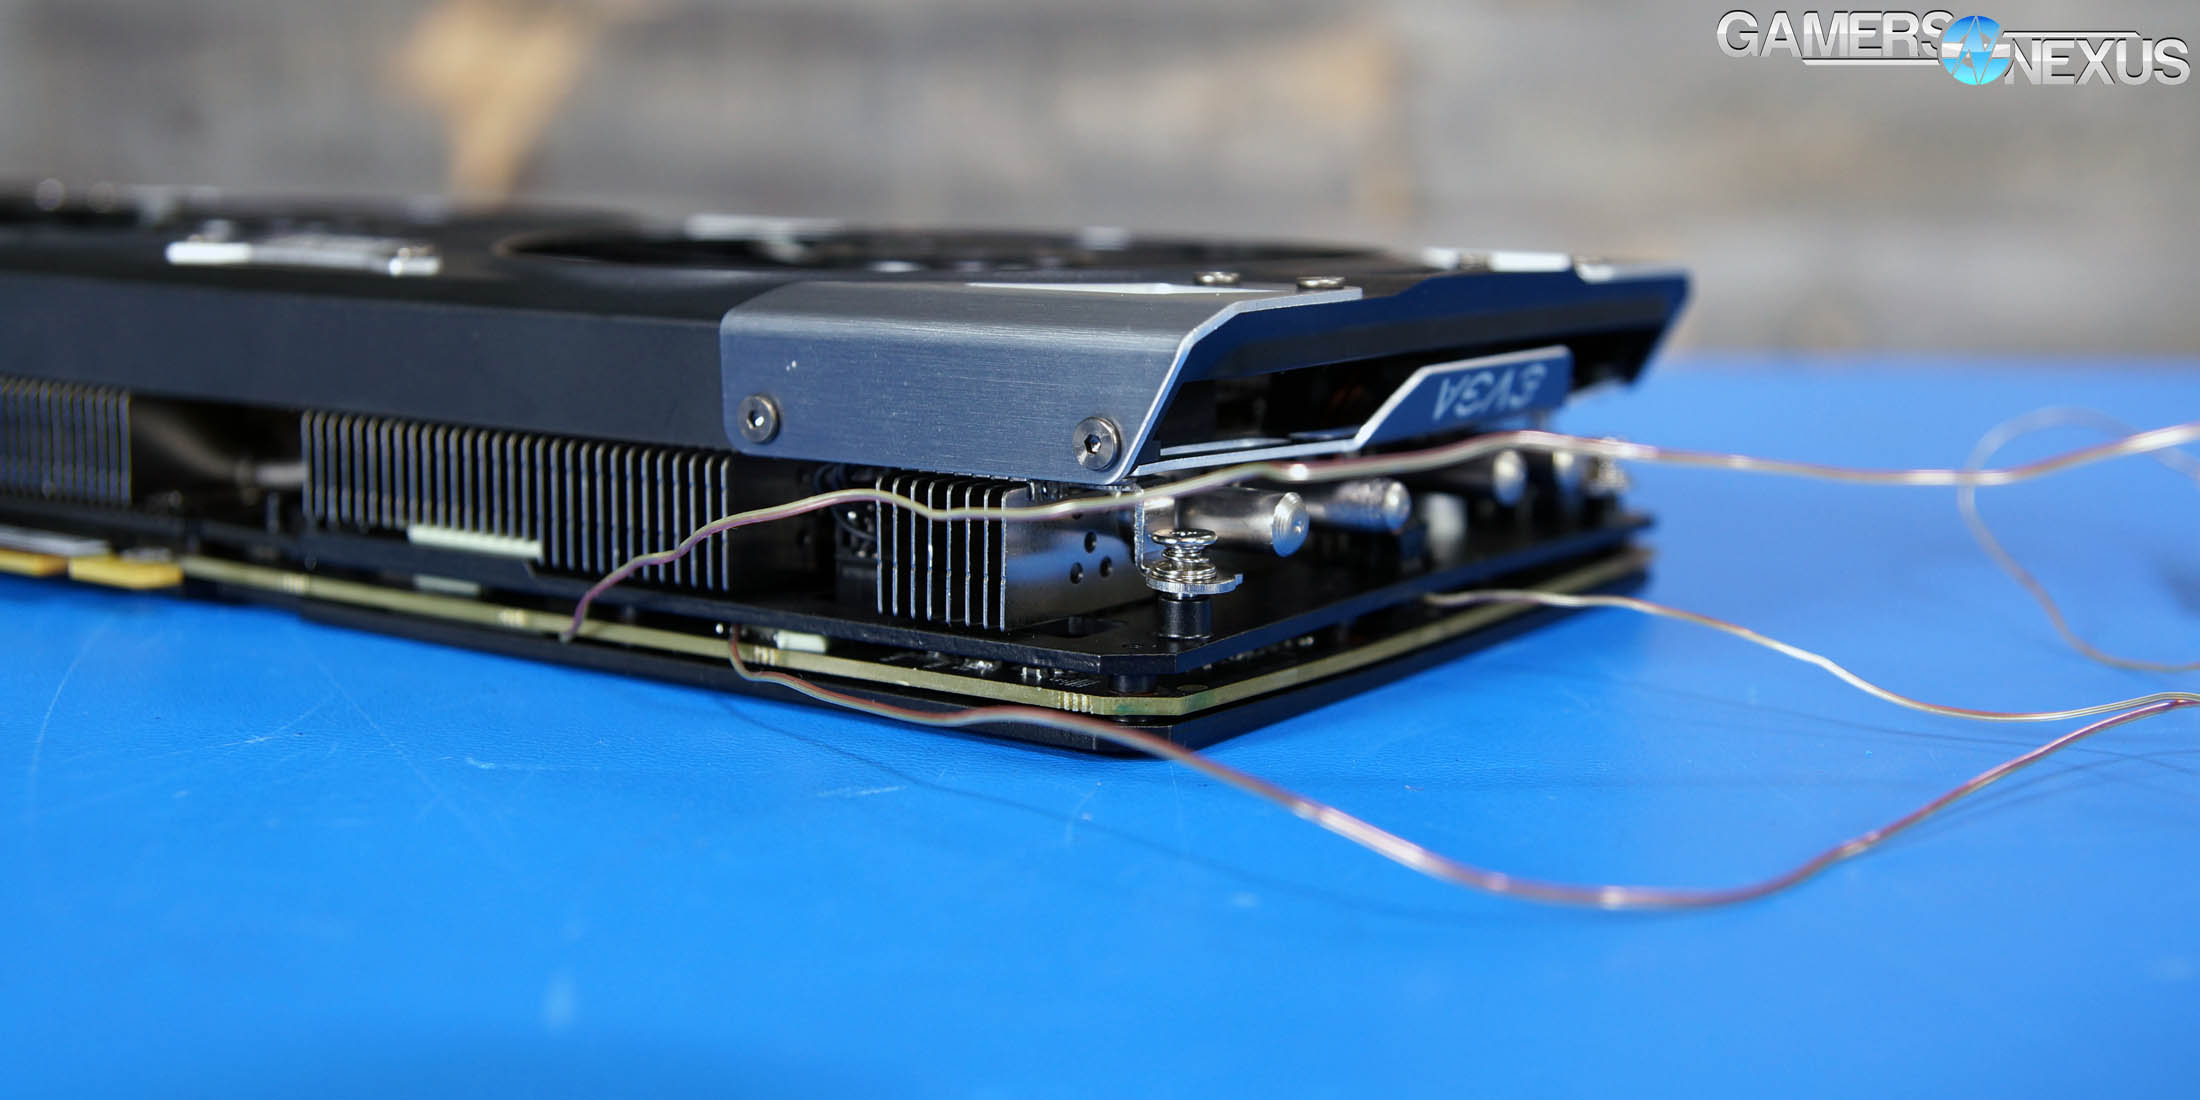
Our test methodology for the is largely parallel to our EVGA VRM final torture test that we published late last year. We use logging software to monitor the NTCs on EVGA’s ICX card, with our own calibrated thermocouples mounted to power components for non-ICX monitoring. Our thermocouples use an adhesive pad that is 1/100th of an inch thick, and does not interfere in any meaningful way with thermal transfer. The pad is a combination of polyimide and polymethylphenylsiloxane, and the thermocouple is a K-type hooked up to a logging meter. Calibration offsets are applied as necessary, with the exact same thermocouples used in the same spots for each test.
Torture testing used Kombustor's 'Furry Donut' testing, 3DMark, and a few games (to determine auto fan speeds under 'real' usage conditions, used later for noise level testing).
Our tests apply self-adhesive, 1/100th-inch thick (read: laser thin, does not cause "air gaps") K-type thermocouples directly to the rear-side of the PCB and to hotspot MOSFETs numbers 2 and 7 when counting from the bottom of the PCB. The thermocouples used are flat and are self-adhesive (from Omega), as recommended by thermal engineers in the industry -- including Bobby Kinstle of Corsair, whom we previously interviewed.
K-type thermocouples have a known range of approximately 2.2C. We calibrated our thermocouples by providing them an "ice bath," then providing them a boiling water bath. This provided us the information required to understand and adjust results appropriately.
Because we have concerns pertaining to thermal conductivity and impact of the thermocouple pad in its placement area, we selected the pads discussed above for uninterrupted performance of the cooler by the test equipment. Electrical conductivity is also a concern, as you don't want bare wire to cause an electrical short on the PCB. Fortunately, these thermocouples are not electrically conductive along the wire or placement pad, with the wire using a PTFE coating with a 30 AWG (~0.0100"⌀). The thermocouples are 914mm long and connect into our dual logging thermocouple readers, which then take second by second measurements of temperature. We also log ambient, and apply an ambient modifier where necessary to adjust test passes so that they are fair.
The response time of our thermocouples is 0.15s, with an accompanying resolution of 0.1C. The laminates arae fiberglass-reinforced polymer layers, with junction insulation comprised of polyimide and fiberglass. The thermocouples are rated for just under 200C, which is enough for any VRM testing (and if we go over that, something will probably blow, anyway).
To avoid EMI, we mostly guess-and-check placement of the thermocouples. EMI is caused by power plane PCBs and inductors. We were able to avoid electromagnetic interference by routing the thermocouple wiring right, toward the less populated half of the board, and then down. The cables exit the board near the PCI-e slot and avoid crossing inductors. This resulted in no observable/measurable EMI with regard to temperature readings.
We decided to deploy AIDA64 and GPU-Z to measure direct temperatures of the GPU and the CPU (becomes relevant during torture testing, when we dump the CPU radiator's heat straight into the VRM fan). In addition to this, logging of fan speeds, VID, vCore, and other aspects of power management were logged. We then use EVGA's custom Precision build to log the thermistor readings second by second, matched against and validated between our own thermocouples.
The primary test platform is detailed below:
| GN Test Bench 2015 | Name | Courtesy Of | Cost |
| Video Card | This is what we're testing | - | - |
| CPU | Intel i7-5930K CPU 3.8GHz | iBUYPOWER | $580 |
| Memory | Corsair Dominator 32GB 3200MHz | Corsair | $210 |
| Motherboard | EVGA X99 Classified | GamersNexus | $365 |
| Power Supply | NZXT 1200W HALE90 V2 | NZXT | $300 |
| SSD | OCZ ARC100 Crucial 1TB | Kingston Tech. | $130 |
| Case | Top Deck Tech Station | GamersNexus | $250 |
| CPU Cooler | Asetek 570LC | Asetek | - |
Note also that we swap test benches for the GPU thermal testing, using instead our "red" bench with three case fans -- only one is connected (directed at CPU area) -- and an elevated standoff for the 120mm fat radiator cooler from Asetek (for the CPU) with Gentle Typhoon fan at max RPM. This is elevated out of airflow pathways for the GPU, and is irrelevant to testing -- but we're detailing it for our own notes in the future.
Game Bench
| GN Test Bench 2017 | Name | Courtesy Of | Cost |
| Video Card | This is what we're testing | - | - |
| CPU | Intel i7-7700K 4.5GHz locked | GamersNexus | $330 |
| Memory | GSkill Trident Z 3200MHz C14 | Gskill | - |
| Motherboard | Gigabyte Aorus Gaming 7 Z270X | Gigabyte | $240 |
| Power Supply | NZXT 1200W HALE90 V2 | NZXT | $300 |
| SSD | Plextor M7V Crucial 1TB | GamersNexus | - |
| Case | Top Deck Tech Station | GamersNexus | $250 |
| CPU Cooler | Asetek 570LC | Asetek | - |
BIOS settings include C-states completely disabled with the CPU locked to 4.5GHz at 1.32 vCore. Memory is at XMP1.
We communicated with both AMD and nVidia about the new titles on the bench, and gave each company the opportunity to ‘vote’ for a title they’d like to see us add. We figure this will help even out some of the game biases that exist. AMD doesn’t make a big showing today, but will soon. We are testing:
- Ghost Recon: Wildlands (built-in bench, Very High; recommended by nVidia)
- Sniper Elite 4 (High, Async, Dx12; recommended by AMD)
- For Honor (Extreme, manual bench as built-in is unrealistically abusive)
- Ashes of the Singularity (GPU-focused, High, Dx12)
- DOOM (Vulkan, Ultra, 0xAA, Async)
Synthetics:
- 3DMark FireStrike
- 3DMark FireStrike Extreme
- 3DMark FireStrike Ultra
- 3DMark TimeSpy
For measurement tools, we’re using PresentMon for Dx12/Vulkan titles and FRAPS for Dx11 titles. OnPresent is the preferred output for us, which is then fed through our own script to calculate 1% low and 0.1% low metrics (defined here).
Continue to Page 3 for thermals & backplate testing.
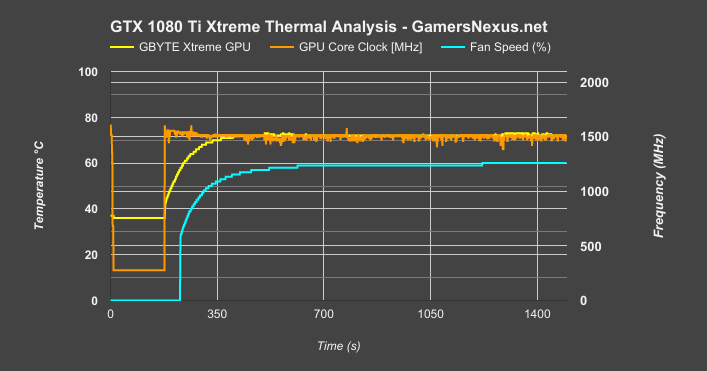
Gigabyte GTX 1080 Ti Aorus Xtreme: Frequency vs. Temperature
Our first temperature chart covers frequency vs. temperature & time, plotting time on the x-axis, temperature on the left axis, and frequency on the right axis. Note that frequency is lower in these tests than gaming scenarios, as we're generating a power virus load on the GPU to strain it heavily.
What we're looking for is a flat frequency line. We're getting close -- the range of fluctuation is less than 100MHz, this time, without approaching any thermal constraints on the card. The biggest constraint is going to be power and voltage, as tends to be the case for AIB partner Pascal cards. Fan speed levels off around 60% and stays there for the remainder of the test, which is also around where fan speed sits during gaming workloads.
Gigabyte 1080 Ti Xtreme vs. Gaming X Temperatures
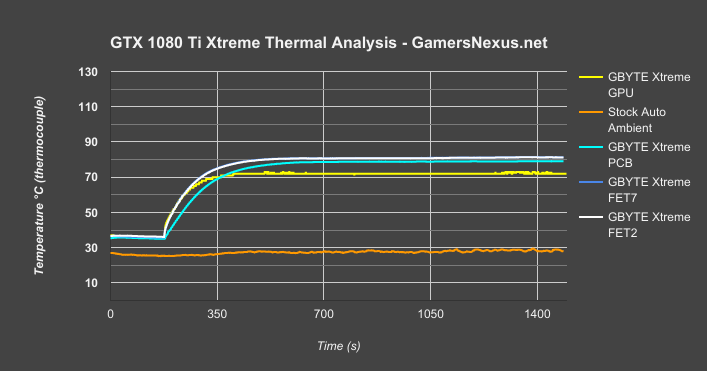
This test plots temperature of critical board components against some other cards. We’re looking at the Gigabyte GTX 1080 Ti Xtreme versus the MSI GTX 1080 Ti Gaming X; for those who missed our Gaming X review, the MSI card had similar FET and PCB temperatures to the Founders Edition card (review here). This can serve as something of a stand-in for those numbers. It’ll also simplify the charts. The FE card, naturally, has a much higher GPU temperature of about 84C when under auto conditions.
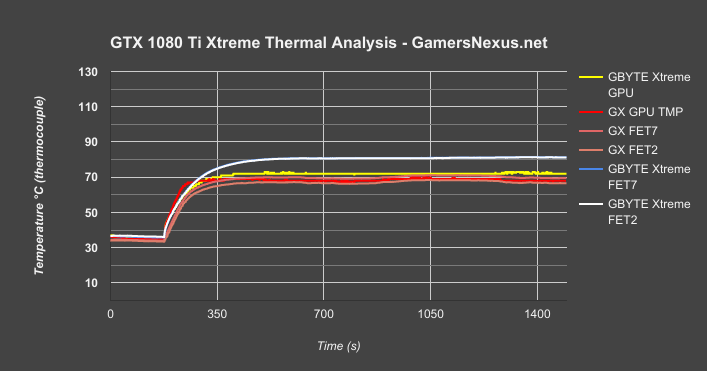
With these two cards, the Gigabyte Xtreme GPU diode temperature runs at about 70-72C, with the MSI Gaming X GPU temperature at around 68C. FET temperatures place the MSI card at around 70C for FET7 and around 67C for FET2. The Gigabyte card runs a hotter VRM, with its FETs around 82C. That said, these VRMs are both well within any reasonable operating range. You’re not going to get derating at 82C on the Gigabyte card – we’re so far away from a 125C threshold that it’s fair to say both cards are doing their job well, considering Gigabyte and MSI use different driver ICs and FETs to begin with. They’re not necessarily linearly comparable, since the overall VRM solution is different in addition to the cooling differences.
Gigabyte Aorus Xtreme Backplate Tests: Does it Work?
This next part of the thermal testing is the most interesting, we think. We’ve previously done backplate A/B testing with entire backplates, and have found that they occasionally work – like on EVGA’s FTW and FTW2 cards – but most often just provide structural support, with no real benefit outside of that. In some cases, like EVGA’s first FTW card, there could even be trapped heat.
But this card is different. Rather than just test the backplate in an A/B scenario, we decided to specifically benchmark the copper plate on the back of the PCB while leaving the rest of the backplate attached. We ran these tests a few different ways: First, we used our standard bench with only light airflow over the back of the card (1x 120mm fan at ~10” away). Next, we ran the tests with a 120mm case fan mounted an inch away from the backplate on an open air bench, providing very direct airflow to the copper plate. We thought this to be a necessary test, as any conducting heatsink will require dissipation in order to function properly. That requires a new set of A/B tests with and without the case, since we’ve changed the airflow dynamic. This is something of an ideal scenario.
For all these tests, we tested using the GPU fan speed manually configured to 60%. This is the most common fan speed that this card reaches in real gaming scenarios, and so we chose it for our benchmarks. All the thermocouples and diodes are allowed to reach a steady state prior to proceeding. We are logging ambient second-to-second as well, then creating delta values. This allows us to largely rid of the 1-2C uncertainty caused by normal fluctuations in ambient.
1080 Ti Xtreme Aorus Backplate w/ Light Airflow
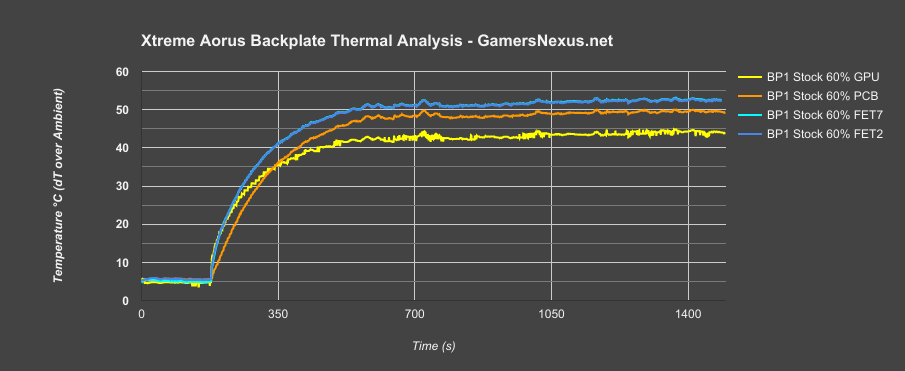
These are the tests with the backplate on.
Starting the A/B tests with just one case fan positioned about 10” away from the GPU backside, with the usual sticks of RAM in between the fan and the card, we see the chart above. These numbers are with the backplate on the card. We’ve cropped the temperature scale in to 0-60C, as it will help better show deviation in the numbers. All values are delta T; we are accounting for ambient in these measurements.
As shown here, we’re seeing that the 1080 Ti Xtreme runs its FET7 and FET2 temperatures nearly identically – they’ve built a very consistent VRM across the entire board – both at roughly 53C delta T when under the power virus load. The PCB backside temperature, with the probe affixed behind the FETs and inductors, measures at around 49-50C delta T load. The GPU diode temperature is bouncing around near 43-45C delta T.
Removing the backplate:
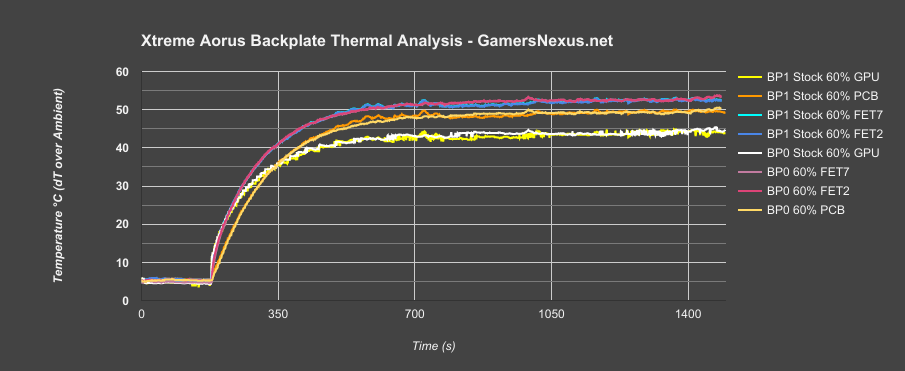
What you’re looking at is a whole bunch of lines on top of each other. Fortunately, they happen to be sectioned in an easy-to-follow fashion once reading through the data.
The top pairing of lines is for the FETs. There are actually four lines here, but they’re all covering each other. FET2 and FET7 with the backplate on and off are effectively identical in performance. We cannot confidently state that there is a significant difference between these numbers. The copper plate does not impact FET temperatures.
We can next look at PCB backside temperatures – these, you’d think, may be more affected given that the plate is conducting heat away from the back of the PCB, and therefore out of a potential hotbox scenario caused by the backplate.
No difference here, either. The two lines show that the PCB backside temperature is effectively identical with and without the plate.
Let’s highlight the last two lines. These are for the GPU diode temperature. Again, this is a delta T reading. There is no significant difference here, and our confidence interval is not tight enough to declare a potential 0.5C advantage. We’ve got about a 1C range of confidence. These numbers are effectively identical.
Looking at the 200 to 350 second mark vertically, we can see that the plate does not even impact the ramp-up time of temperatures. The temperatures increase at the same pace regardless of its presence, and because our test is automated, we can see this quite clearly.
But there’s a chance that we need better airflow over the copper insert to really see a benefit, so we also ran those tests.
1080 Ti Xtreme Aorus Backplate w/ Direct Airflow
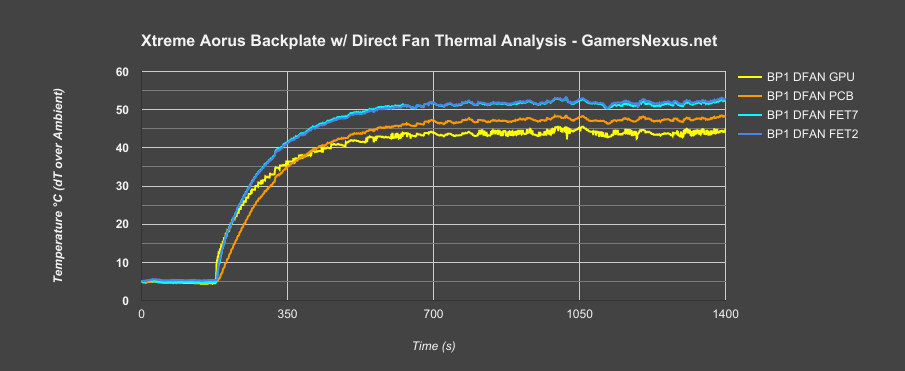
Here’s the chart with the backplate on. We now have a fan directly pointed at the plate. Temperatures overall are slightly better on the backplate diode than in our previous test, which shows that the extra airflow is getting down the backside of the card.
So far, our numbers look about like they did before: FETs 7 and 2 are nearly the same temperature, and run at around 51-53C delta T over ambient. PCB backside temperature is now around 46-48C delta T. GPU diode temperature is about 43-45C delta T.
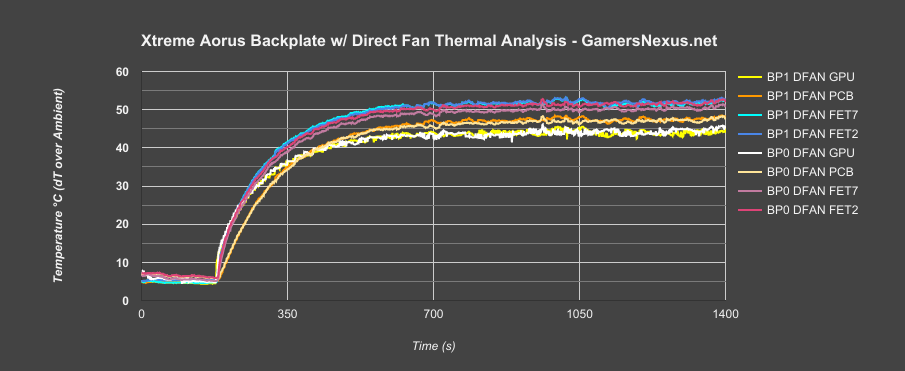
Removing the backplate, we can now add in the rest of the lines. FETs 2 and 7 in both the A and B test are nearly identical, once again. FET7 with the plate off is slightly advantaged, though we’re not confident enough to state if that’s because additional air is getting into the backplate. That could be the case, since FET7 is also in the exact spot where there is no thermal pad coverage to the backplate, since the LED tape is there instead. This stated, the difference is hardly more than 1C, so we can’t confidently confirm a meaningful difference.
The PCB backside temperatures are also effectively identical, even with the help of the direct airflow.
GPU diode temperatures are not meaningfully different, either.
Based on our testing, it does not appear that Gigabyte’s copper insert is aiding with temperatures in any way whatsoever. That said, it’s probably conducting some of the heat away from the caps on the back-side of the GPU, and you’d be able to measure that by sticking a thermocouple to the caps – it just so happens that this is completely irrelevant. That doesn’t impact actual GPU temperatures. That’s not an area that needs conduction and dissipation to cool. It won’t run that hot, and the copper/fiberglass PCB mixture doesn’t much care what temperature it is. There’s no advantage in any temperatures that matter.
This is a marketing stunt. It may cool those four caps, but that’s not going to matter for anyone. It certainly doesn’t impact the GPU or VRM in a meaningful way; at least, not at the default fan speed of 60% when under load. There might be more of a difference at lower fan speeds, it’s just not going to be a relevant one if so. This is doubly the case since the card tends to run at 60% during any gaming scenarios.
Gigabyte GTX 1080 Ti Xtreme Noise Levels vs. MSI Gaming X
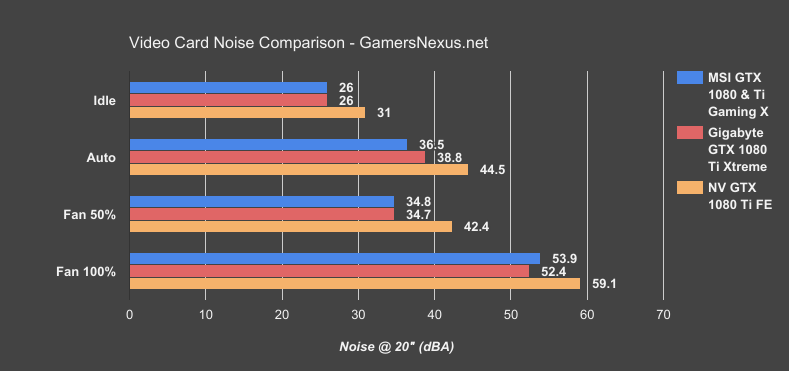
MSI's Gaming X ($750) tends to auto at around 55% when under an equivalent load to the Xtreme card, which keeps its auto around 60% (with the installed fan curve). Out of box, that makes MSI a bit quieter under auto -- ~2dBA total -- but not necessarily in an appreciable fashion (we generally can’t notice until the difference is >3dBA). 50% fan speed keeps the two cards mostly tied, as is their GPU diode temperature. Gigabyte stays a bit quieter at 100% fan speed, though you should really never be spinning this fast, anyway, as it’s entirely unbearable and an unrealistic scenario.
Versus the FE card, either the MSI or Gigabyte solutions would be a substantial upgrade.
Continue to Page 4 for synthetic tests.
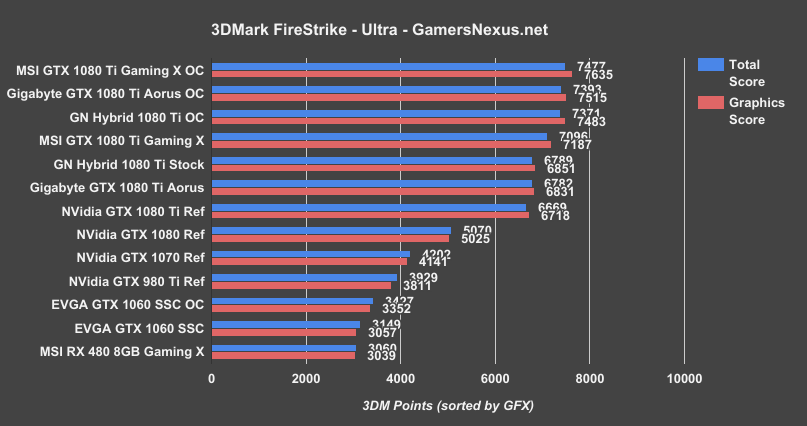
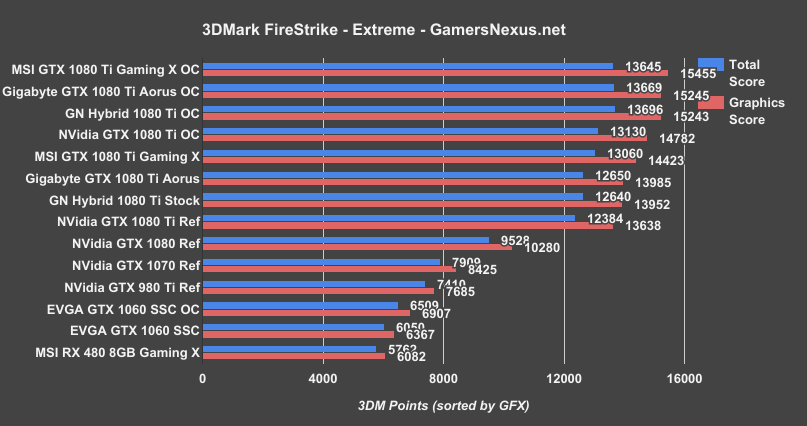
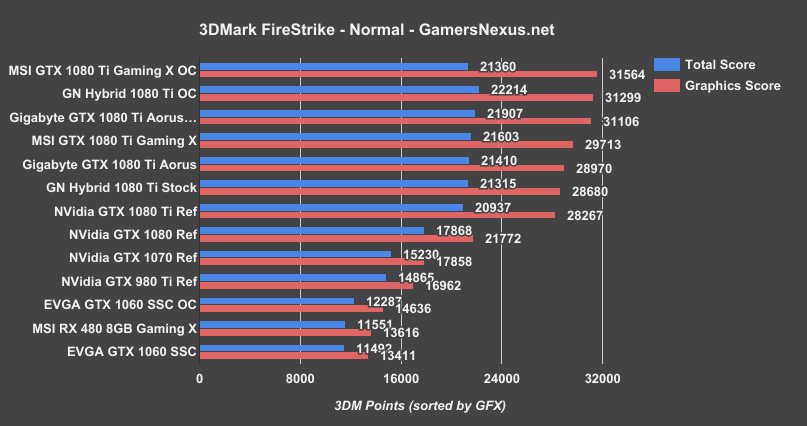
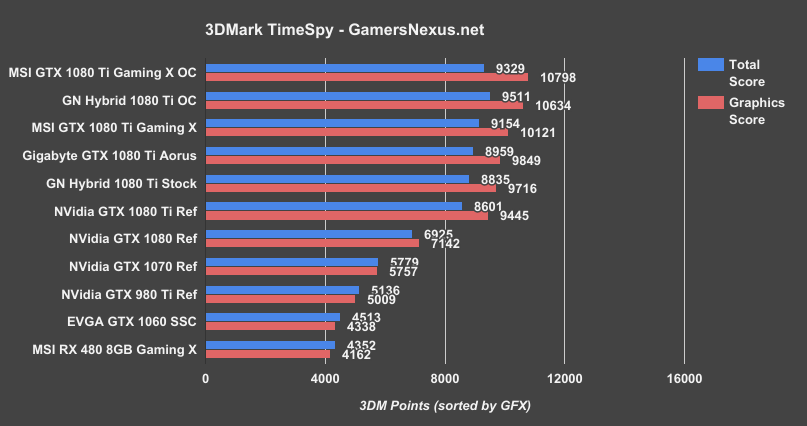
Synthetic Benchmarks: 3DMark FireStrike & TimeSpy
We don't spend a lot of time analyzing results from the synthetic tests. This space is reserved simply for presenting the charts for popular synthetic utilities (3DMark Firestrike, Firestrike Ultra, and Firestrike Extreme, alongside Timespy) to provide a baseline understanding of performance. For gaming results, visit the next page. The data analysis is more in-depth in the following and final page, though we've got the 3DM numbers for folks who want them.
Starting off with 3DMark, we're running Firestrike on Ultra (4K), Extreme (1440p), and Normal (1080p) presets without modification. The tests are run in exclusive full-screen.
Continue to Page 5 for gaming benchmarks.
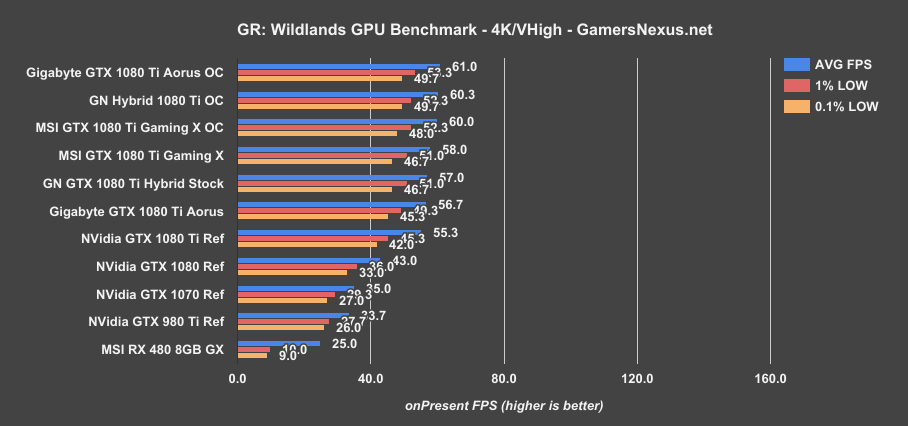
Ghost Recon: Wildlands GPU Benchmark: 1080 Ti Xtreme vs. Gaming X
Ghost Recon: Wildlands starts off our GPU benchmarking. With 4K resolution, the MSI GTX 1080 Ti Gaming X ($750) and Gigabyte GTX 1080 Ti Aorus both place around 57-58FPS AVG. Our stock Gaming X model runs a higher maximum frequency given the variance in, one, ASIC quality, and two, the 300W out-of-box power limit on the Gaming X helps increase clock headroom over the 275W Aorus. You could max-out the power sliders on each to get something similar to our Gaming X & Aorus OC numbers on this chart, though.
As stated in the Gaming X review, there’s not a ton to be gained from overclocking these cards, and frametime variance increases as clock stability becomes threatened. The GN Hybrid mod of the FE card ($700) removed a thermal limit, giving it more headroom than you’d gain on either of these cards, as both are adequately cooled.
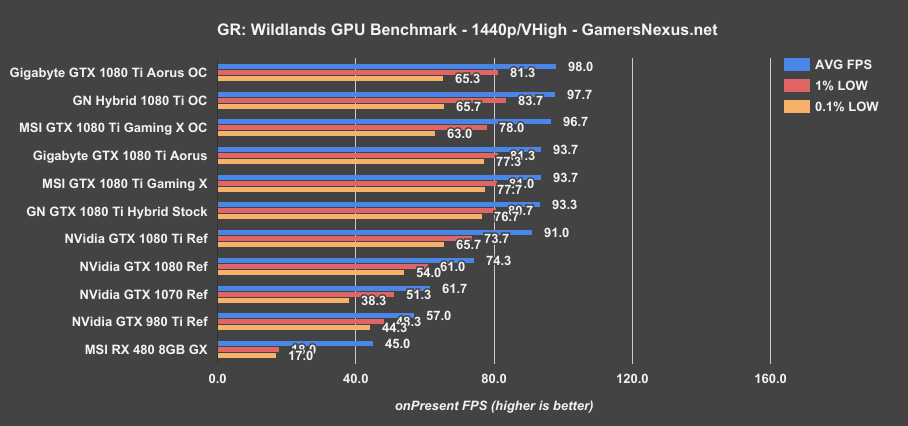
At 1440p, it’s more of the same. The GTX 1080 Ti Xtreme and GTX 1080 Ti Gaming X, both $750 cards, run at about the same FPS – roughly 94FPS AVG, roughly 81FPS 1% lows, and roughly 77FPS 0.1% lows. The cards provide an identical experience at 1440p.
Overclocking gives some boost to the AVG FPS, but as seen in the Gaming X OC slot, we do take a slight hit to frametimes. It’s ultimately a trade of how much you want to give in consistency for the higher overall throughput. Even the Hybrid OC had some stability issues decreasing its frametime consistency.
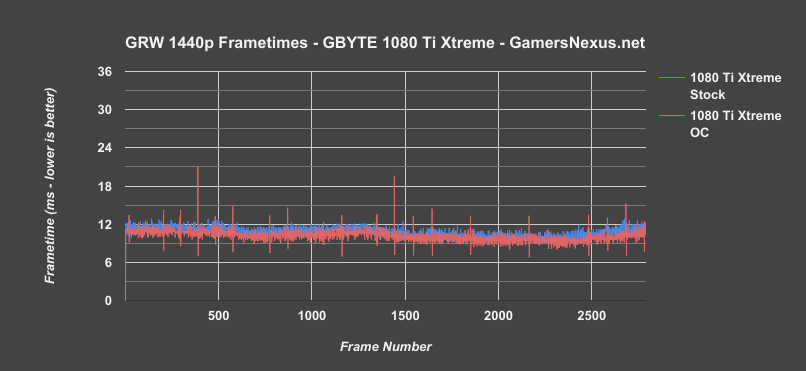
We can actually plot that. There’s a frametime plot above, showing the frametimes of a stock versus overclocked card. It’s not necessarily an appreciable difference to the end user, but illustrates a point that overclocking these high-end devices means encountering voltage or power constraints that choke the clock.
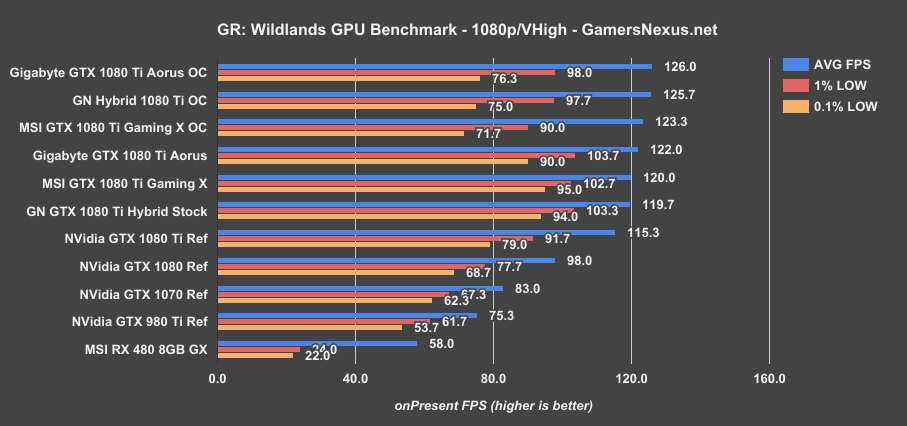
Finally, at 1080p, the Aorus and Gaming X again perform more or less identically – we’re sort of within standard deviation test-to-test, here. Overclocking can get us a bump in average FPS with the same potential pitfalls as earlier discussed. Both the Gaming X and Aorus are about 5.8% better than the stock FE card, or about 1.9% better than the FE card when the thermal constraint is removed.
For Honor Benchmark: Gigabyte 1080 Ti Xtreme vs. MSI 1080 Ti Gaming X
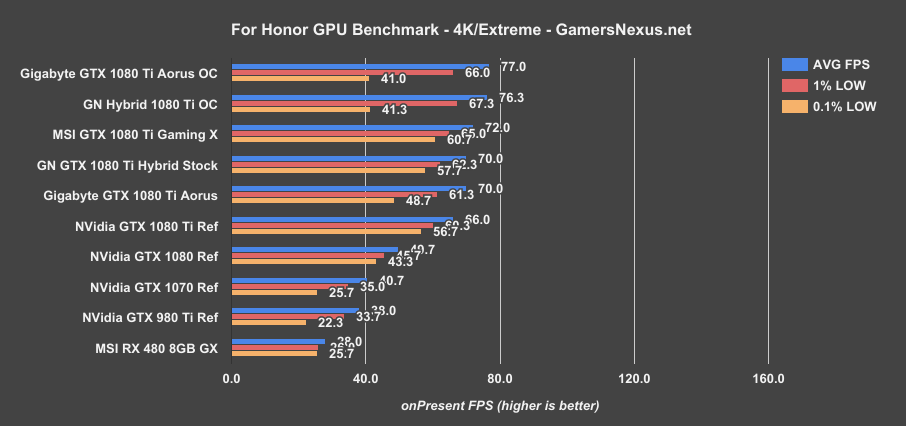
We’re now moving on to For Honor, which is one of the most GPU-intensive games we currently test. At 4K resolution, the Aorus Xtreme card lands itself around where our liquid-cooled mod of the Founders Edition card performs, or about 2FPS behind the Gaming X. That’s the power limit coming into play again, as we’re running at full tilt for these 4K benchmarks.
Overclocking produces particularly bad frametimes in this title, so we generally leave it out; the experience is not much improved over the stock card. At least, not unless you’re willing to run a very low overclock. In the best circumstances, we’re getting an extra 6-9% on average FPS out of the 1080 Ti cards.
Here’s the same game with 1440p testing. The Aorus card performs about the same as our Hybrid FE mod, and a few FPS under the 1080 Ti Gaming X. There’s not a significant difference here, yet again, though they are about the same price. Pushing the power limit a bit higher would more or less equalize these cards.
1080p is still fairly GPU constrained in For Honor, believe it or not, though we do start running into other limitations.
DOOM (Vulkan) GPU Benchmark: Gigabyte Xtreme vs. Gaming X 1080 Ti
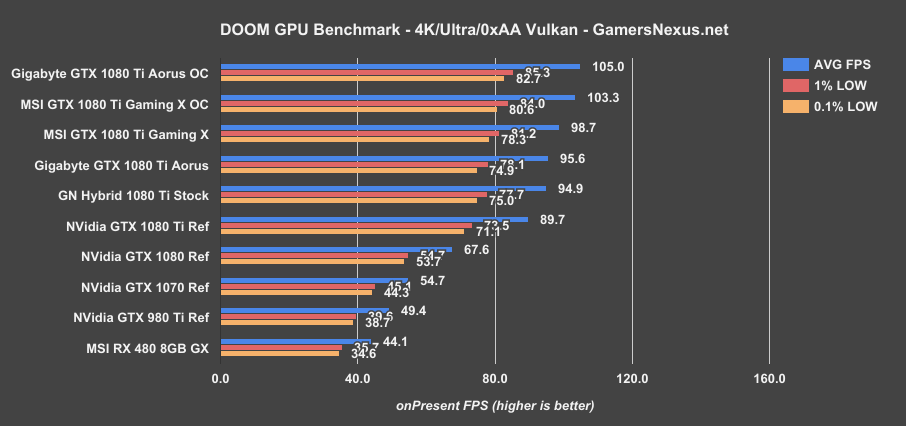
Running DOOM at 4K with Vulkan for the API, we see the Aorus card about 3% behind the Gaming X in out-of-box performance, with overclocking actually proving useful in this game. Clock stability is a whole lot better in DOOM than in For Honor, and so the frametimes generally see a performance improvement rather than a performance hit. We’ll highlight the OC numbers on the chart between the Gaming X and Xtreme card. They try to differentiate a bit more in this department, but out-of-box performance is mostly equal, with the MSI Gaming X taking a slight lead stock. The FE 1080 Ti card runs about 6% slower than the Aorus card when using its stock heatsink, or about .7% slower than the Aorus card when using our FE Hybrid mod.
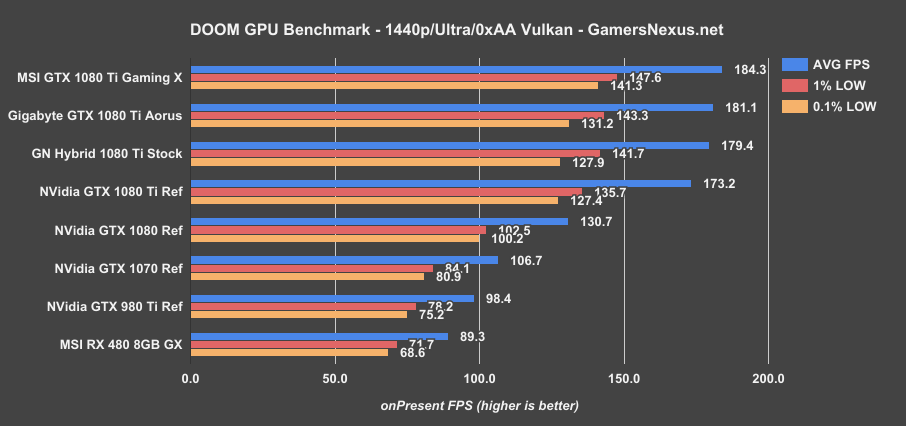
Running at 1440p and 1080p starts triggering the 200FPS maximum FPS limit in DOOM, so we don’t get a perfectly clear picture of performance on these devices.
Sniper Elite 4 (Dx12): Gigabyte Xtreme 1080 Ti vs. Gaming X
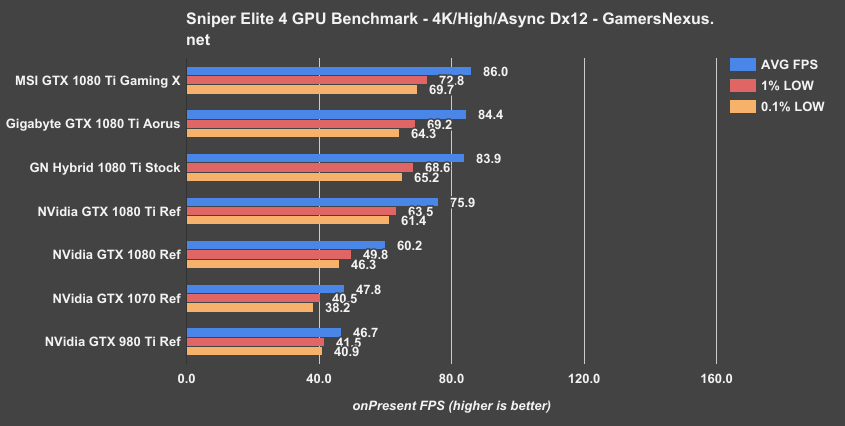
Moving on to Sniper Elite 4 with Dx12 and Async Compute, the Aorus Xtreme card runs at around 84FPS AVG, with lows at 69 and 64FPS, respectively. MSI’s Gaming X operates approximately 1.9% faster out-of-box, with averages at 86 and GN’s coined 1% LOW and 0.1% LOW metrics at 72.8 and 69.7FPS. This difference isn’t appreciable to the end-user, but is measurable and repeatable. We are again seeing the out-of-box power configuration at play. This is easily modified if you really need that extra frame.
Versus the unmodified FE card, the Aorus Xtreme runs about 11% faster, or about 0.5% faster than the liquid-cooled Hybrid, as we’re not hitting a thermal limit on the clocks.
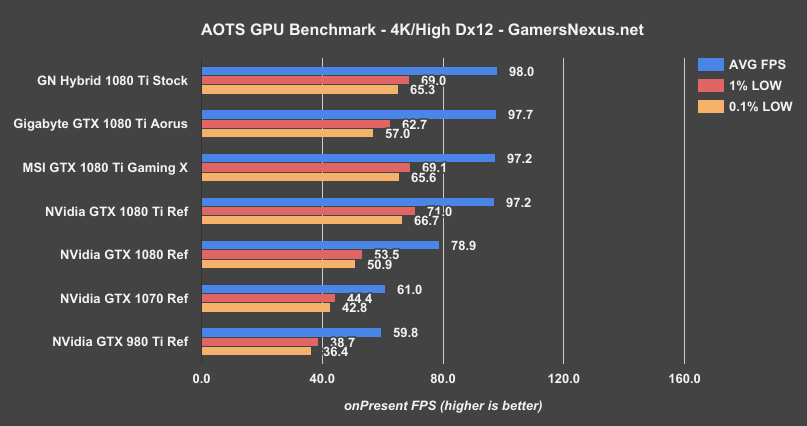
Ashes of the Singularity GPU Benchmark
Mass Effect: Andromeda GPU Benchmark
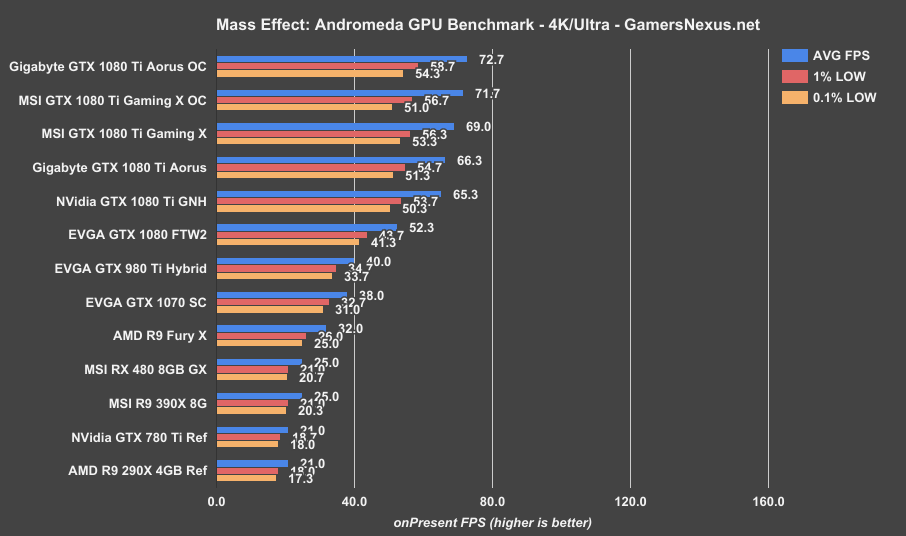
Mass Effect: Andromeda at 4K resolutions shows the same scaling as all the other games: Out of box, the Aorus places a bit below the Gaming X, though overclocking assists the Gigabyte card in some ways. The difference between the stock devices is not appreciable to the end user, once again, but is measurable and repeatable. We’re at 69FPS AVG, 56FPS 1% LOW, and 53FPS 0.1% LOW on the Gaming X, or 66FPS AVG, 55FPS 1% LOW, and 51FPS 0.1% LOW on the Aorus Xtreme.
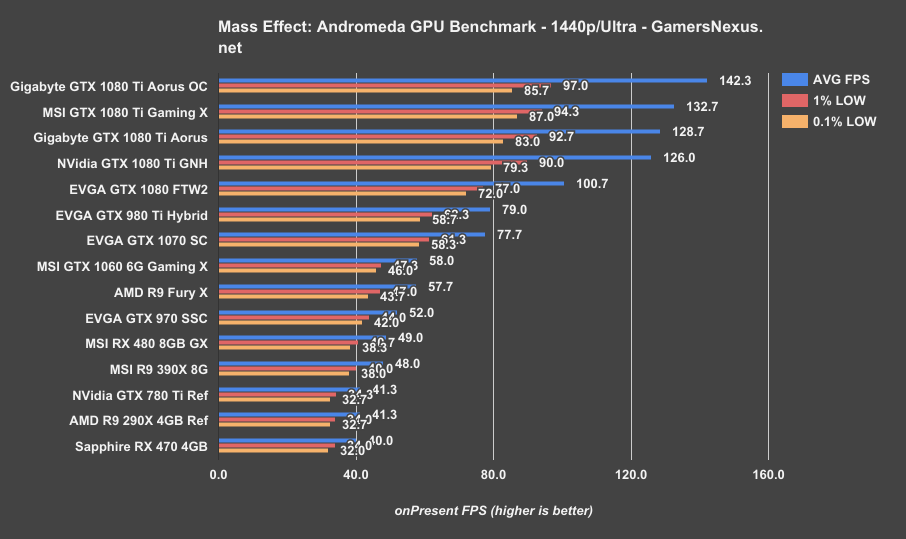
1440p follows this trend, with the cards now at 133FPS and 129FPS, respectively. The lows scale linearly on these. This difference makes the Gaming X about 3% faster out of box, just like in previous tests. The Aorus Xtreme is about 2% faster than a thermally unconstrained FE card, using our Hybrid mod.
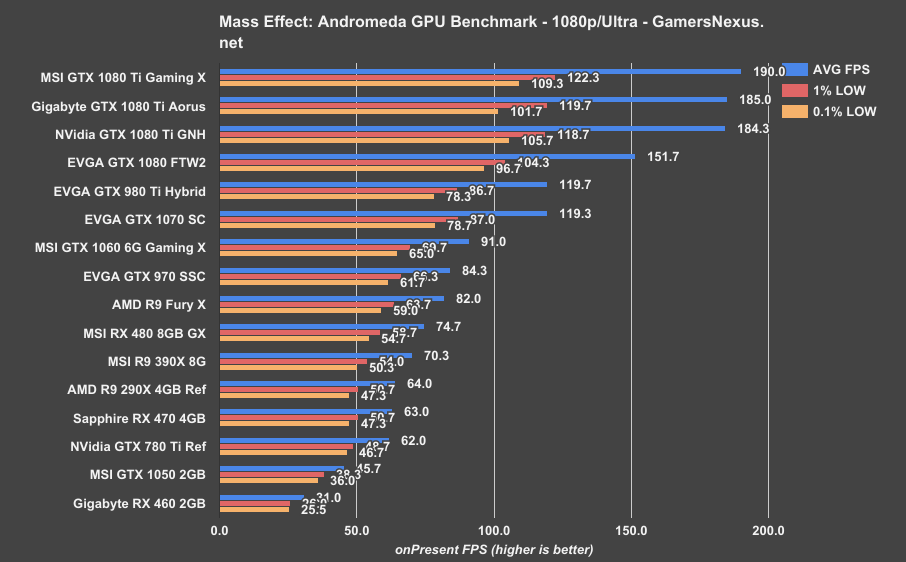
Above are the 1080p results. Won’t spend a lot of time talking about those.
OC Stepping
If you’re curious about the OC stepping / progression for this card, our notes are below:
| Peak Clock (MHz) | AVG Clock (MHz) | Core Offset (MHz) | MEM CLK (MHz) | MEM Offset (MHz) | Power Target | Voltage | Pass/Fail |
| 1835 | 1772 | 0 | 1404 | 0 | 100 | 0.9 | P |
| 1962 | 1924 | 0 | 1404 | 0 | 150 | 1.025 | P |
| 2037.5 | - | 100 | 1404 | 0 | 150 | 1.031 | F |
| - | - | 50 | 1404 | 0 | 150 | 1.031 | F |
| - | 2000 | 25 | - | 100 | 150 | 1.093 | F |
| 2025 | 2000 | 25 | - | 1.093 | F | ||
| 1987 | 1949 | 15 | 1404 | 0 | 130 | 1.043 | P |
| 2000 | 1962 | 15 | 1404 | 0 | 140 | 1.062 | P |
| 2000 | 1962 | 20 | 1404 | 0 | 140 | 1.062 | P |
| 2000 | 1962 | 20 | 1418 | 50 | 140 | 1.062 | P |
| 2000 | 1962 | 20 | 1423 | 75 | 140 | 1.062 | P |
| 2000 | 1962 | 20 | 1429 | 100 | 140 | 1.062 | Flicker |
| 2000 | 1962 | 20 | 1429 | 100 | 150 | 1.062 | P |
| - | - | 25 | 1429 | 100 | 150 | 1.075 | F |
| 2012 | 1987 | 20 | 1429 | 100 | 150 | 1.081 | P |
| 2012 | 1987 | 20 | 1441 | 150 | 150 | 1.081 | P |
| 2012 | 1987 | 20 | 1448 | 175 | 150 | 1.081 | P |
| 2012 | 1987 | 20 | 1460 | 225 | 150 | 1.081 | P |
| 2012 | 1987 | 20 | 1473 | 275 | 150 | 1.081 | P |
| 2012 | 1987 | 20 | 1485 | 325 | 150 | 1.081 | Flicker |
| 2012 | 1987 | 20 | 1475 | 300 | 150 | 1.081 | P |
| 2012 | 1987 | 25 | 1475 | 300 | 150 | 1.081 | F (crash, pwr cap) |
The Gaming X is covered in the Gaming X review.
Conclusion: Gigabyte 1080 Ti Aorus Xtreme or MSI Gaming X?
The Gigabyte GTX 1080 Ti Aorus Xtreme ($750) is one of the largest cards we’ve looked at, particularly in the cooler department. The VRM setup is similar to the Strix with regard to power capabilities, but still runs into similar OC limitations as the Gaming X. These cards are already near their maximum clock, and pushing higher begins threatening frametime stability in ways that may sometimes force toggling the OC for certain games.
The Gaming X ($750) is roughly 3% faster out of box than the Aorus Xtreme, but overclocking allows that to more or less equalize. That said, it’s not necessarily worth overclocking the 1080 Ti cards given how close the voltage and power constraints are.
Looking at thermals, the two cards are also similar; Gigabyte runs a bit warmer on the FETs, but also uses a different power design. GPU diode temperature isn’t too dissimilar, noise output is effectively identical at 50% speeds, and performance overall is within a few percentage points.
Price is also the same as the Gaming X. If you want cards that do well out of box and never want to overclock an FE card, then these are fine considerations that can grant 6-11% performance uplift over the reference cards. If you remove the thermal constraint, that advantage is closer to 1-3% over FE.
It comes down to picking the card that best fits the build, both physically and aesthetically.
Editor-in-Chief: Steve Burke
Video Producer: Andrew Coleman