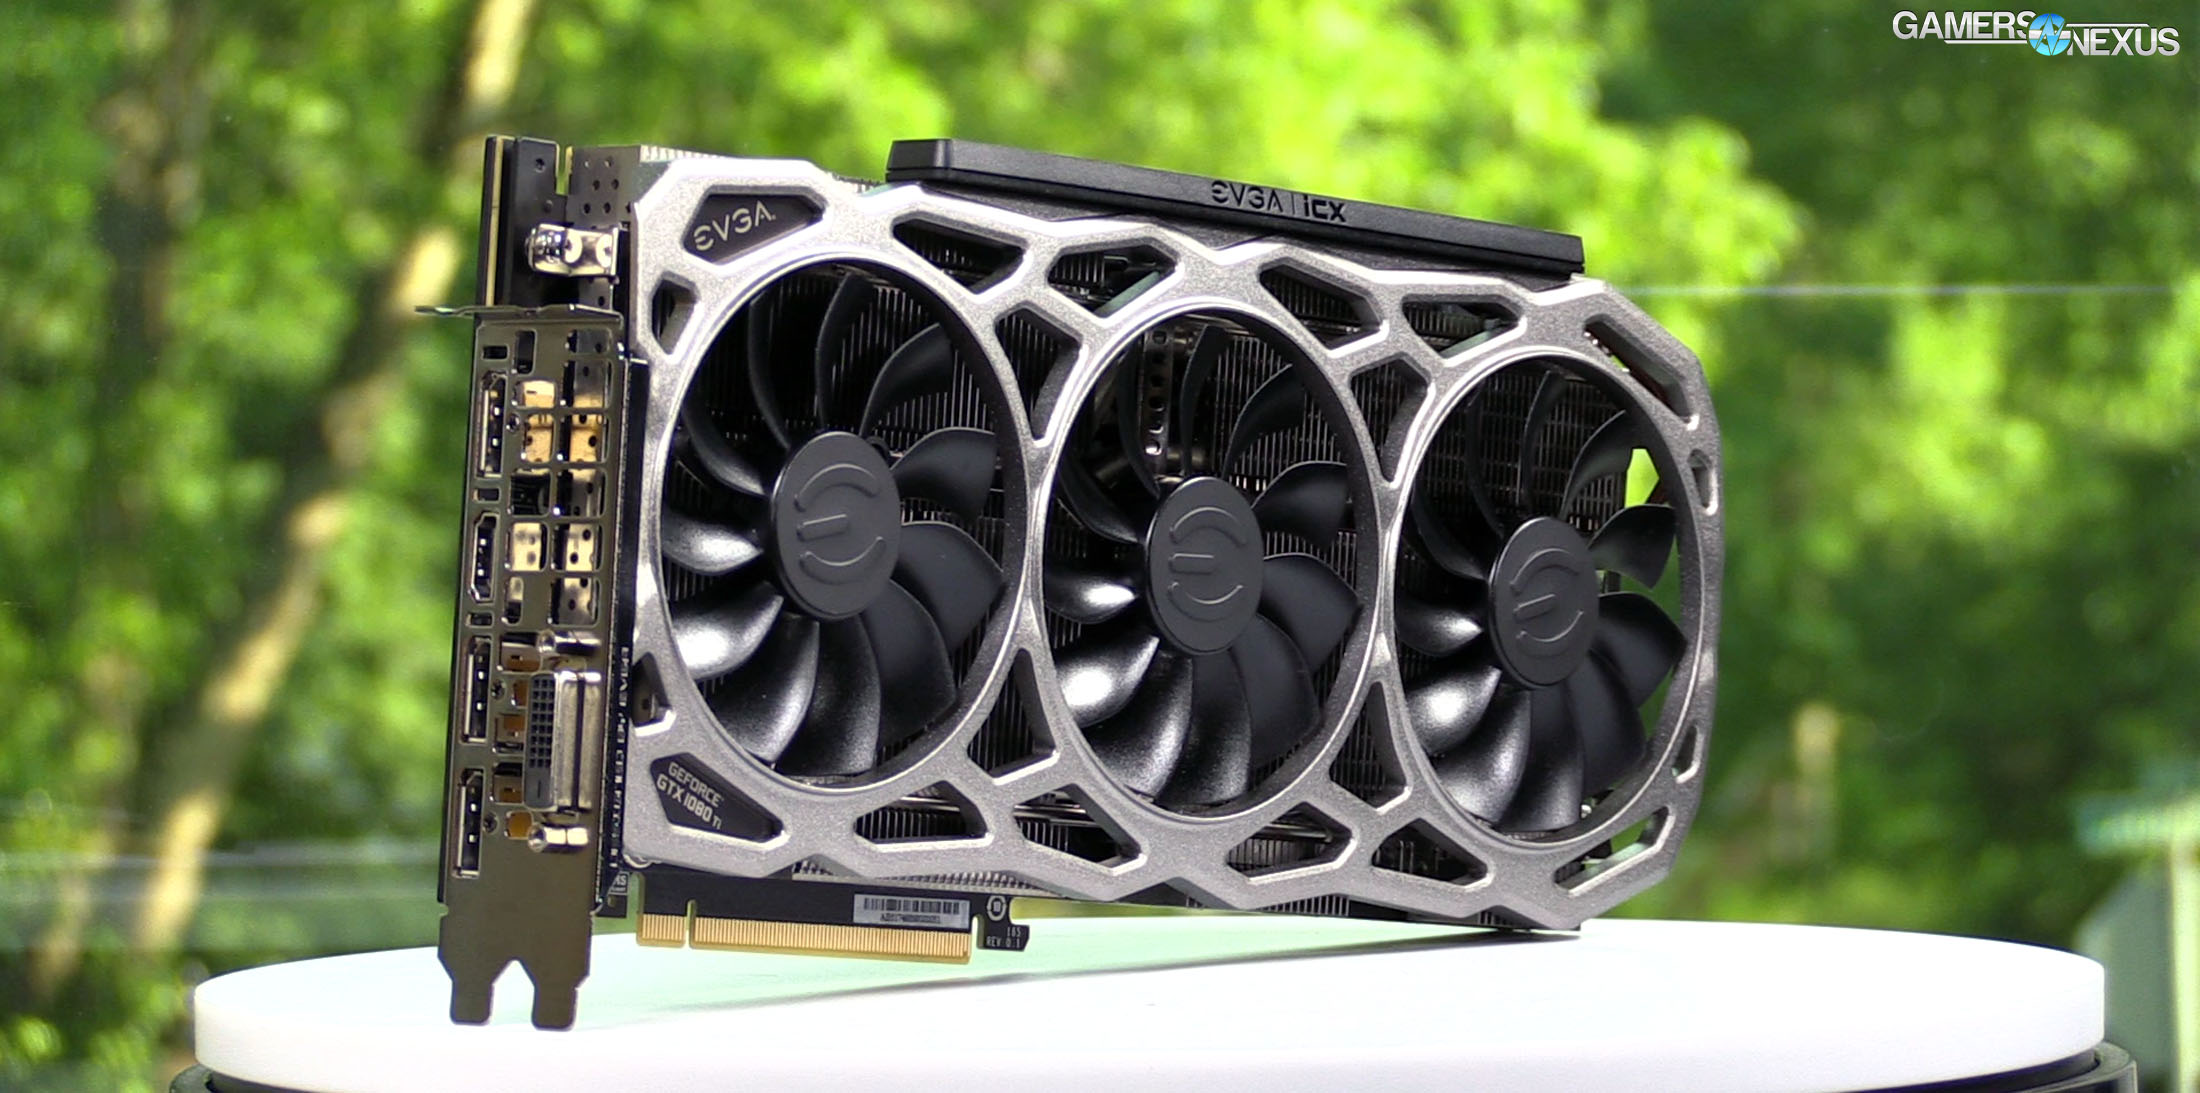
The EVGA GTX 1080 Ti FTW3 is the company’s attempt at a 3-fan cooler, entering EVGA into the three-fan ranks alongside ASUS, Gigabyte, and MSI. The difference with EVGA’s card, though, is that it’s a two-slot design; board partners have gone with a “bigger is better” mentality for the 1080 Ti, and it’s not necessarily advantageous. Sure, there are benefits – taller cards mean taller fans, like on the Gaming X, which results in slower rotation of fans without sacrificing volume of air moved. It follows then that taller fans on taller cards could be profiled to run quieter, without necessarily sacrificing thermal performance of the GPU, VRM, and VRAM components.
But we’re testing today to see how all that plays out in reality. In our EVGA GTX 1080 Ti FTW3 review, we benchmark the card vs. EVGA’s own SC2, MSI’s 1080 Ti Gaming X, Gigabyte’s Xtreme Aorus, and the Founders Edition card. Each of these also has an individual review posted, if you’re looking for break-outs on any one device. See the following links for those (listed in order of publication):
- EVGA GTX 1080 Ti SC2 review
- Gigabyte GTX 1080 Ti Xtreme Aorus review
- GN Hybrid 1080 Ti reference review (with liquid)
- MSI GTX 1080 Ti Gaming X review
- NVidia GTX 1080 Ti Founders Edition review
It’s Not About Gaming Performance
Having reviewed this many cards in the past few weeks, it should be apparent to everyone that same-GPU cards aren’t really differentiated by gaming performance. Gaming performance is going to be within a few percentage points of all devices, no matter what, because they’re ultimately governed by the GPU. A manufacturer can throw the world’s best PCB, VRM, and cooler together, and it’s still going to hit a Pascal wall of voltage and power budget. Further, chip quality dictates performance in greater ways than PCB or VRM will. We have duplicates of most of our cards, and they can perform 1-3% apart from one another, depending on which boosts higher out-of-box.
To this end, that also means that declaring hard victors is sort of rough – all those statements are made based on our samples, but it’s always possible that one card might perform +1% in our sample, but -1% in another sample. Among other reasons, this is why gaming performance gets a back seat once we’ve determined a baseline for AIB partner performance of a new GPU.
What matters more is the cooling solution, the PCB quality, and the noise levels. We are therefore checking for things like component quality (already done separately, but revisited below), thermals, and noise output. Gaming, again, gets a back seat. Overclocking is also inevitably limited by Pascal itself, so even that is relatively unexcited for same-GPU video card comparisons.
EVGA GTX 1080 Ti FTW3 PCB, VRM, & Tear-Down
We’ve already posted videos showing a tear-down of the EVGA 1080 Ti FTW3 (found here) and analyzing in great depth the VRM & PCB of the FTW3.
Recapping the most important bits: The GTX 1080 Ti FTW3 uses an excellently engineered PCB and power delivery solution, accompanied by an equally over-engineered cooling solution. The Vcore VRM is comprised of Alpha-Omega Semiconductor E6930 Dual-N MOSFETs, which package high-side, low-side, and diode components into the same package. There are twenty total FET packages on the board, ten driver ICs, and five doublers, combined with an NCP81274 voltage controller. The voltage controller is an 8-phase controller capable of 1.2MHz switching frequency. EVGA is using NCP81162 doublers to load balance between the two phases, largely eliminating the risk of out-of-balance current between two phases (as they are balanced by EVGA’s doublers). This also reduces strain on the 12V rail, which should make the power supply happy.
EVGA’s drivers are also from NCP, using NCP81158 drivers, though they can’t quite keep up with the rise and fall times of the dual-N FET rise and fall times (and can’t support higher gate-drive voltages than 5v).
Learn more about all of this in our PCB breakdown video:
As for the rest of the card, it’s largely comprised of overcompensating cooling solutions across all devices – yes, even fan controllers are connected via thermal pad – and three fans to individually cool partitions of the card. The heatsink is split into two primary halves – GPU+MEM and PWR – and uses a mix of EVGA’s new fin designs to improve cooling efficiency. Although the fin density and placement aren’t all that unique, the tail of the fins can be: EVGA switches between straight fins (with no contact to componentry), L-shaped fins (with contact to thermal pads, but permitting airflow), and closed fins (for full contact, but no airflow). The type of fin used depends on which component that part of the cooler covers; VRM components tend to contact the finstack via L-shaped fins, whereas less critical inductors are under straight fins.
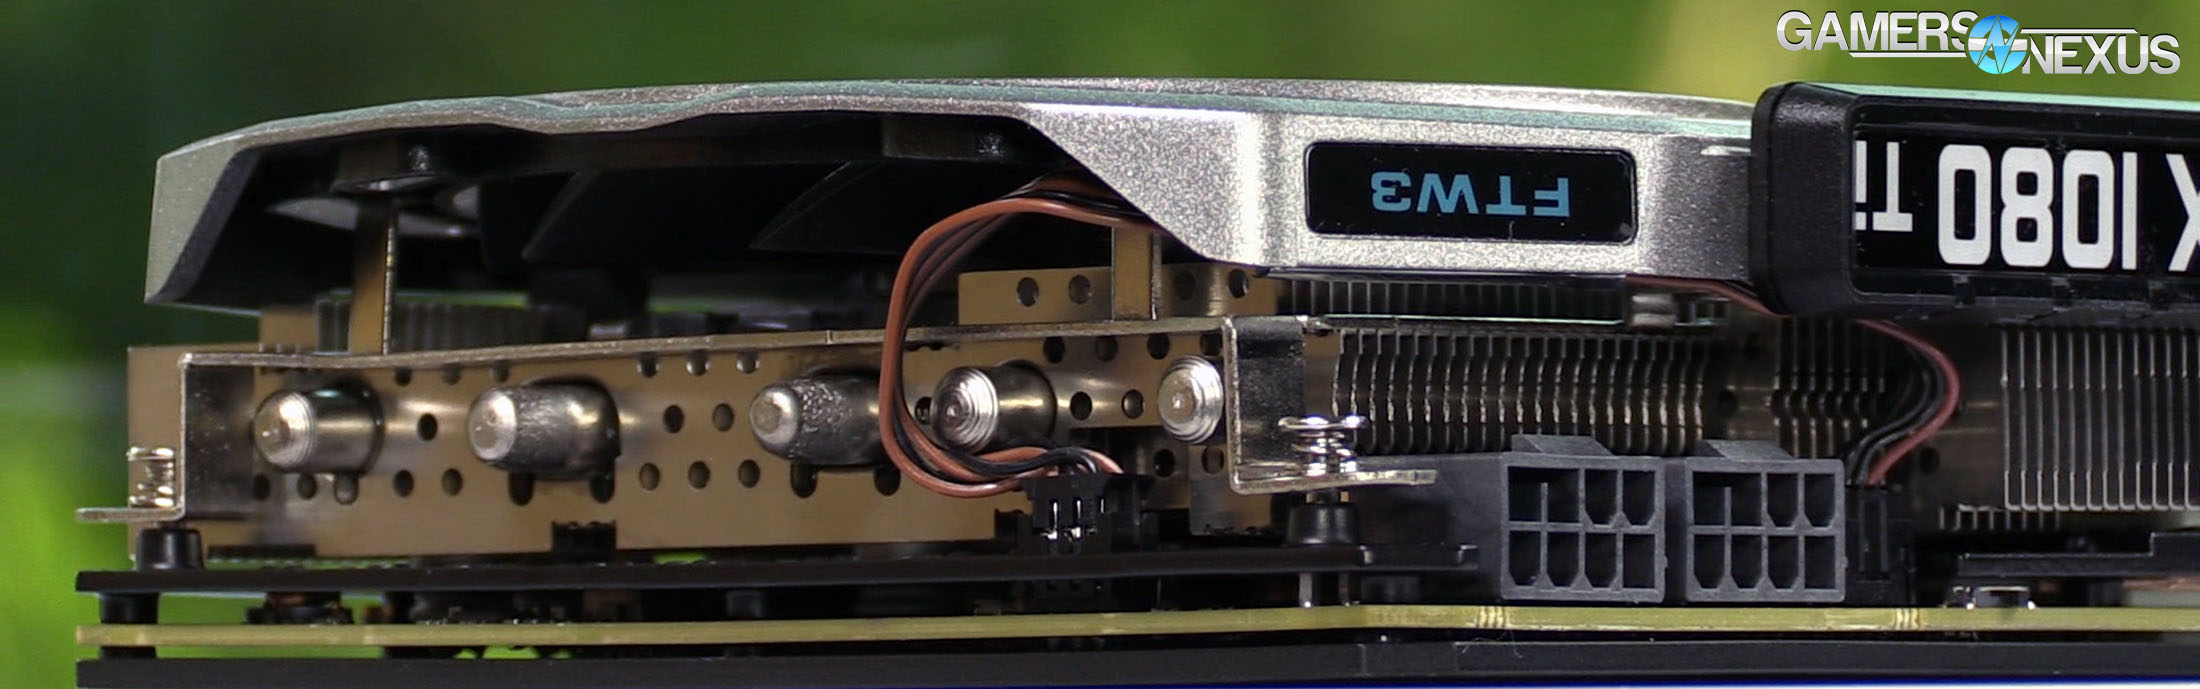
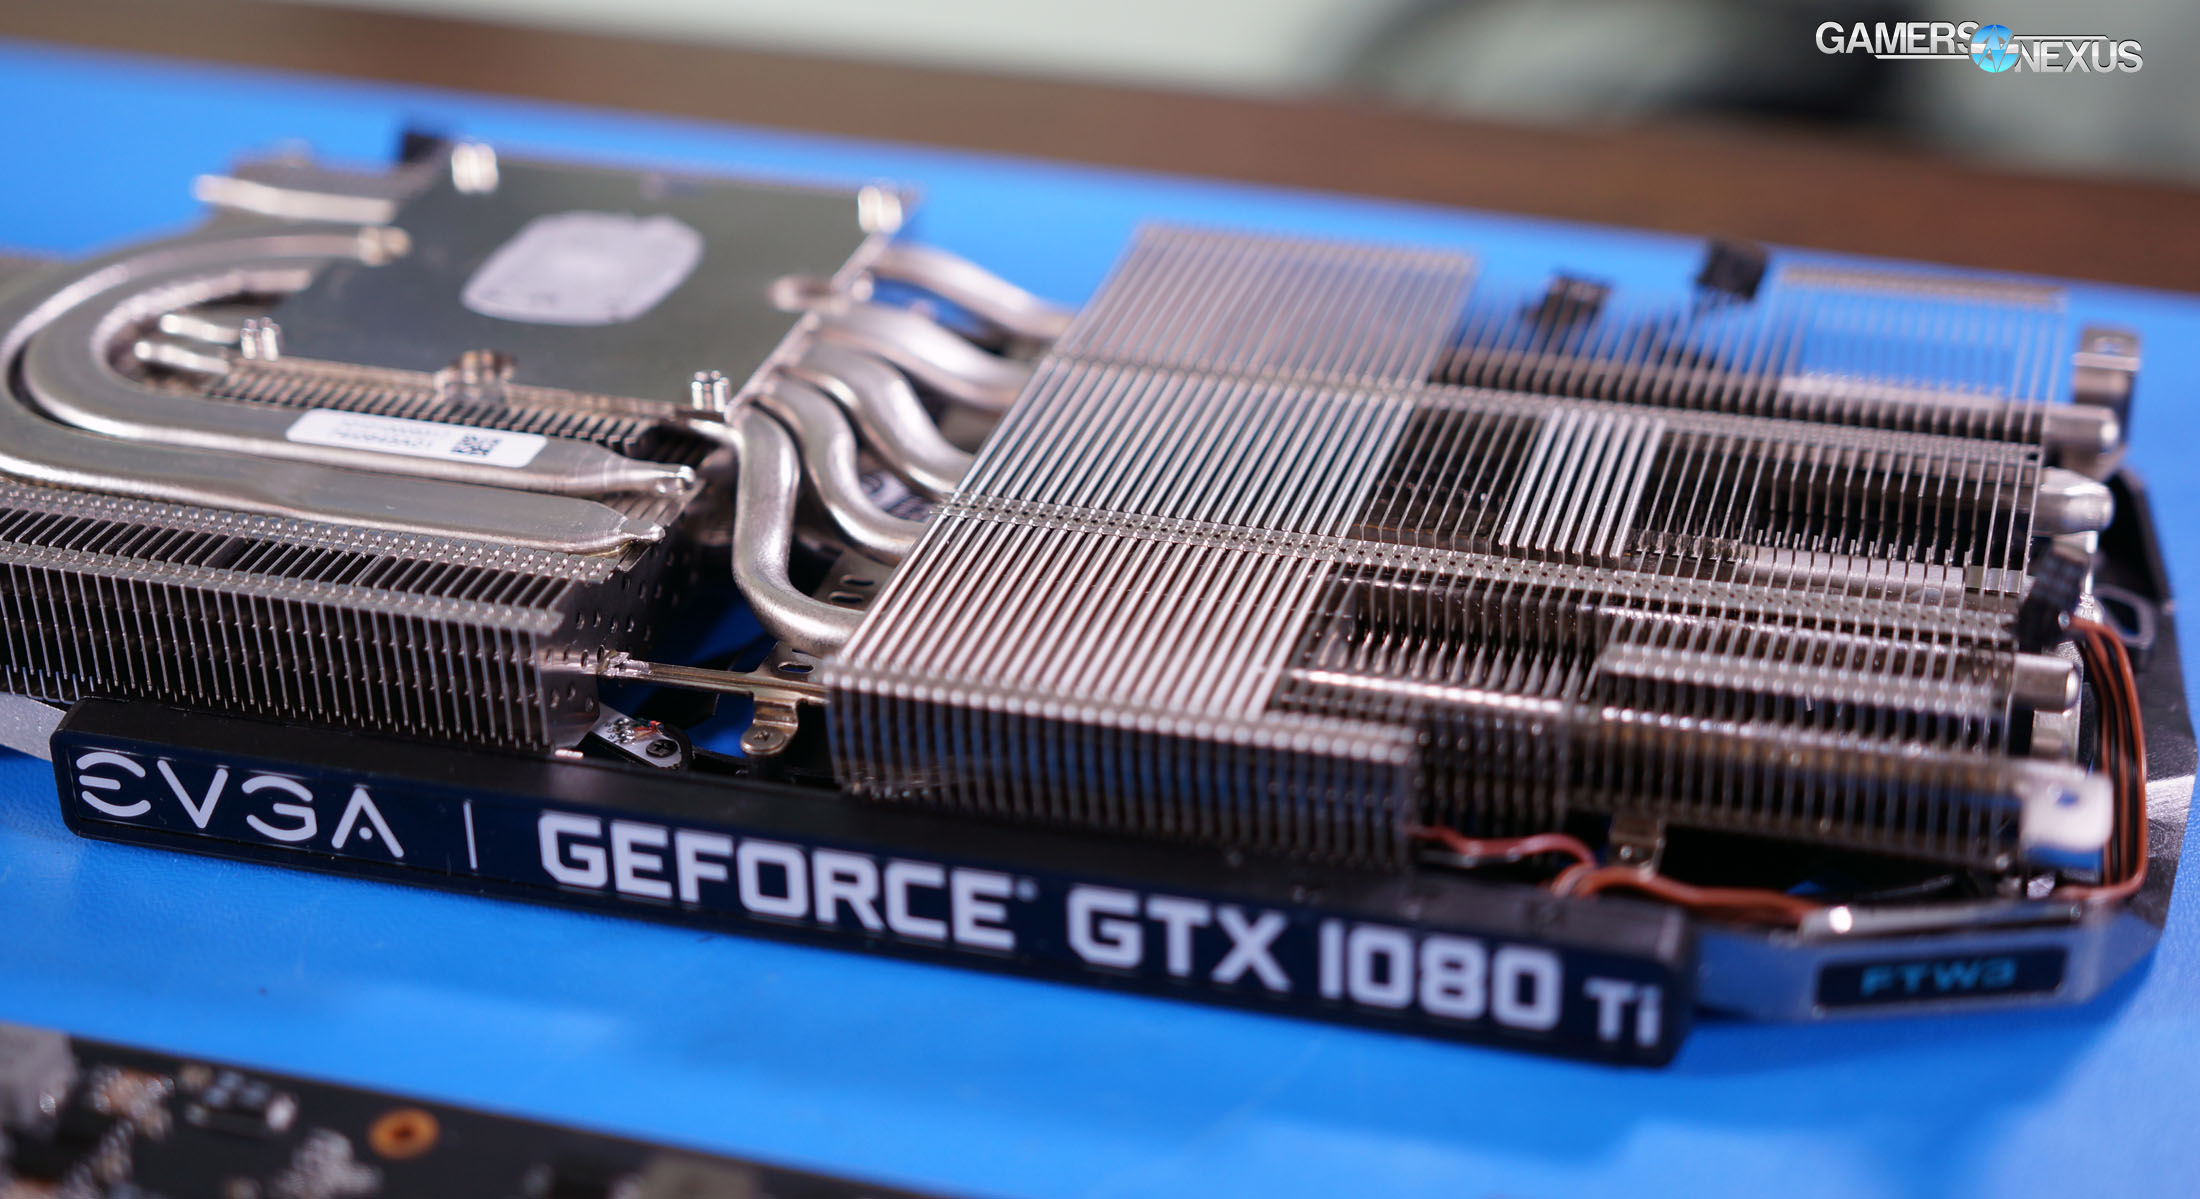
Several MCUs are on the card for individual and asynchronous fan control, slaving to one of EVGA’s somewhat aggressive fan profiles (more on that momentarily), and the MCUs report to a functional RGB LED GPM meter on the card. GPM means “GPU,” “Power,” and “Memory.” This card is laid-out in a fashion that it’s more accurate to say GMP. Graphics and memory fans are on the left, power is on the right.
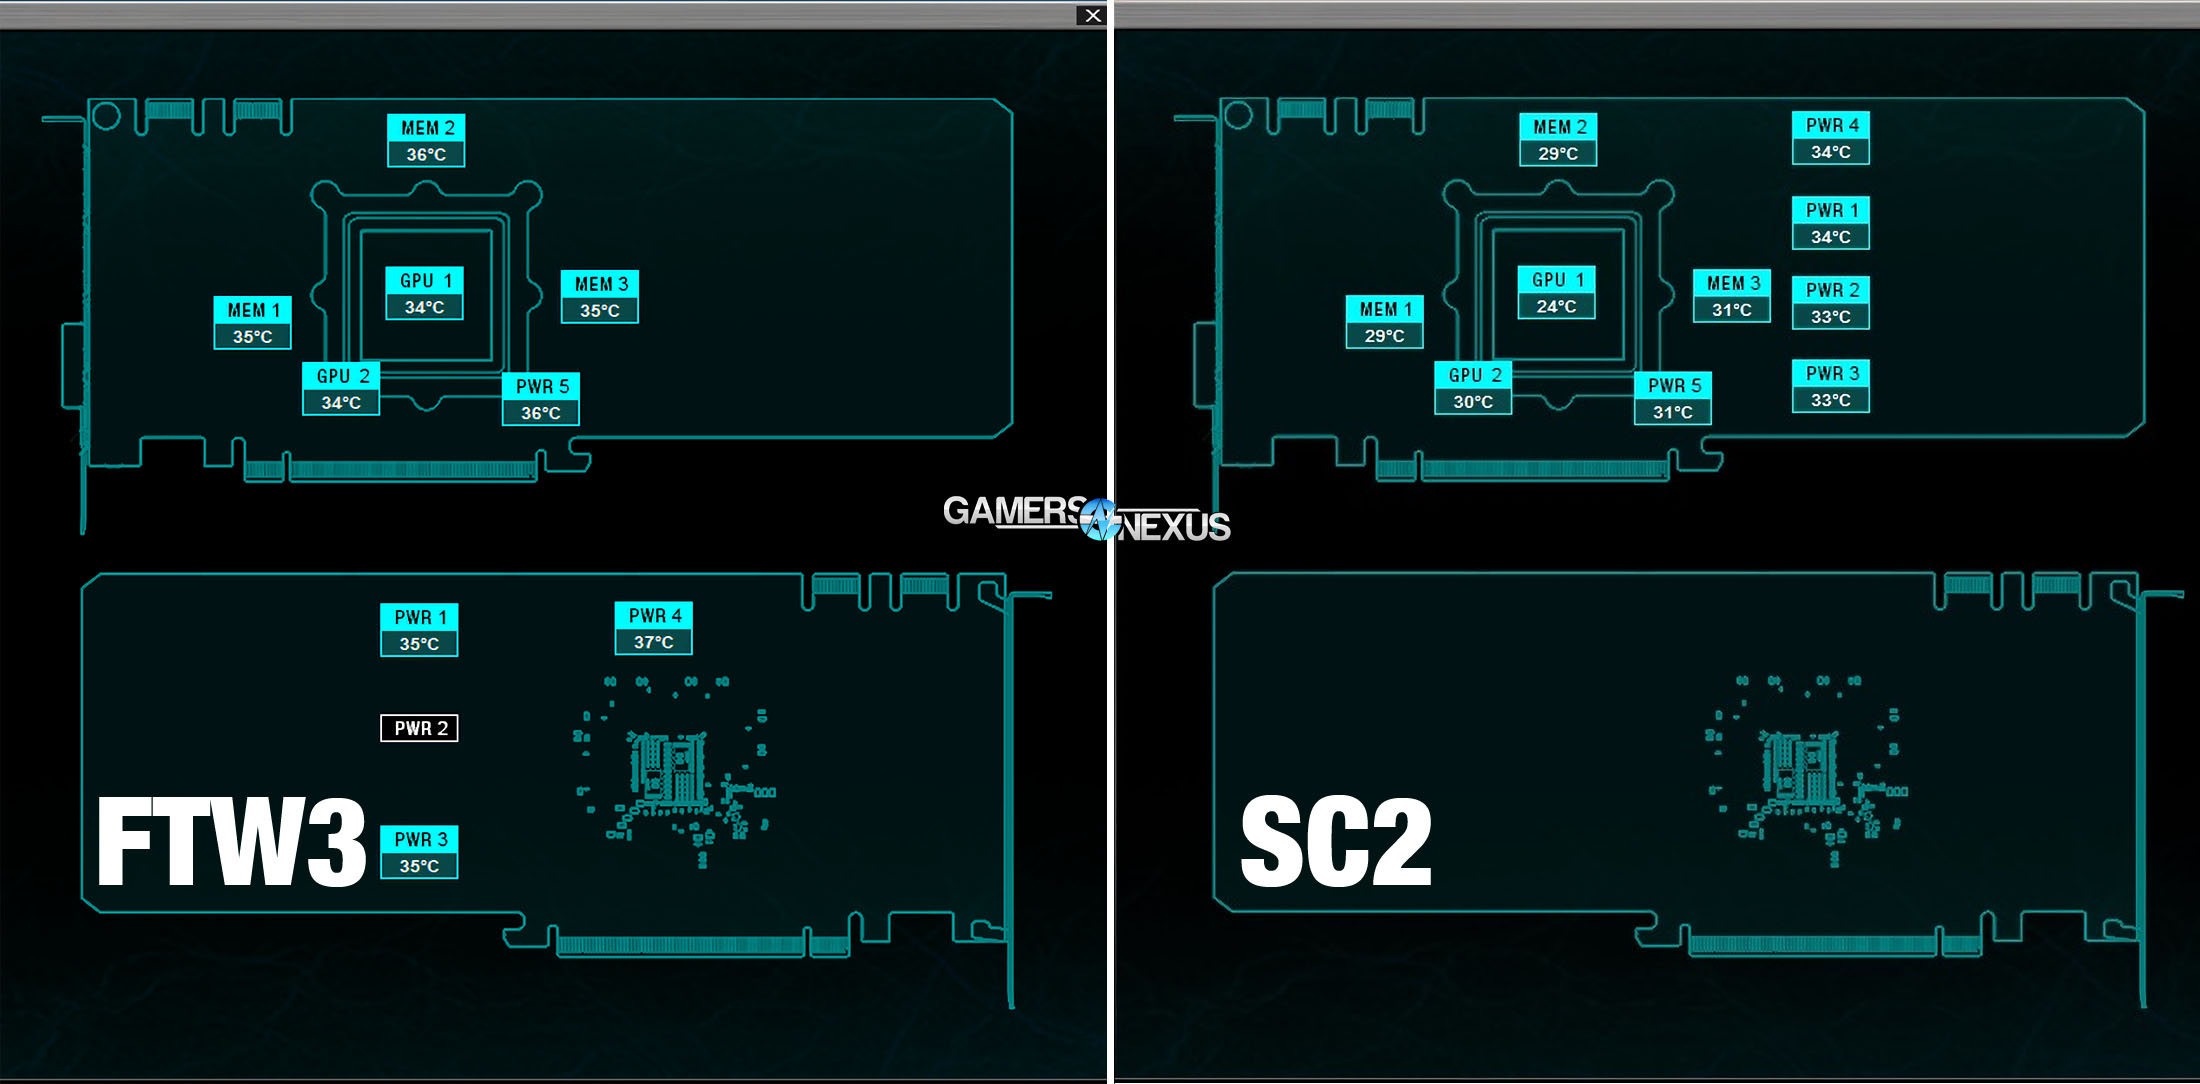
As for thermistors used, we previously detailed in great depth that EVGA is using negative type thermistors (NTCs) in 9 locations on the board. What’s important here is that the location of those thermistors is not the same between EVGA ICX devices, so PWR1 does not necessarily equal PWR1 between two cards. The SC2 card, for instance, uses a reference nVidia FE PCB with EVGA’s NTC thermistors positioned all along the front of the board, while the FTW3 PCB positions a few on the back-side. PWR4 is the biggest difference, which we’ll talk about in the thermal section.
You cannot compare EVGA ICX thermistor readings between cards without scrutiny.
The two can be compared, but only insofar as GPU and MEM readings (and even then, only if EVGA never changes which memory modules receive which reporting tag).
GPU Testing Methodology
For our benchmarks today, we’re using a fully rebuilt GPU test bench for 2017. This is our first full set of GPUs for the year, giving us an opportunity to move to an i7-7700K platform that’s clocked higher than our old GPU test bed. For all the excitement that comes with a new GPU test bench and a clean slate to work with, we also lose some information: Our old GPU tests are completely incomparable to these results due to a new set of numbers, completely new testing methodology, new game settings, and new games being tested with. DOOM, for instance, now has a new test methodology behind it. We’ve moved to Ultra graphics settings with 0xAA and async enabled, also dropping OpenGL entirely in favor of Vulkan + more Dx12 tests.
We’ve also automated a significant portion of our testing at this point, reducing manual workload in favor of greater focus on analytics.
Driver version 378.78 (press-ready drivers for 1080 Ti, provided by nVidia) was used for all nVidia devices. Version 17.10.1030-B8 was used for AMD (press drivers).
A separate bench is used for game performance and for thermal performance.
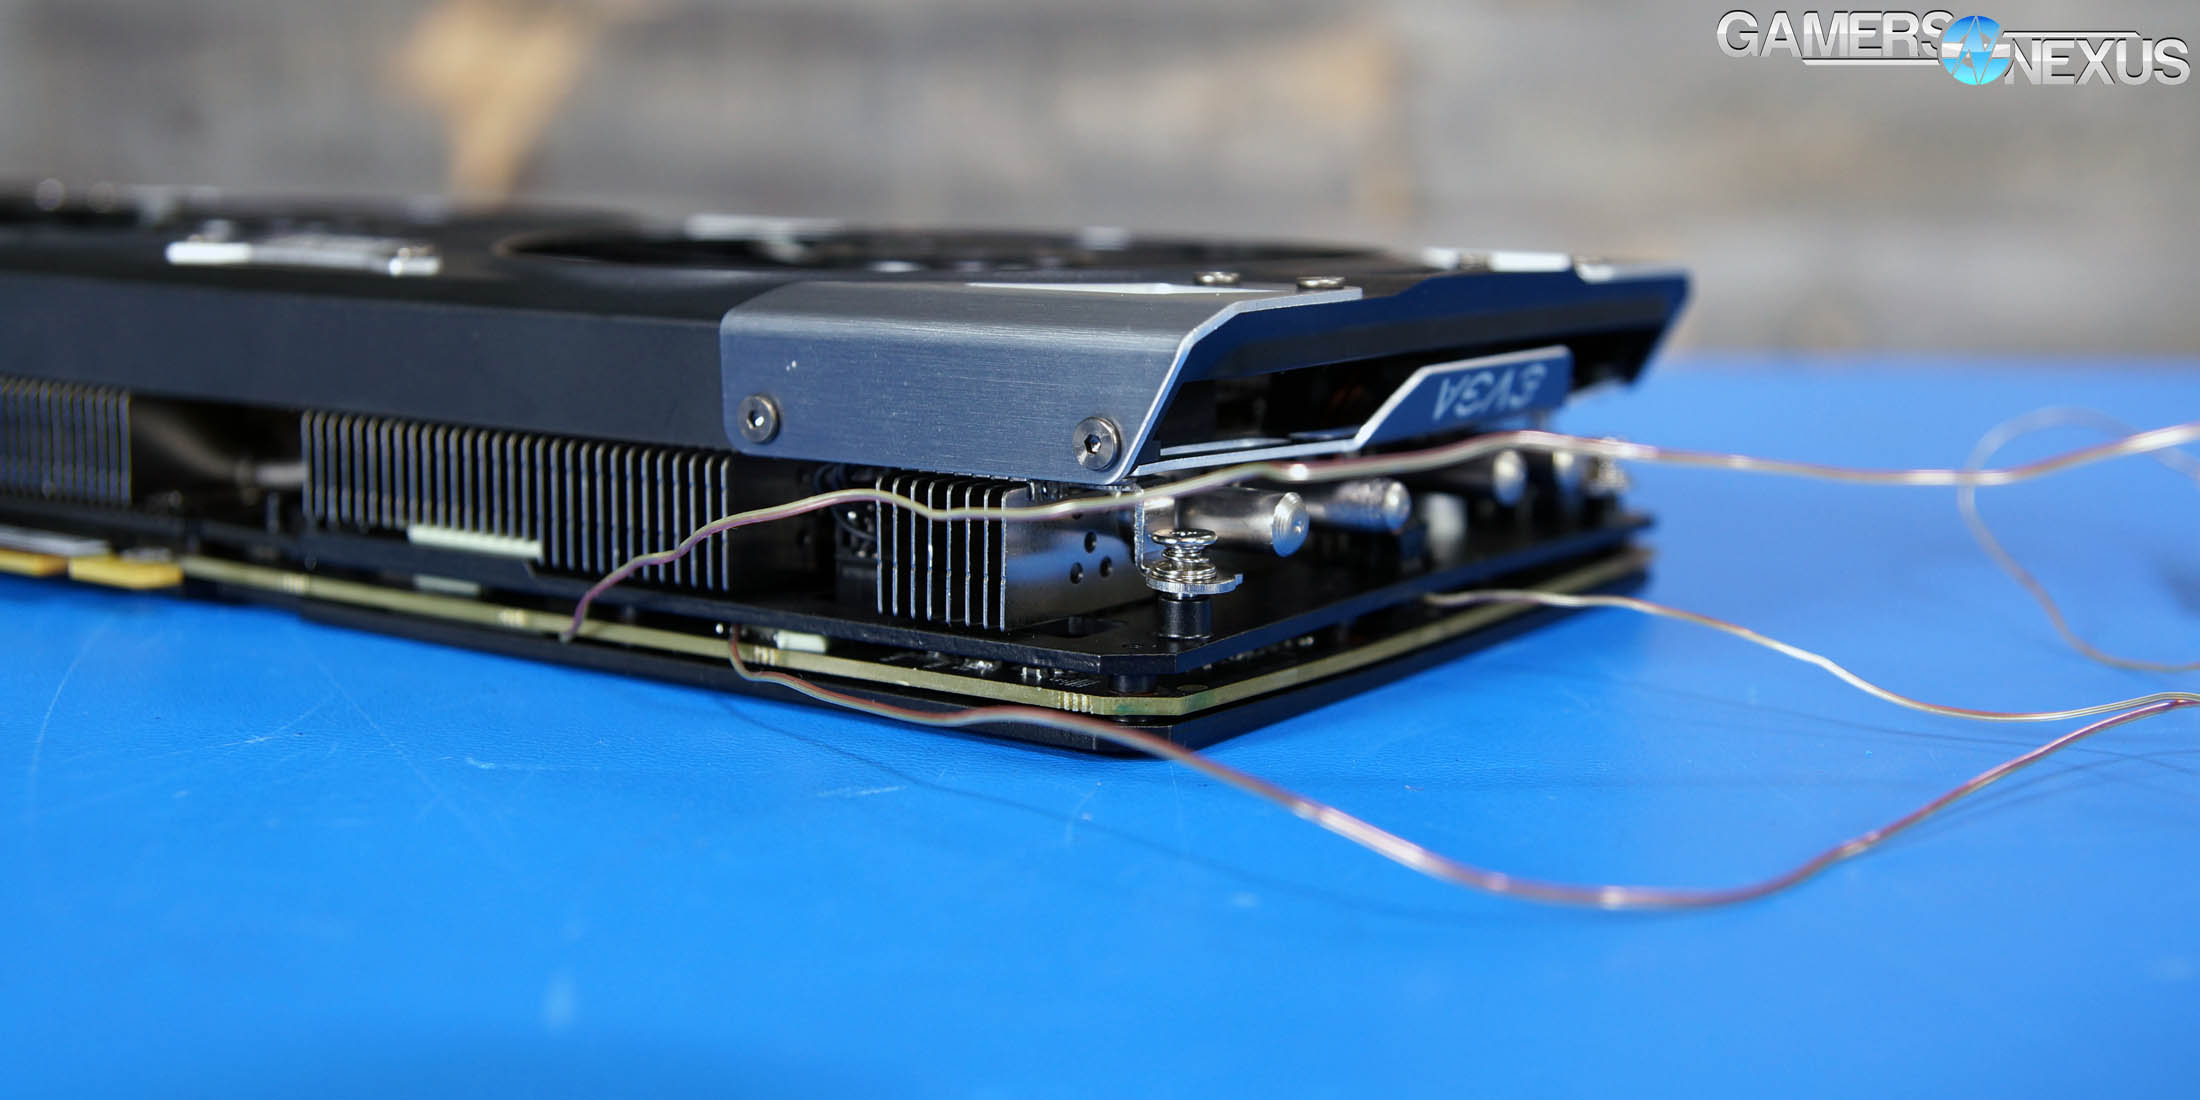
Thermal Test Bench
Our test methodology for the is largely parallel to our EVGA VRM final torture test that we published late last year. We use logging software to monitor the NTCs on EVGA’s ICX card, with our own calibrated thermocouples mounted to power components for non-ICX monitoring. Our thermocouples use an adhesive pad that is 1/100th of an inch thick, and does not interfere in any meaningful way with thermal transfer. The pad is a combination of polyimide and polymethylphenylsiloxane, and the thermocouple is a K-type hooked up to a logging meter. Calibration offsets are applied as necessary, with the exact same thermocouples used in the same spots for each test.
Torture testing used Kombustor's 'Furry Donut' testing, 3DMark, and a few games (to determine auto fan speeds under 'real' usage conditions, used later for noise level testing).
Our tests apply self-adhesive, 1/100th-inch thick (read: laser thin, does not cause "air gaps") K-type thermocouples directly to the rear-side of the PCB and to hotspot MOSFETs numbers 2 and 7 when counting from the bottom of the PCB. The thermocouples used are flat and are self-adhesive (from Omega), as recommended by thermal engineers in the industry -- including Bobby Kinstle of Corsair, whom we previously interviewed.
K-type thermocouples have a known range of approximately 2.2C. We calibrated our thermocouples by providing them an "ice bath," then providing them a boiling water bath. This provided us the information required to understand and adjust results appropriately.
Because we have concerns pertaining to thermal conductivity and impact of the thermocouple pad in its placement area, we selected the pads discussed above for uninterrupted performance of the cooler by the test equipment. Electrical conductivity is also a concern, as you don't want bare wire to cause an electrical short on the PCB. Fortunately, these thermocouples are not electrically conductive along the wire or placement pad, with the wire using a PTFE coating with a 30 AWG (~0.0100"⌀). The thermocouples are 914mm long and connect into our dual logging thermocouple readers, which then take second by second measurements of temperature. We also log ambient, and apply an ambient modifier where necessary to adjust test passes so that they are fair.
The response time of our thermocouples is 0.15s, with an accompanying resolution of 0.1C. The laminates arae fiberglass-reinforced polymer layers, with junction insulation comprised of polyimide and fiberglass. The thermocouples are rated for just under 200C, which is enough for any VRM testing (and if we go over that, something will probably blow, anyway).
To avoid EMI, we mostly guess-and-check placement of the thermocouples. EMI is caused by power plane PCBs and inductors. We were able to avoid electromagnetic interference by routing the thermocouple wiring right, toward the less populated half of the board, and then down. The cables exit the board near the PCI-e slot and avoid crossing inductors. This resulted in no observable/measurable EMI with regard to temperature readings.
We decided to deploy AIDA64 and GPU-Z to measure direct temperatures of the GPU and the CPU (becomes relevant during torture testing, when we dump the CPU radiator's heat straight into the VRM fan). In addition to this, logging of fan speeds, VID, vCore, and other aspects of power management were logged. We then use EVGA's custom Precision build to log the thermistor readings second by second, matched against and validated between our own thermocouples.
The primary test platform is detailed below:
| GN Test Bench 2015 | Name | Courtesy Of | Cost |
| Video Card | This is what we're testing | - | - |
| CPU | Intel i7-5930K CPU 3.8GHz | iBUYPOWER | $580 |
| Memory | Corsair Dominator 32GB 3200MHz | Corsair | $210 |
| Motherboard | EVGA X99 Classified | GamersNexus | $365 |
| Power Supply | NZXT 1200W HALE90 V2 | NZXT | $300 |
| SSD | OCZ ARC100 Crucial 1TB | Kingston Tech. | $130 |
| Case | Top Deck Tech Station | GamersNexus | $250 |
| CPU Cooler | Asetek 570LC | Asetek | - |
Note also that we swap test benches for the GPU thermal testing, using instead our "red" bench with three case fans -- only one is connected (directed at CPU area) -- and an elevated standoff for the 120mm fat radiator cooler from Asetek (for the CPU) with Gentle Typhoon fan at max RPM. This is elevated out of airflow pathways for the GPU, and is irrelevant to testing -- but we're detailing it for our own notes in the future.
Game Bench
| GN Test Bench 2017 | Name | Courtesy Of | Cost |
| Video Card | This is what we're testing | - | - |
| CPU | Intel i7-7700K 4.5GHz locked | GamersNexus | $330 |
| Memory | GSkill Trident Z 3200MHz C14 | Gskill | - |
| Motherboard | Gigabyte Aorus Gaming 7 Z270X | Gigabyte | $240 |
| Power Supply | NZXT 1200W HALE90 V2 | NZXT | $300 |
| SSD | Plextor M7V Crucial 1TB | GamersNexus | - |
| Case | Top Deck Tech Station | GamersNexus | $250 |
| CPU Cooler | Asetek 570LC | Asetek | - |
BIOS settings include C-states completely disabled with the CPU locked to 4.5GHz at 1.32 vCore. Memory is at XMP1.
We communicated with both AMD and nVidia about the new titles on the bench, and gave each company the opportunity to ‘vote’ for a title they’d like to see us add. We figure this will help even out some of the game biases that exist. AMD doesn’t make a big showing today, but will soon. We are testing:
- Ghost Recon: Wildlands (built-in bench, Very High; recommended by nVidia)
- Sniper Elite 4 (High, Async, Dx12; recommended by AMD)
- For Honor (Extreme, manual bench as built-in is unrealistically abusive)
- Ashes of the Singularity (GPU-focused, High, Dx12)
- DOOM (Vulkan, Ultra, 0xAA, Async)
Synthetics:
- 3DMark FireStrike
- 3DMark FireStrike Extreme
- 3DMark FireStrike Ultra
- 3DMark TimeSpy
For measurement tools, we’re using PresentMon for Dx12/Vulkan titles and FRAPS for Dx11 titles. OnPresent is the preferred output for us, which is then fed through our own script to calculate 1% low and 0.1% low metrics (defined here).
Power testing is taken at the wall. One case fan is connected, both SSDs, and the system is otherwise left in the "Game Bench" configuration.
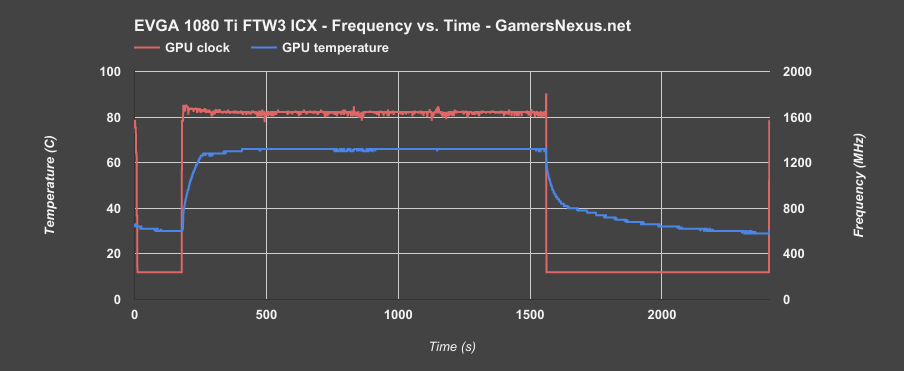
EVGA GTX 1080 Ti FTW3 Frequency Stability
The first chart is our clock versus temperature plot, which is used under a power virus scenario to draw maximum power through the card and test its clock stability. Note that this type of test does not enumerate the clock in the same way that a gaming workload would – the frequency is lower here than in games – but the power draw is significantly higher, and more load is placed on VRM components.
The FTW3 is able to leverage its cooler to maintain a stable clock, similar to what we’ve seen with most the 1080 Ti cards we’ve tested thus far. The clock has a range in fluctuations of about 50MHz when held at 66C, indicating relatively consistent frequency throughout the test. That’s what we want to see.
3 Fans vs. 2 Fans on GPU Cooler
Ramping into other thermal tests, let’s first start with a reminder: Here’s a refresher from our SC2 coverage.
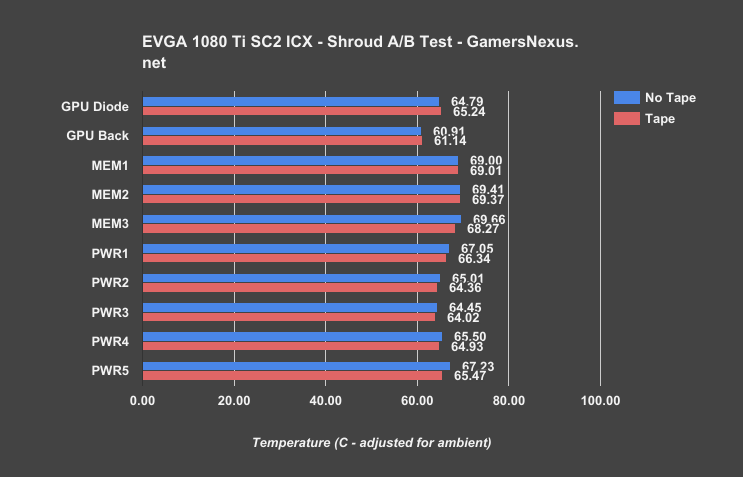
This chart shows the SC2 temperatures with and without the holes in the shroud, indicating that the holes in the faceplate of EVGA’s new design are more for looks than for functionality. The same holds with the FTW3 – they’re really just there for looks. Let’s move to a test where, just out of pure curiosity, we unplugged the third fan and ran the other two at fixed speeds.
This test was conducted with all fans at the same speed. The only difference was disabling the power fan in the second test, just because we figured the overengineering on the VRM and cooler would be enough to keep the power components within spec without that third fan.
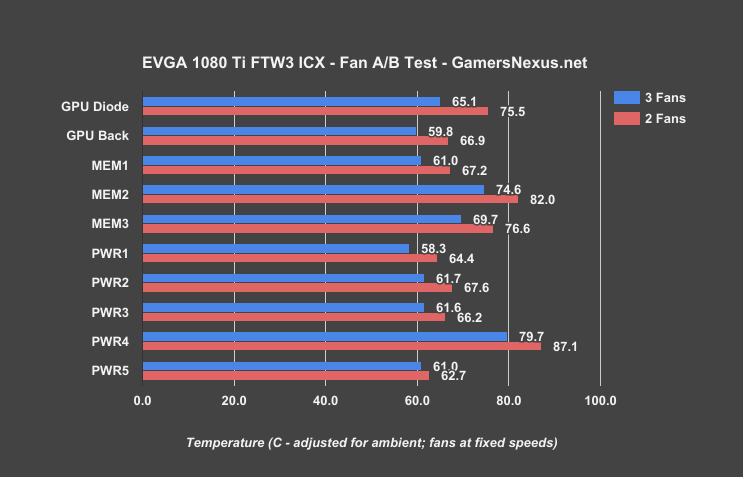
The result is mostly what you’d expect: Running two fans results in higher temperatures, obviously, but despite being somewhat expected, this data is still really interesting. We don’t normally have this level of access to temperature sensors without placing them on the boards ourselves, and we often limit that to two to three thermocouples. Because there are 9 diodes on the ICX cards, we’re able to fully understand the impact of a two-fan versus three-fan cooler across the PCB, not just on the GPU and our thermocouples.
As far as power component temperatures are concerned, it’s really not that much of a loss to move to two fans. The overbuilt VRM and heatsinks do their job to keep the VRM components within spec in our tests. Even that 87C number for PWR4 isn’t terrible for a MOSFET, considering they can withstand over 125C of heat.
What’s more interesting is that the third fan, which EVGA has positioned over those power components, seems to most heavily impact the GPU itself. GPU diode temperatures increased by roughly 10C without the third fan, despite the fact that the GPU and Memory fans – the leftmost two – are spinning at the same speed. This indicates that the heatpipes and right-side heatsink are dissipating a significant amount of heat from the GPU silicon, and that third fan is necessary to dump that heat from the fins. We can validate these numbers by looking at GPU backside temperatures, which have also risen about 6C.
The memory components really don’t seem to care either way. They are certainly benefited by the third fan, but the difference is about 6-7C, and those memory modules are rated for well over the heat they’re experiencing in both tests.
Although it’s not something you’d likely do, disabling the third fan, it is genuinely interesting information. This helps us understand how the cooler and fans work together so that we can better build fan profiles in the future.
EVGA 1080 Ti FTW3 vs. SC2 Temperatures
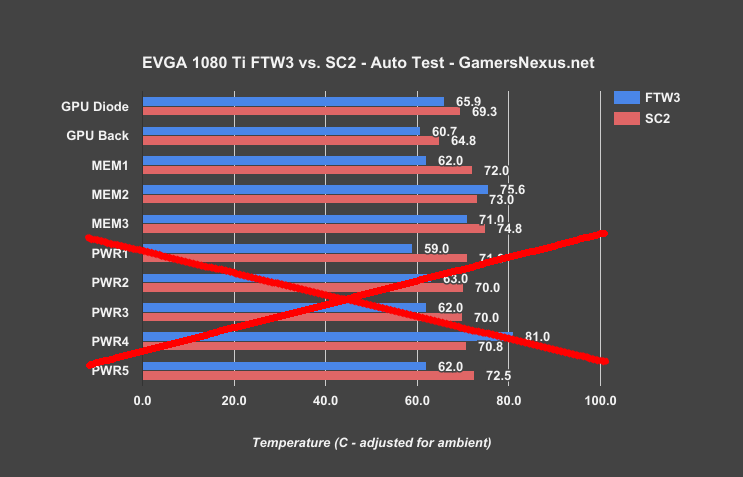
This next chart shows temperatures versus the SC2. Unfortunately, half of this chart is useless – here’s why: EVGA positions its SC2 and FTW3 thermistors in different locations on the board, which we can show here:
This means that, despite really wanting to compare the two directly, we really can’t. Power reading 4, for instance, is really warm on the FTW3 – much warmer than the SC2 – but it’s also on the back of the PCB and located behind VRAM and above the GPU backside. That’s going to be a hot location. The SC2 positions its PWR4 diode on the front-side and within the MOSFETs, so it’s measuring a completely different location on the board.
Going back to our thermals chart, you can see how this difference plays out above: PWR4 on the SC2 looks way lower, but it’s also measuring a different component. These are therefore not directly comparable, aside from the two GPU temperatures and some of the memory temperatures. Fortunately, we also position our own thermocouples on all the cards, and put those in the same spot each time. We can directly compare these.
EVGA 1080 Ti FTW3 Temperatures vs. MSI Gaming X, Gigabyte Xtreme
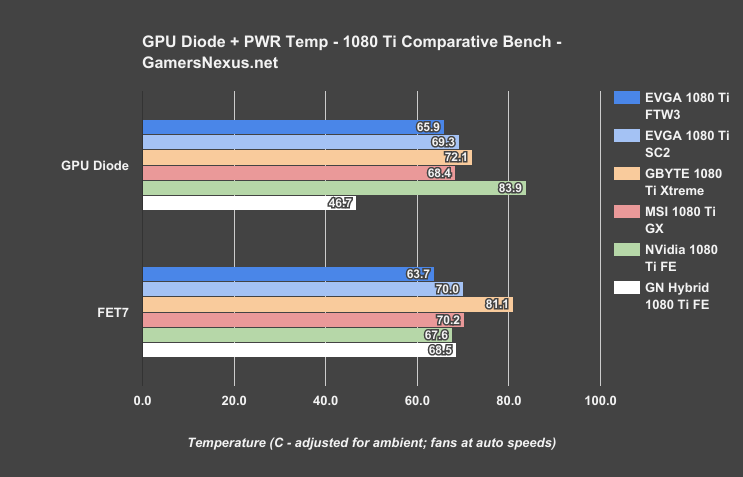
Let’s look at the FTW3 components we measured with thermocouples as opposed to the ICX NTC thermistors, then compare that against MSI Gaming X ($750), Gigabyte Xtreme Aorus ($750), and the nVidia FE card ($700).
We’re still expanding on this chart. This is brand new, and we’re excited about getting more detailed with it. VRAM is being added next, and the iteration after that will be to show component temperatures with all coolers equalized at 40dBA output.
For now, though, this is where we’re starting. With auto settings for the coolers, all cards running out-of-box, we see the EVGA 1080 Ti FTW3 ($780) keeps lower power temperatures than everyone else, meaning that they could sacrifice some cooling for lower noise. This is a common trend with EVGA, where the auto fan profile is aggressive compared to competition. At 63.7C for the power measurement on the middle FET, EVGA runs nearly 20C cooler power components than Gigabyte, who we remarked ran warm in our Xtreme Aorus review, and about 7C cooler than the Gaming X.
So far, the EVGA FTW3 is the coolest 1080 Ti that we’ve tested to-date for both GPU diode and power component temperatures. There’s another component to coolers, though, and that’s noise.
EVGA 1080 Ti FTW3 Noise vs. Gaming X, Xtreme Aorus, FE
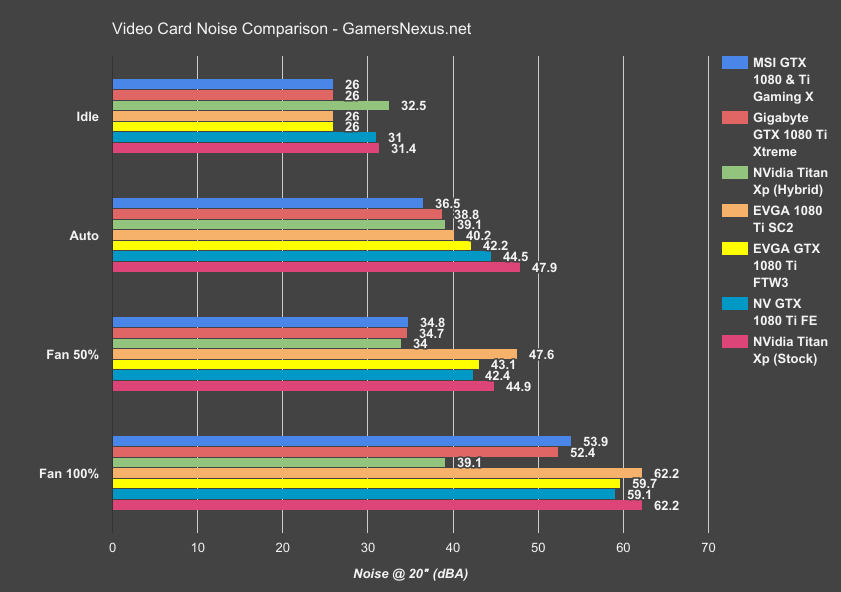
Until we add our 40dBA fixed temperature testing, let’s look at the normal noise charts.
Under idle conditions, the fans spin down to 0RPM, just like several other cards do right now. That said, we’ve noticed that the GPU fan does like to spin-up to 700RPM somewhat regularly, but you could shut that functionality down with a custom fan curve – it really has no business spinning until the GPU starts hitting 50C or higher.
Auto conditions place the EVGA FTW3 at 42.2dBA, whereas the MSI Gaming X operates at 36.5dBA and Gigabyte Xtreme Aorus is at 38.8dBA. Considering both of these cards run warmer than the FTW3, which is the coolest of the 1080 Tis we’ve tested thus far, it makes sense that the quieter cards would run a bit warmer. The really interesting test will be our fixed dBA temperature tests, which are still underway.
Regardless, for now, the EVGA FTW3 sits perceptibly louder than the Xtreme Aorus and Gaming X. The Gaming X deserves praise for its significantly lower noise levels, which are largely made possible by the fat cooler with tall height fans. EVGA’s FTW3 fans are about 90mm across, whereas the Gaming X uses 100mm fans.
Continue to the next page for gaming benchmarks & conclusion.
Again, FPS Isn’t the Point – Don’t Skip to This Page
If you skipped to this point, you’re really missing out on the only relevant part of video card tests beyond initial reviews. Thermals and noise are everything for this comparison; gaming differences between same-GPU cards are always going to be negligible, aside from buying the world’s worst PCB, maybe. It’s thermals and noise where everything counts. Check the previous page for that. Skipping to the gaming tests and ignoring all the previous benchmarks is a massive disservice to any potential buyer of these cards.
Overclocking isn’t all that exciting on the 1080 Ti cards, largely because we’re already up against voltage and frequency limitations of Pascal. The FTW3 didn’t clock that much differently from the SC2 in our tests. We ended up with roughly a +50MHz offset on the core, with memory offset by about 450MHz.
Ghost Recon: Wildlands GPU Benchmark – 1080 Ti FTW3 vs. Xtreme Aorus
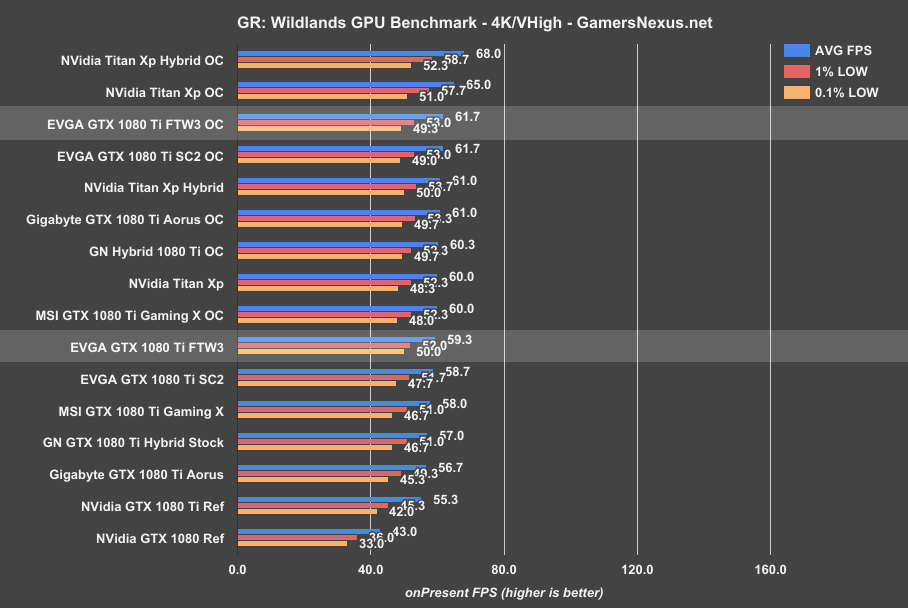
Running Ghost Recon at 4K, the 1080 Ti FTW3 is the fastest of the non-overclocked 1080 Ti cards, running an average FPS only marginally higher than the SC2. This is within test-to-test variance, so we can fairly state that the SC2 and FTW3 are functionally equal in averages. The Gaming X is next down, at 58FPS AVG, with the Xtreme Aorus at about 57FPS AVG. There is no meaningful difference between any of these cards when it comes to pure FPS, which makes sense in a world where Boost 3.0 largely equalizes cards with the same chip.
Overclocking the FTW3 isn’t particularly exciting, either, despite the PCB’s high quality. We’ll highlight those numbers anyway. Again, it doesn’t really matter how much you engineer these boards – without power mods and hard mods, you’re not going to overcome voltage and power limits established by nVidia.
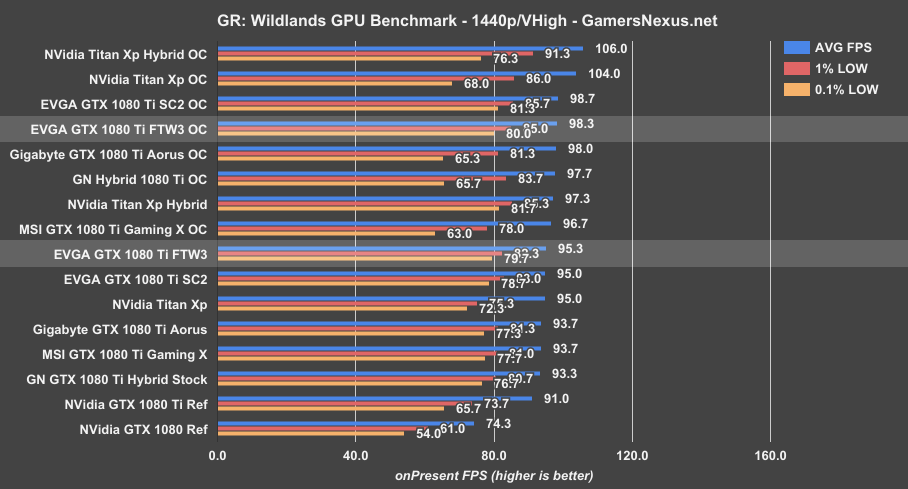
At 1440p, Ghost Recon’s performance is largely the same stack: The FTW3 runs an average of 95FPS, with 1% lows at 82 and 0.1% lows at about 80. Comparatively, the Gaming X operates at 93.7FPS AVG, the Xtreme Aorus at 93.7FPS also, and the SC2 at 95FPS AVG. Overclocking helps out marginally, once again, but we don’t quite break 100FPS.
DOOM (Vulkan) GPU Benchmark – 1080 Ti FTW3 vs. SC2, Gaming X
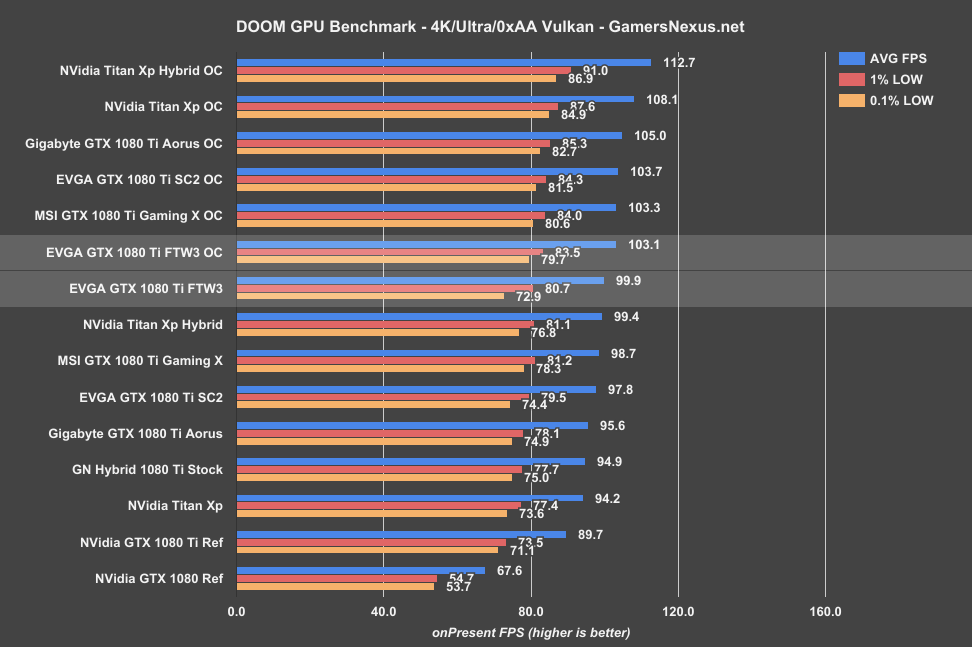
Running DOOM with Vulkan at 4K, the EVGA 1080 Ti FTW3 is once again the fastest stock card on the bench, even versus the Titan Xp, and outperforms our Gaming X by about 1.2%. That’s certainly not jaw-dropping gains and can be partially accounted for with chip-to-chip manufacturing variance, but a lead nonetheless. The FTW3 also outranks the Gigabyte Xtreme card by 4.5%, as the Xtreme Aorus is running into power limits under stock conditions.
Overclocking moves ranks around a bit, but the gains are limited overall for the 1080 Ti class cards.
Sniper Elite 4 (Dx12) GPU Benchmark – 1080 Ti FTW3 vs. SC2, Xtreme Aorus
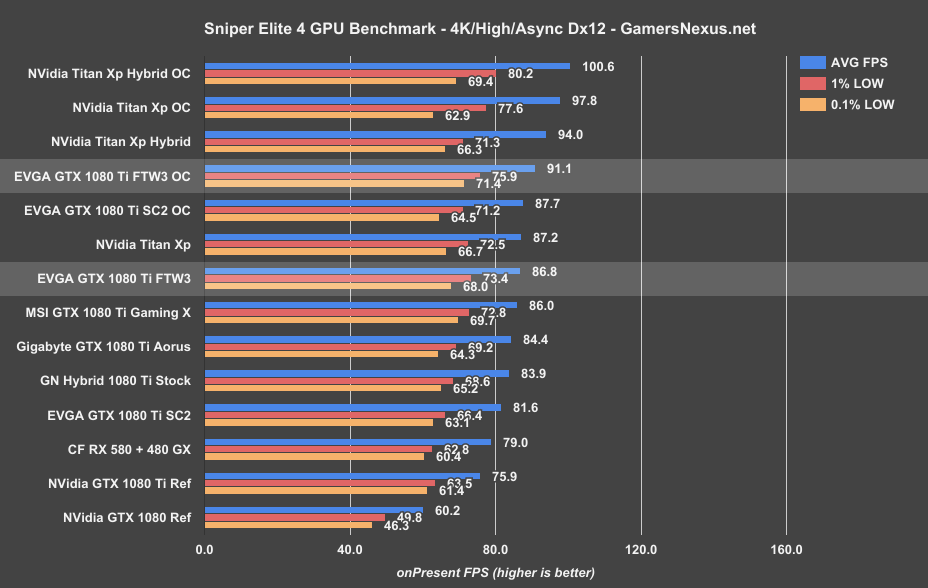
Sniper Elite 4 with Dx12 and Async compute lands the 1080 Ti FTW3 again at the top of the stock 1080 Ti listings, just barely ahead of the MSI Gaming X; in fact, these two are effectively identical, as they are within test-to-test variance. We’re two FPS ahead of the Xtreme card, or about 2.8%.
Mass Effect: Andromeda GPU Benchmark – 1080 Ti FTW3
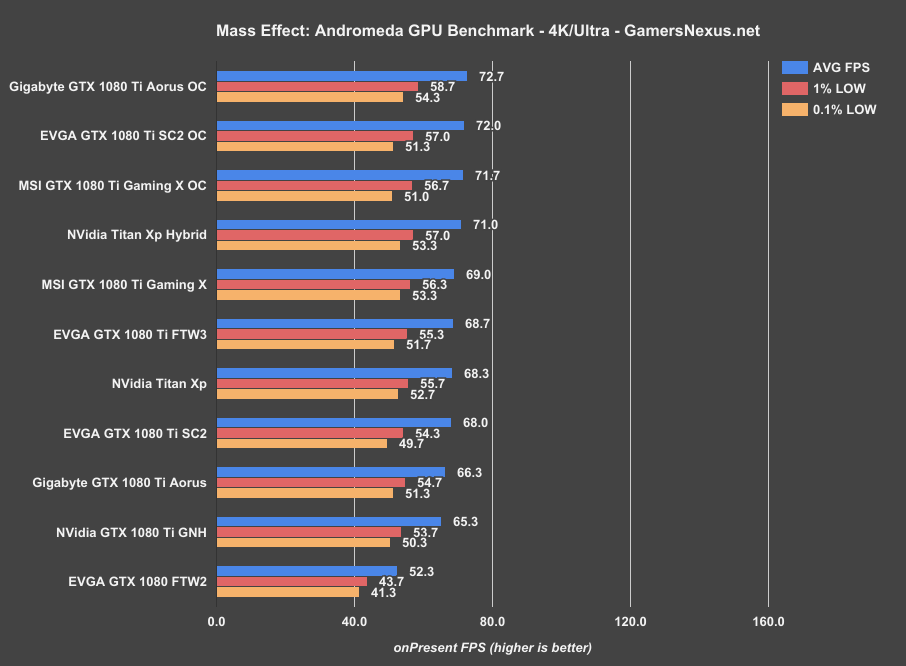
Marginal differences, once again. We’re within test variance of the Gaming X, here, meaning that the two cards are functionally identical in gaming performance. Again, it all comes down to thermals and noise, not games.
Conclusion: World-Class Engineering Limited by Pascal
Ultimately, it comes down to thermals and noise. The FTW3 runs a more aggressive fan profile, which means it’s cooler than most of its same-chip competition – but it’s also a bit louder. We would suggest, just like we did with the SC2, that you tune the fans to run at a slower speed. It’s not necessary to keep the card as cool as the FTW3 does, so some heat can be traded for lower noise.
(EVGA receives our "Quality Build" award for superb build quality on the PCB, VRM, and cooler, despite limited gains by its host architecture.)
That said, at $780, this card is a tough sell. You’re not going to be able to leverage that PCB without hard mods or shunt mods, and to no fault of EVGA. Pascal limits EVGA’s excessive engineering on the VRM and PCB – both of which can be deftly handled by the cooler – leaving us with a card which performs functionally identically to $750 alternatives. In fact, although we haven’t tested them yet, it’d also not be much different from $730 cards in the FPS department. EVGA does well in the cooling department for the form factor, does well in the VRM design, but can’t do much to help with overclocking.
Regarding thermals, this is a cool card in every respect – VRM temperatures are so far below any remotely warm temperature for a VRM that it’s laughable. But the SC2 is also good in this regard, and it’s significantly cheaper. The Gaming X is quieter and reasonable in this regard, too. An extra $30 doesn’t really get you much other than an extra fan on the FTW3, and the usefulness of that is debatable. You could get some value out of the FTW3 by tuning the fan profile so that it’s quieter overall, but it’s hard to say if there’s $30 of value there. The EVGA 1080 Ti SC2 ($750) does just as well, is $30 cheaper, and uses a PCB which is also well-engineered.
(One note: Amazon’s prices are insane, like usual; they won’t normalize until stock refreshes. Newegg should remain accurate, though.)
Editor-in-Chief: Steve Burke
Video Producer: Andrew Coleman