MSI’s GTX 1080 Ti Armor card piqued our attention for its weak stock cooler and non-reference PCB: The card, at $700, appears to be the closest we’ll get to a bare 1080 Ti PCB sale. It’s an ideal liquid cooling candidate, particularly given the overwhelmingly negative user reviews pertaining to the card’s propensity to overheat. The photos made the Armor look like a Gaming X PCB -- something we praised in our PCB & VRM electrical analysis -- but with a GTX 1070 class cooler stuck onto it. If that were the case, it’d mean the 1080 Ti Armor would perform dismally in thermals when tested with its stock cooler, but could make for a perfect H2O card.
We decided to buy one and find out why the MSI Armor had such bad user reviews, and if it’d be possible to turn the card into the best deal for a liquid-cooled 1080 Ti.
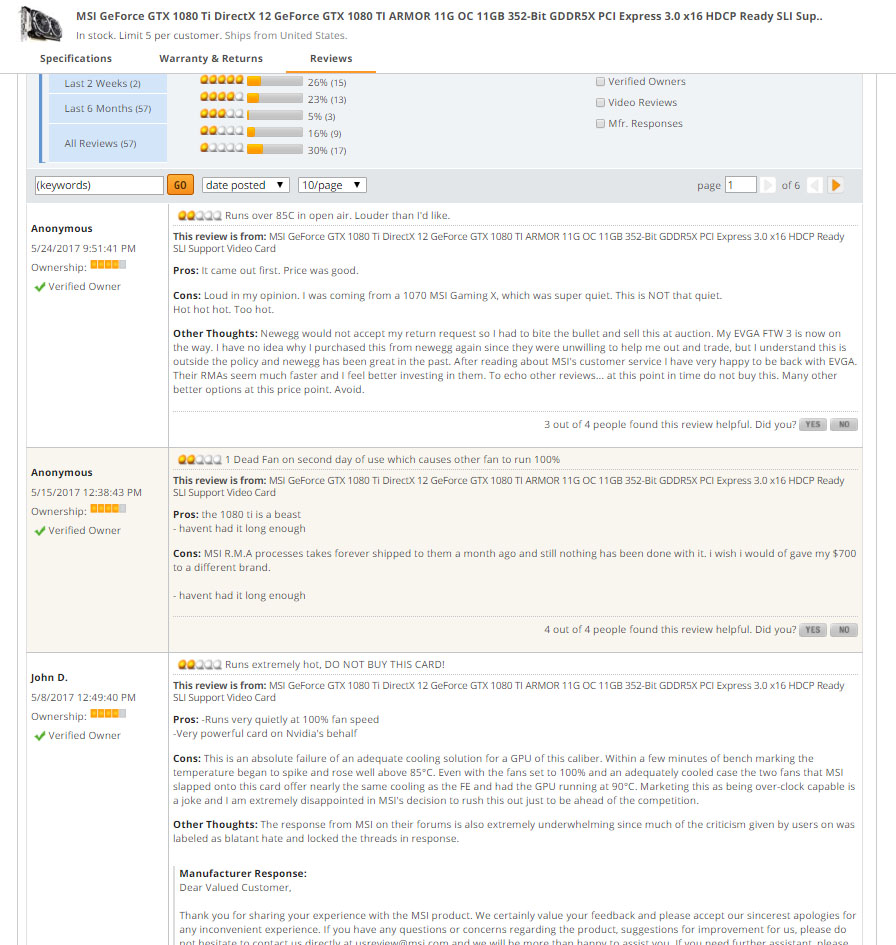
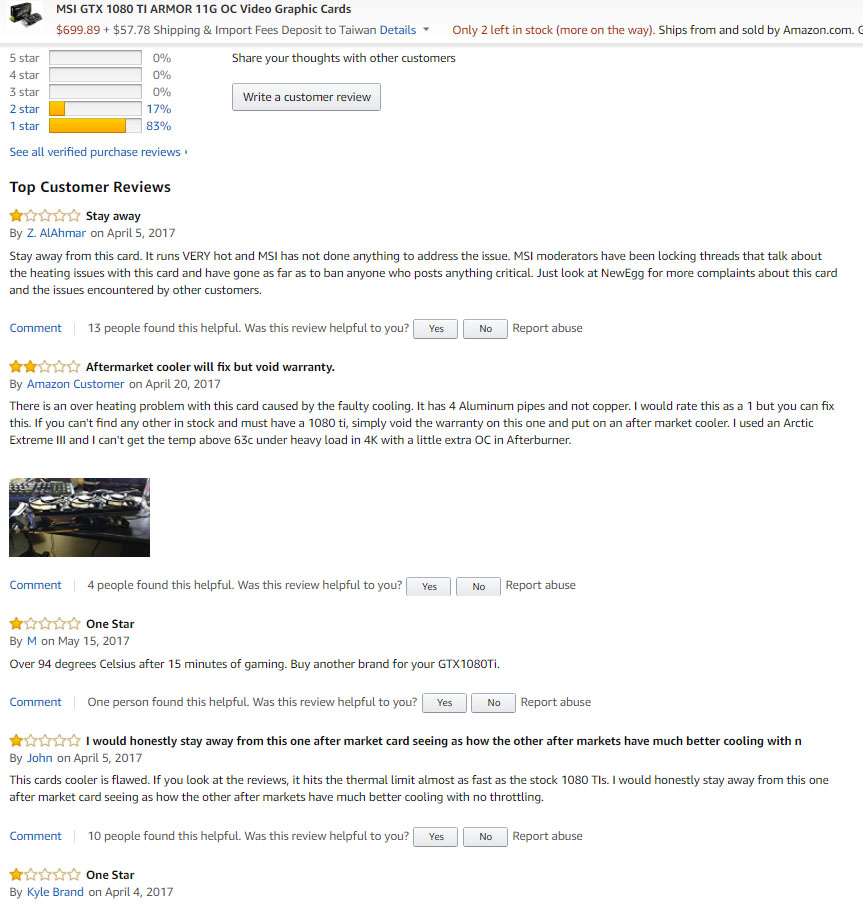
These are some of the reviews on the card’s respective product pages, where it presently holds an average 1-star review on Amazon, with 46% 1-star and 2-star reviews on Newegg. Most of the reviews complain of high temperatures and fan whine, with some references to coil whine. The temperature and noise portion of this is easy to understand:
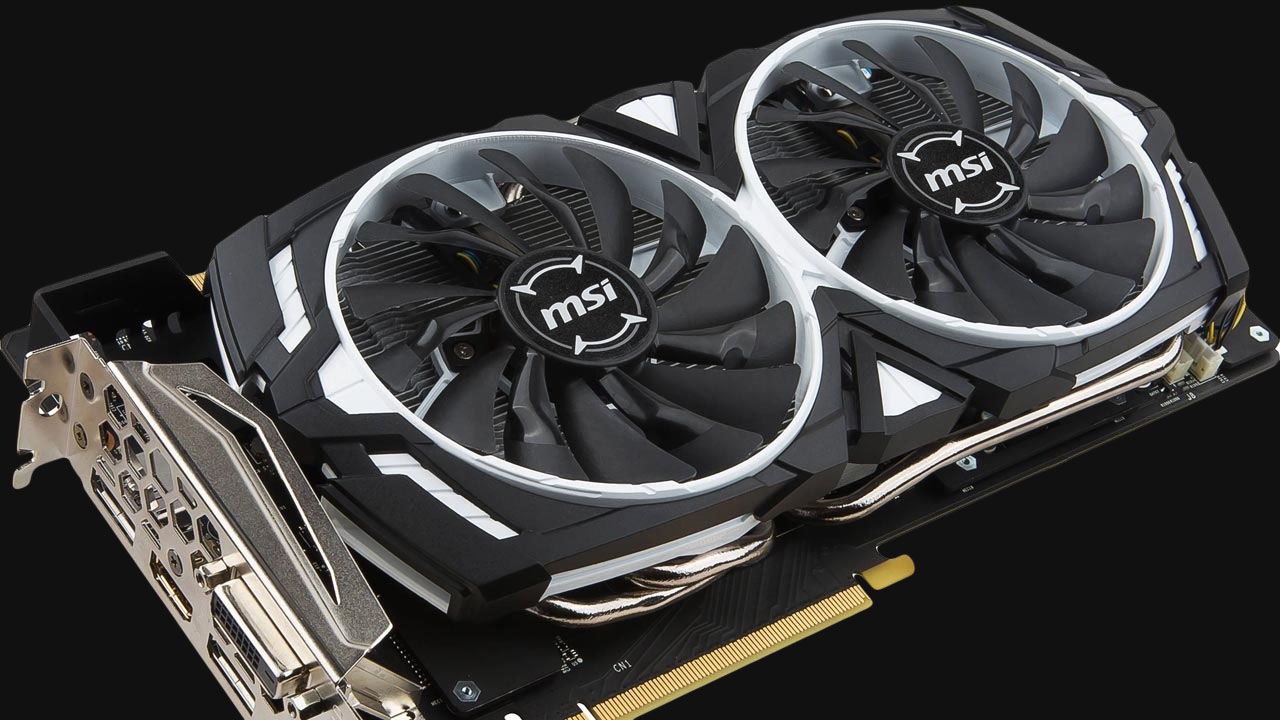
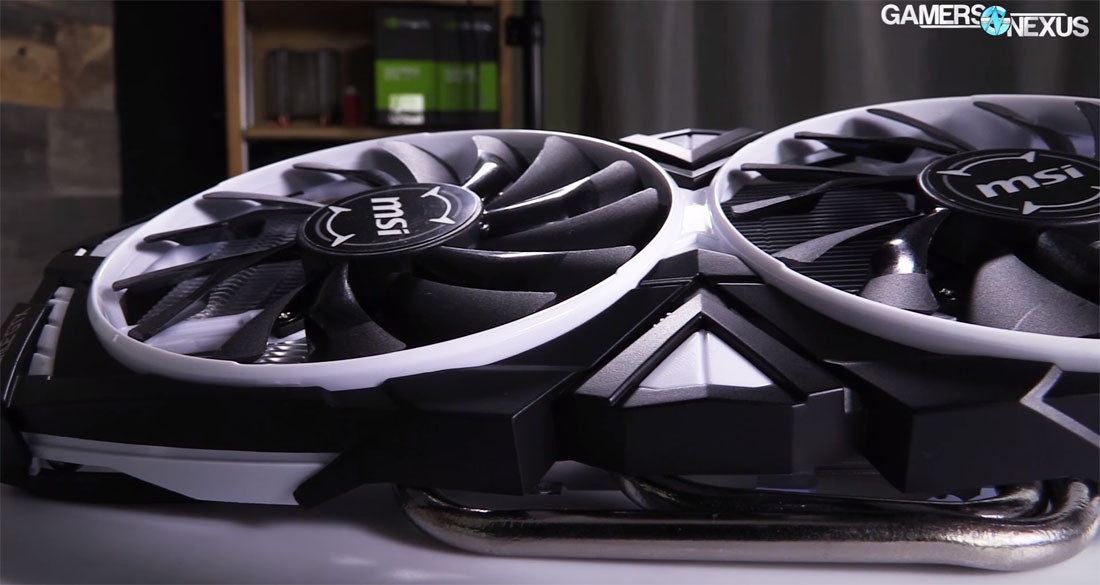
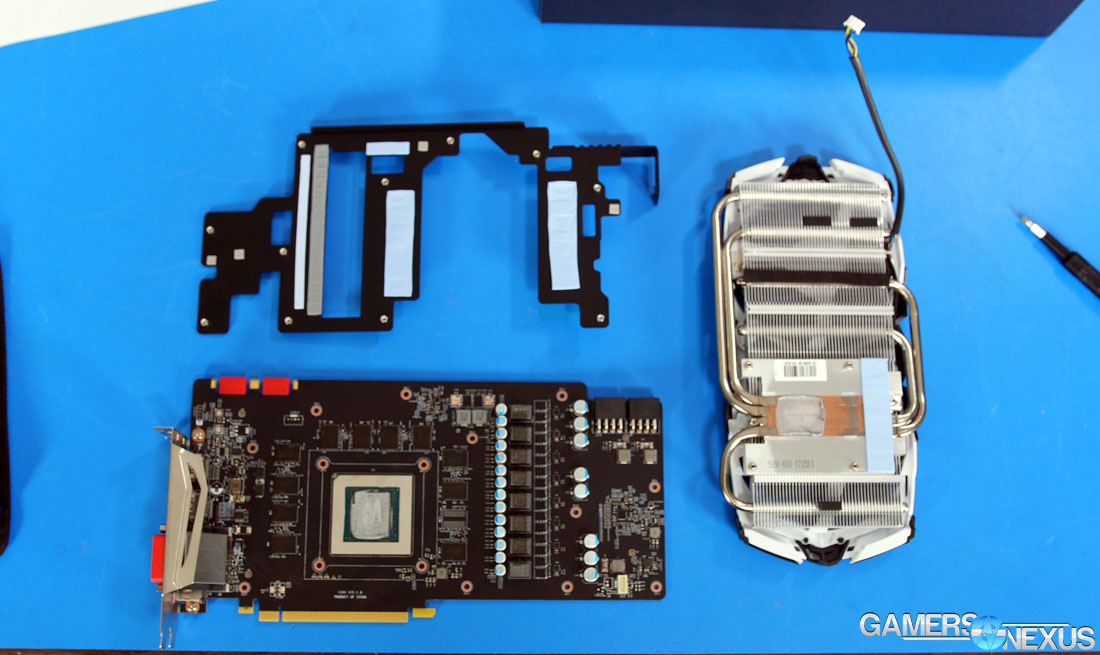
The above is a GTX 1070 Armor cooler. The 1070 cooler is not perfectly identical to the 1080 Ti Armor's cooler, but they are close -- the sizing is almost the same, making the Armor's cooler look comically small atop the oversized PCB. The 1080 Ti variant of the Armor cooler seems to have a slightly different heatpipe layout and more aggressive (read: louder) fan curve:
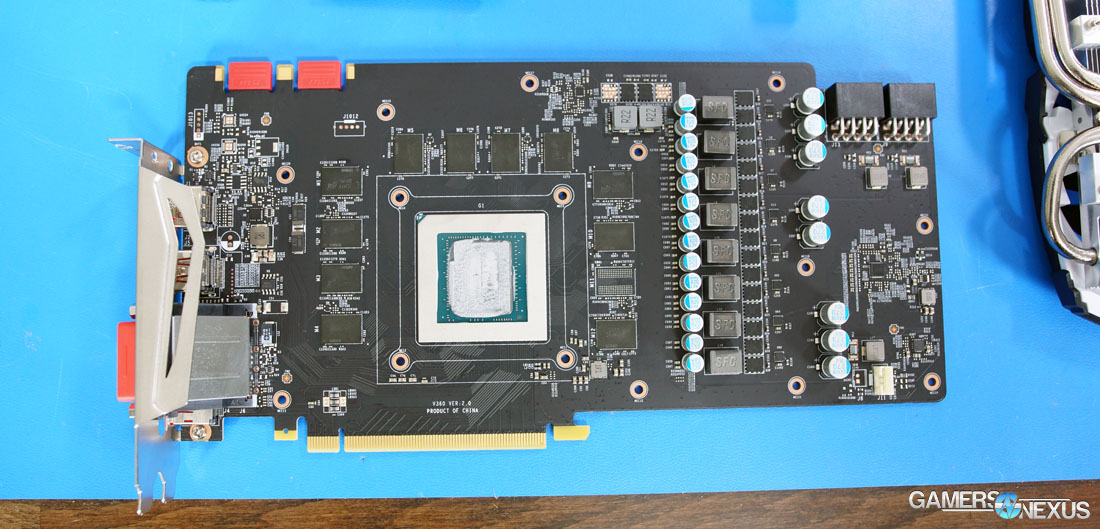
The PCB is the same as the Gaming X, though, which means that MSI is the only company using a high-quality, custom PCB in a card of this price category -- the cost was made possible by the unfit cooling solution. It’s an interesting approach, and one we’re not sure that MSI took intentionally. There are some changes to the LDO, fan control, and LEDs over the Gaming X PCB, but that’s it. The card is otherwise using the same components. Here’s a look at the 1080 Ti Gaming X PCB, for reference:
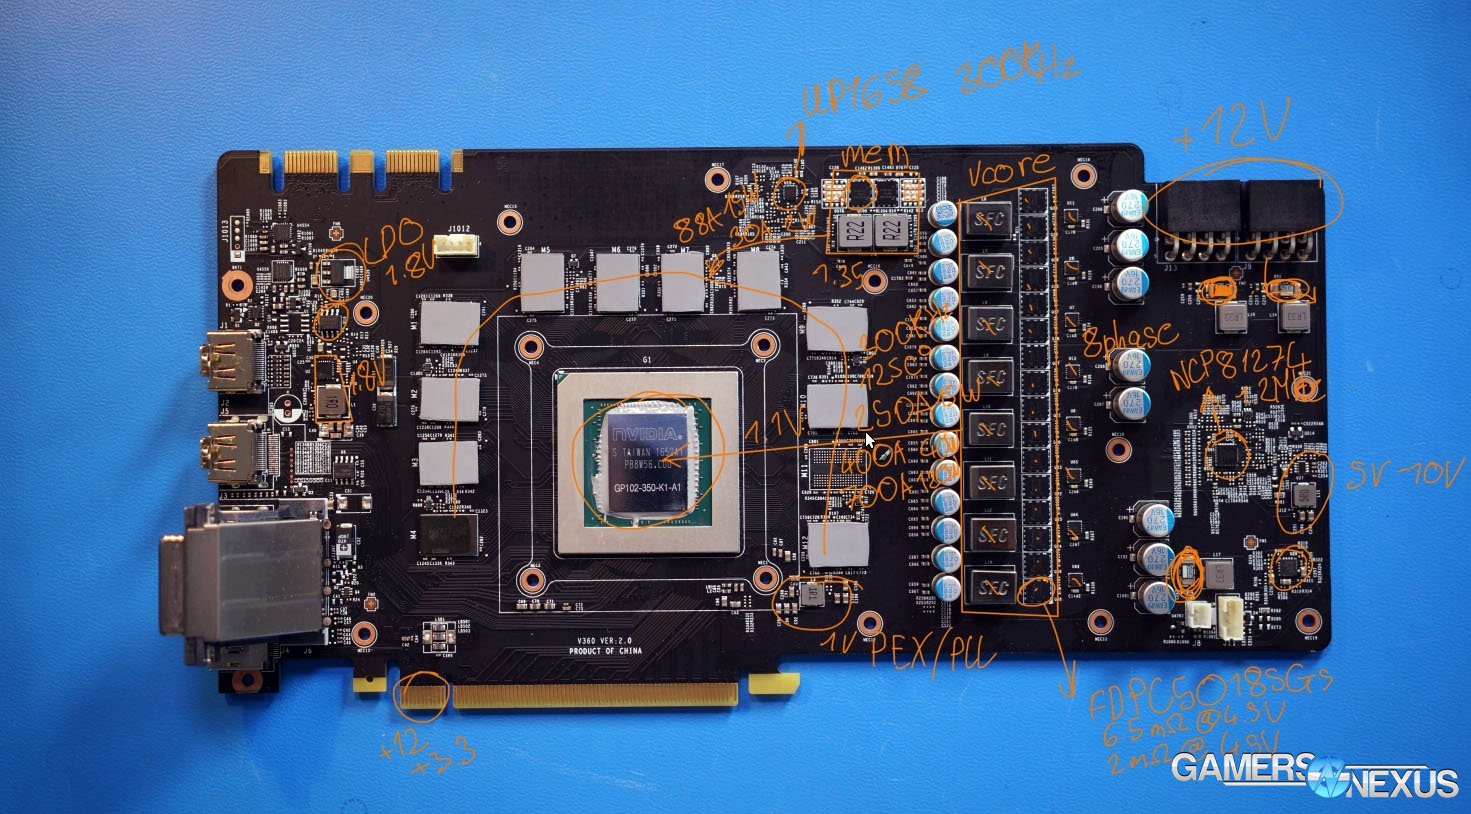
Above: Gaming X PCB analysis.
Spot the differences.
The top-left labeling for “LDO” has some changes, the fans have changes, but the rest is the same. To this end, the MSI 1080 Ti Armor is a Gaming X PCB for $50 cheaper, making it a prime liquid cooling candidate. We’ll be using the new NZXT Kraken G12 retention kit with an Asetek 570LC and EVGA Hybrid fan for our liquid cooling solution, with the next page better illustrating the impact of that hardware modification.
GPU Testing Methodology
For our benchmarks today, we’re using a fully rebuilt GPU test bench for 2017. This is our first full set of GPUs for the year, giving us an opportunity to move to an i7-7700K platform that’s clocked higher than our old GPU test bed. For all the excitement that comes with a new GPU test bench and a clean slate to work with, we also lose some information: Our old GPU tests are completely incomparable to these results due to a new set of numbers, completely new testing methodology, new game settings, and new games being tested with. DOOM, for instance, now has a new test methodology behind it. We’ve moved to Ultra graphics settings with 0xAA and async enabled, also dropping OpenGL entirely in favor of Vulkan + more Dx12 tests.
We’ve also automated a significant portion of our testing at this point, reducing manual workload in favor of greater focus on analytics.
Driver version 378.78 (press-ready drivers for 1080 Ti, provided by nVidia) was used for all nVidia devices. Version 17.10.1030-B8 was used for AMD (press drivers).
A separate bench is used for game performance and for thermal performance.
Thermal Test Bench
Our test methodology for the is largely parallel to our EVGA VRM final torture test that we published late last year. We use logging software to monitor the NTCs on EVGA’s ICX card, with our own calibrated thermocouples mounted to power components for non-ICX monitoring. Our thermocouples use an adhesive pad that is 1/100th of an inch thick, and does not interfere in any meaningful way with thermal transfer. The pad is a combination of polyimide and polymethylphenylsiloxane, and the thermocouple is a K-type hooked up to a logging meter. Calibration offsets are applied as necessary, with the exact same thermocouples used in the same spots for each test.
Torture testing used Kombustor's 'Furry Donut' testing, 3DMark, and a few games (to determine auto fan speeds under 'real' usage conditions, used later for noise level testing).
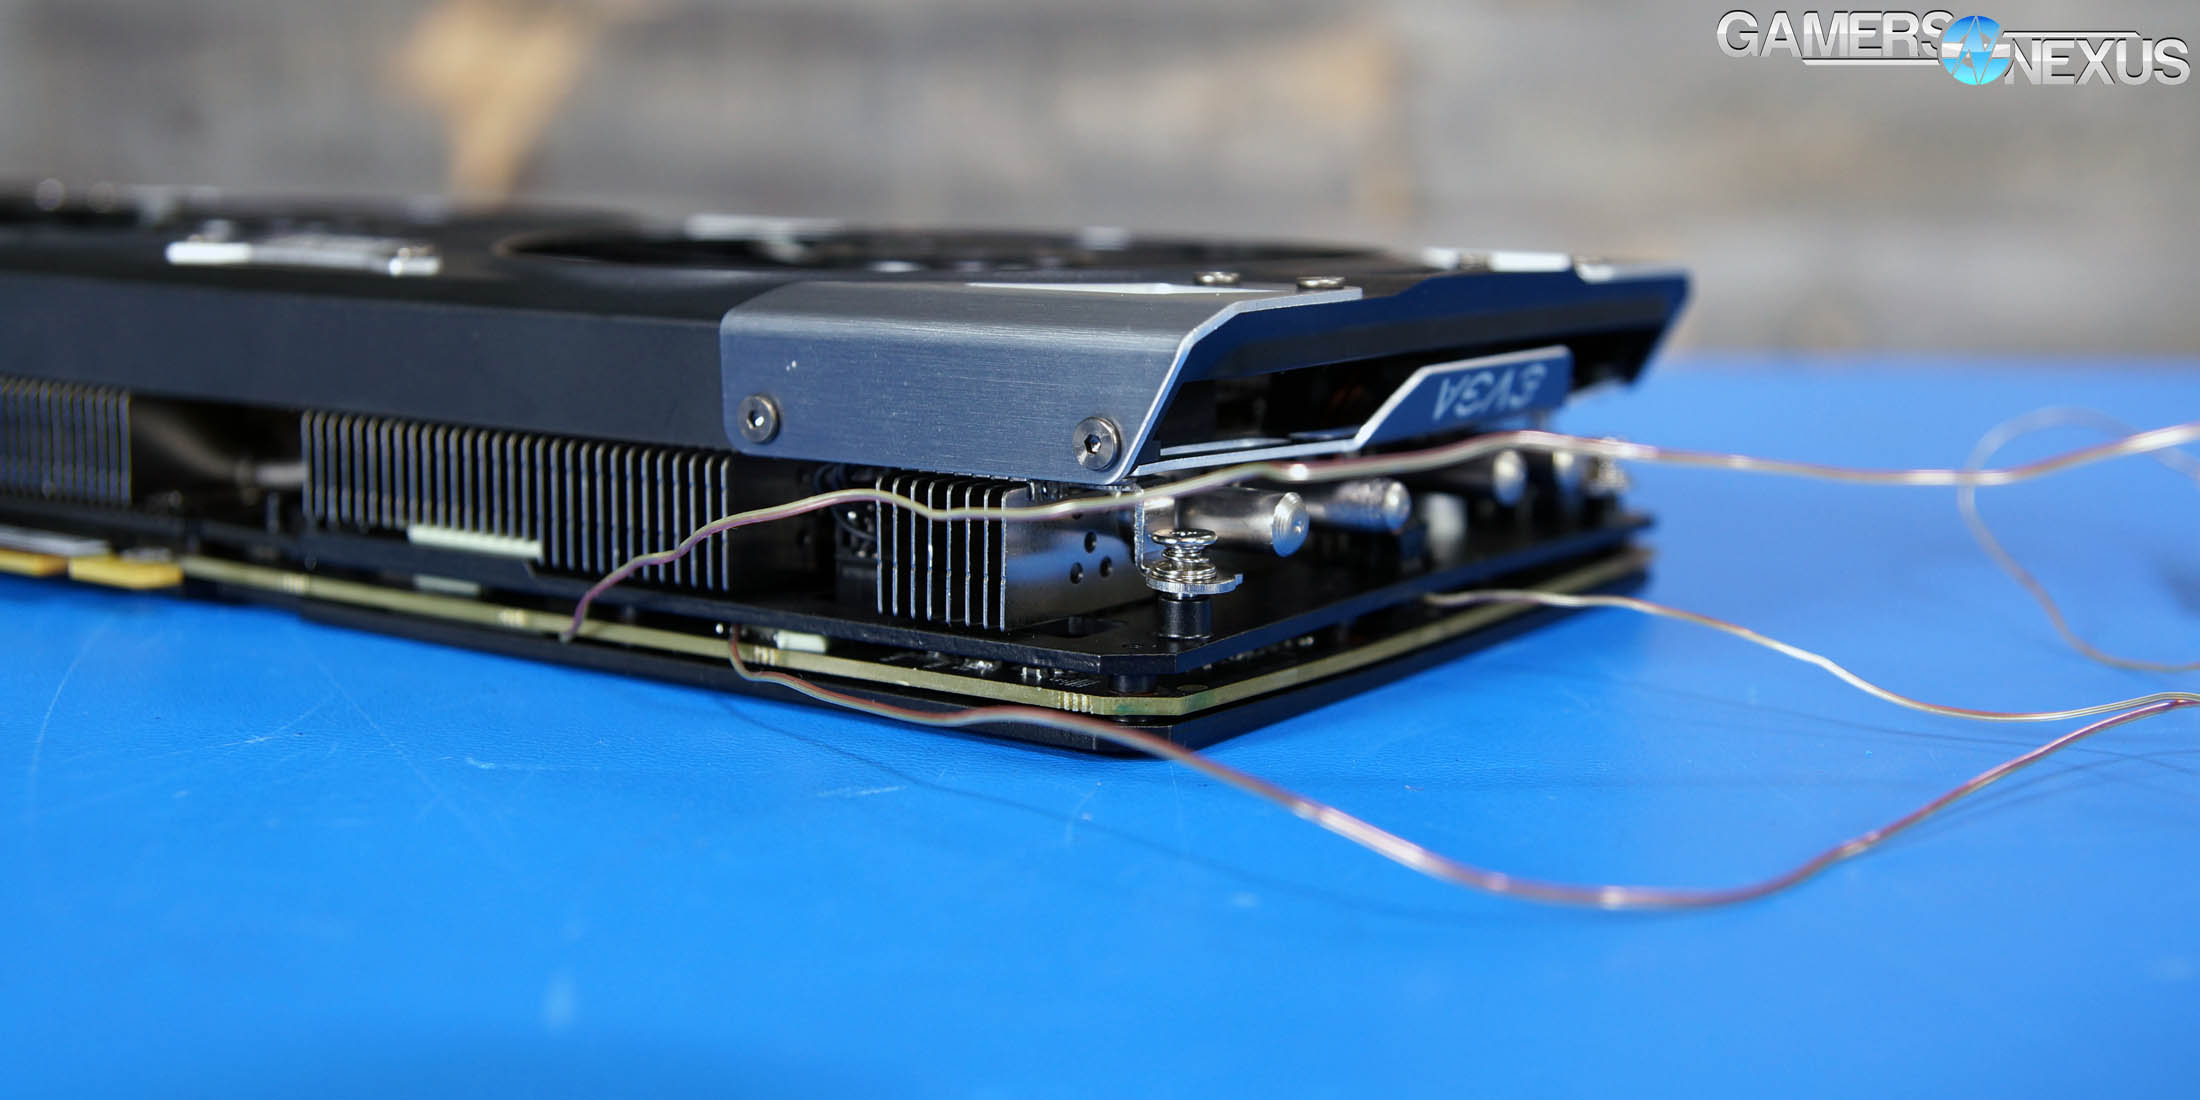
Our tests apply self-adhesive, 1/100th-inch thick (read: laser thin, does not cause "air gaps") K-type thermocouples directly to the rear-side of the PCB and to hotspot MOSFETs numbers 2 and 7 when counting from the bottom of the PCB. The thermocouples used are flat and are self-adhesive (from Omega), as recommended by thermal engineers in the industry -- including Bobby Kinstle of Corsair, whom we previously interviewed.
K-type thermocouples have a known range of approximately 2.2C. We calibrated our thermocouples by providing them an "ice bath," then providing them a boiling water bath. This provided us the information required to understand and adjust results appropriately.
Because we have concerns pertaining to thermal conductivity and impact of the thermocouple pad in its placement area, we selected the pads discussed above for uninterrupted performance of the cooler by the test equipment. Electrical conductivity is also a concern, as you don't want bare wire to cause an electrical short on the PCB. Fortunately, these thermocouples are not electrically conductive along the wire or placement pad, with the wire using a PTFE coating with a 30 AWG (~0.0100"⌀). The thermocouples are 914mm long and connect into our dual logging thermocouple readers, which then take second by second measurements of temperature. We also log ambient, and apply an ambient modifier where necessary to adjust test passes so that they are fair.
The response time of our thermocouples is 0.15s, with an accompanying resolution of 0.1C. The laminates arae fiberglass-reinforced polymer layers, with junction insulation comprised of polyimide and fiberglass. The thermocouples are rated for just under 200C, which is enough for any VRM testing (and if we go over that, something will probably blow, anyway).
To avoid EMI, we mostly guess-and-check placement of the thermocouples. EMI is caused by power plane PCBs and inductors. We were able to avoid electromagnetic interference by routing the thermocouple wiring right, toward the less populated half of the board, and then down. The cables exit the board near the PCI-e slot and avoid crossing inductors. This resulted in no observable/measurable EMI with regard to temperature readings.
We decided to deploy AIDA64 and GPU-Z to measure direct temperatures of the GPU and the CPU (becomes relevant during torture testing, when we dump the CPU radiator's heat straight into the VRM fan). In addition to this, logging of fan speeds, VID, vCore, and other aspects of power management were logged. We then use EVGA's custom Precision build to log the thermistor readings second by second, matched against and validated between our own thermocouples.
The primary test platform is detailed below:
| GN Test Bench 2015 | Name | Courtesy Of | Cost |
| Video Card | This is what we're testing | - | - |
| CPU | Intel i7-5930K CPU 3.8GHz | iBUYPOWER | $580 |
| Memory | Corsair Dominator 32GB 3200MHz | Corsair | $210 |
| Motherboard | EVGA X99 Classified | GamersNexus | $365 |
| Power Supply | NZXT 1200W HALE90 V2 | NZXT | $300 |
| SSD | OCZ ARC100 Crucial 1TB | Kingston Tech. | $130 |
| Case | Top Deck Tech Station | GamersNexus | $250 |
| CPU Cooler | Asetek 570LC | Asetek | - |
Note also that we swap test benches for the GPU thermal testing, using instead our "red" bench with three case fans -- only one is connected (directed at CPU area) -- and an elevated standoff for the 120mm fat radiator cooler from Asetek (for the CPU) with Gentle Typhoon fan at max RPM. This is elevated out of airflow pathways for the GPU, and is irrelevant to testing -- but we're detailing it for our own notes in the future.
Game Bench
| GN Test Bench 2017 | Name | Courtesy Of | Cost |
| Video Card | This is what we're testing | - | - |
| CPU | Intel i7-7700K 4.5GHz locked | GamersNexus | $330 |
| Memory | GSkill Trident Z 3200MHz C14 | Gskill | - |
| Motherboard | Gigabyte Aorus Gaming 7 Z270X | Gigabyte | $240 |
| Power Supply | NZXT 1200W HALE90 V2 | NZXT | $300 |
| SSD | Plextor M7V Crucial 1TB | GamersNexus | - |
| Case | Top Deck Tech Station | GamersNexus | $250 |
| CPU Cooler | Asetek 570LC | Asetek | - |
BIOS settings include C-states completely disabled with the CPU locked to 4.5GHz at 1.32 vCore. Memory is at XMP1.
We communicated with both AMD and nVidia about the new titles on the bench, and gave each company the opportunity to ‘vote’ for a title they’d like to see us add. We figure this will help even out some of the game biases that exist. AMD doesn’t make a big showing today, but will soon. We are testing:
- Ghost Recon: Wildlands (built-in bench, Very High; recommended by nVidia)
- Sniper Elite 4 (High, Async, Dx12; recommended by AMD)
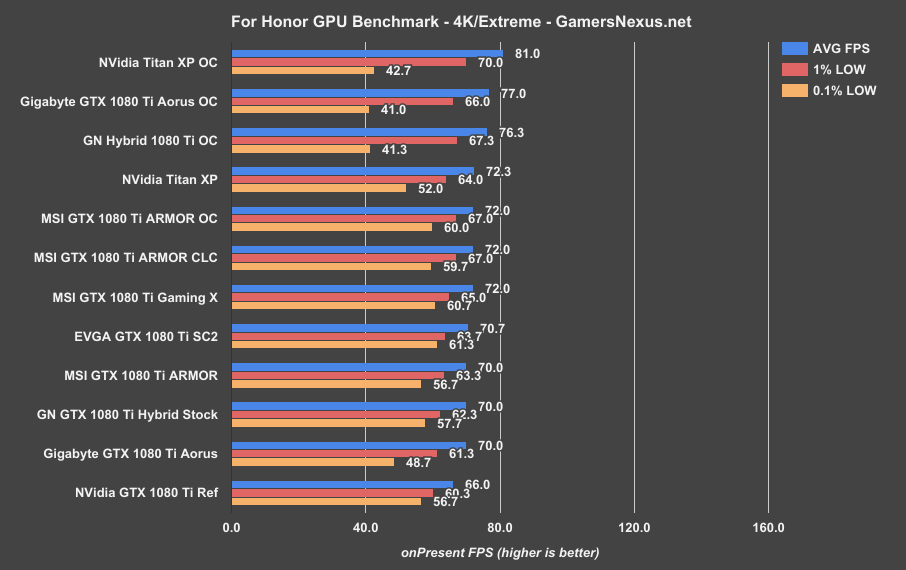
- For Honor (Extreme, manual bench as built-in is unrealistically abusive)
- Ashes of the Singularity (GPU-focused, High, Dx12)
- DOOM (Vulkan, Ultra, 0xAA, Async)
Synthetics:
- 3DMark FireStrike
- 3DMark FireStrike Extreme
- 3DMark FireStrike Ultra
- 3DMark TimeSpy
For measurement tools, we’re using PresentMon for Dx12/Vulkan titles and FRAPS for Dx11 titles. OnPresent is the preferred output for us, which is then fed through our own script to calculate 1% low and 0.1% low metrics (defined here).
Power testing is taken at the wall. One case fan is connected, both SSDs, and the system is otherwise left in the "Game Bench" configuration.
Continue to Page 2 for thermal & noise testing.
MSI 1080 Ti Armor Temperatures vs. Time - Stock
Our charts start with the stock card (air cooler) and will move to the Kraken G12-assisted H2O variant. We’ll open with thermal vs. time tests, then move to “GN EQ” charts (temperatures at steady state), then get into noise-normalized temperatures and liquid cooling.
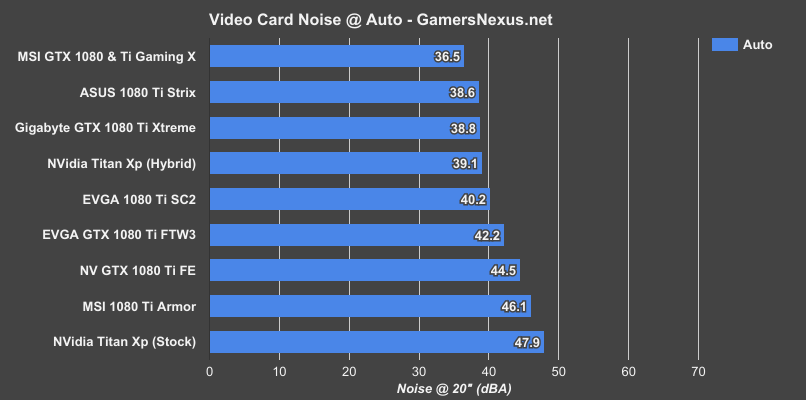
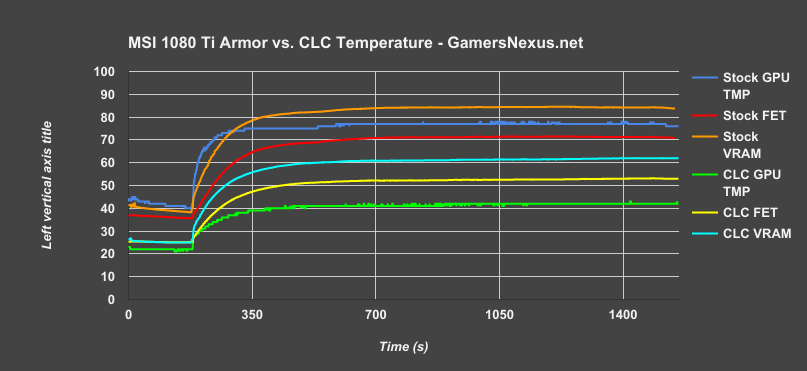
Out of box, the GTX 1080 Ti Armor operates a GPU temperature of around 77-78C when left to its own devices. This is in our torture workload, and triggers the fan into an 80% speed. This 80% fan speed is the max that we found for the 1080 Ti Armor; its curve seems to try to reduce the instances of >80% duty cycles on the fan. With its 80% duty cycle -- the most common speed when under any kind of gaming load (and achieved within moments) -- the Armor outputs approximately 46dBA of noise. At this noise level, the card manages to be one of the worst performers on our charts in both noise and thermals. This is thanks to the low-spec heatsink that’s stuck on a relatively high TDP component.
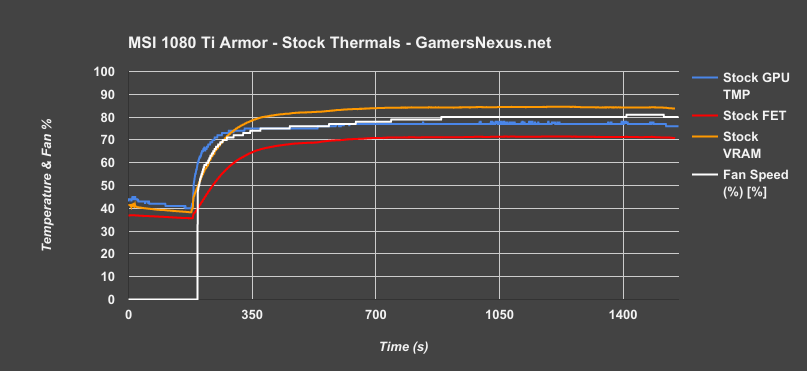
As for measurements on other components, the VRAM module measured -- located between the GPU and the inductors -- is nearing 90C under these workloads. In a higher ambient environment, like the inside of a case, an additional 10C would not be unheard of. That starts pushing VRAM component temperatures fairly high. Power component temperatures are closer to where the Gaming X PWR component temps sit when measuring the same MOSFET: roughly 71.2C here, which is within reasonable variance and well within any operating spec for a MOSFET.
Steady State Thermals - GPU
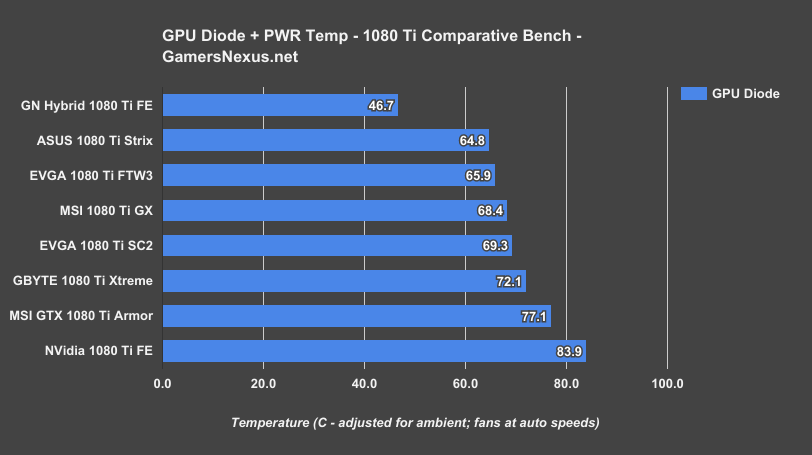
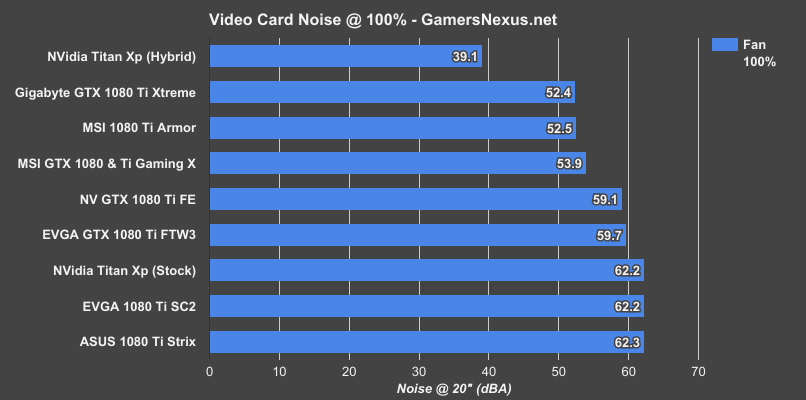
MSI’s Armor cooler is the worst of the AIB partner models that we’ve tested thus far, and also the cheapest. The GPU diode reports a 77C average in this workload, comparatively close to the Founders Edition card at 84C (which is limiting the clock as a result). That said, the FE card has more fan headroom to resolve its thermal issues; the Armor does not. At 77C, the noise output is about 46dBA from the Armor card, whereas the FE card runs a 45dBA noise output with its auto configuration and 84C reported temperature.
In the very least, these numbers show that just buying any AIB partner model isn’t magically going to be better than reference. The king of cooling efficiency versus noise, at least in our testing thus far, still appears to be the ASUS Strix 1080 Ti -- but it’s also $780. This card gives us some perspective: the Strix maintains its 65C temperature with a noise output of around 38.6dBA, which is perceived by human ears as nearly a 2x reduction in noise output vs. the Armor (accompanied by a 12C reduction in GPU temperature).
If we look to a more reasonably priced card, the EVGA 1080 Ti SC Black Edition (non-ICX card) would perform effectively equally to the SC2 ICX card that we have here, just with synchronous fan RPMs. The SC2 runs around 69C load, matched against a 42dBA noise output -- another non-trivial reduction over the Armor.
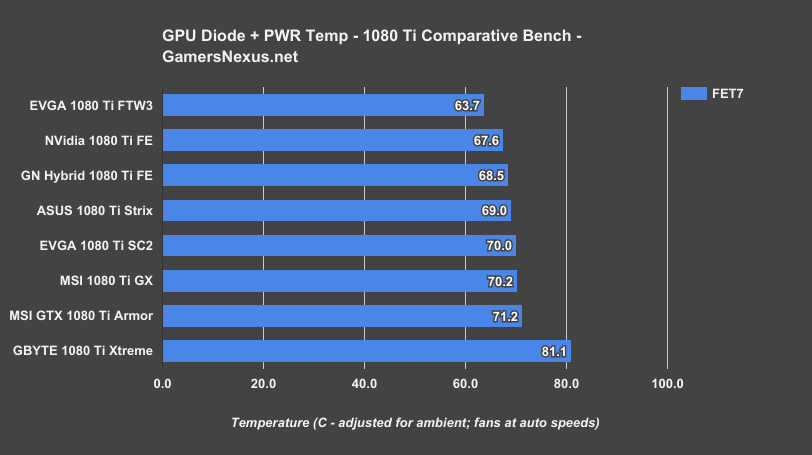
The MSI Armor does OK in power temperatures and lands around where the rest of the pack lands -- though again, the components used are different on each card. This is similar to the Gaming X, as previously stated.
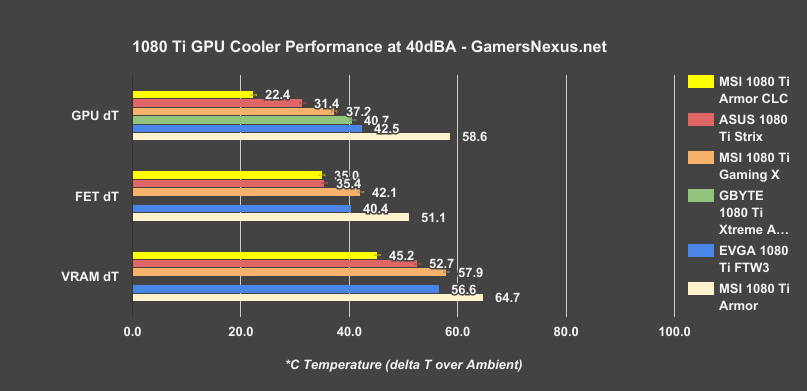
Performance at 40dBA
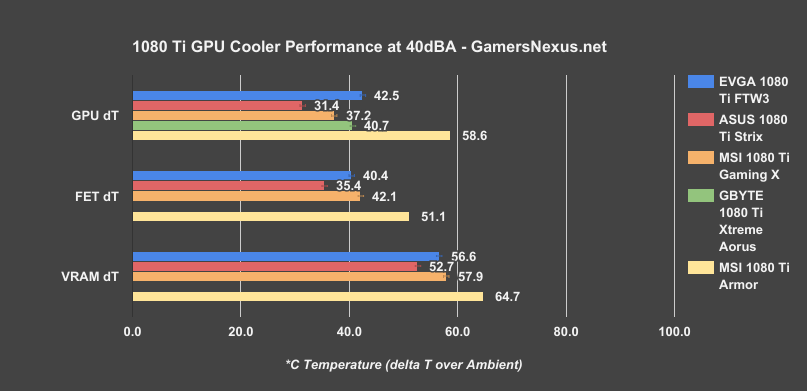
We’re measuring in Delta T over ambient now, so keep that in mind for the above chart. Testing is done with the cards configured to a 40dBA output, then tested to see where the temperatures land. We do not yet normalize for power, but do normalize for noise.
The Armor card sits at a GPU temperature of about 58.6C delta T over ambient, which is the hottest device by a longshot. The next hottest card measured (FE not yet present) at this fixed dBA is the FTW3, still running 16C cooler than the Armor for GPU temperature when at the same noise level. We also see the card 11C lower in power component temperatures, with an 8C reduction in VRAM temperature when measuring the same module placed near power components.
MSI Armor Noise Levels
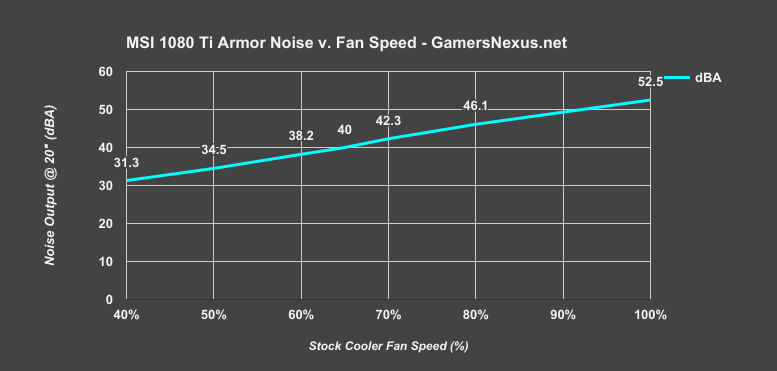
The above plot shows noise levels at different fan speeds with the stock cooler, establishing a fairly linear trend.
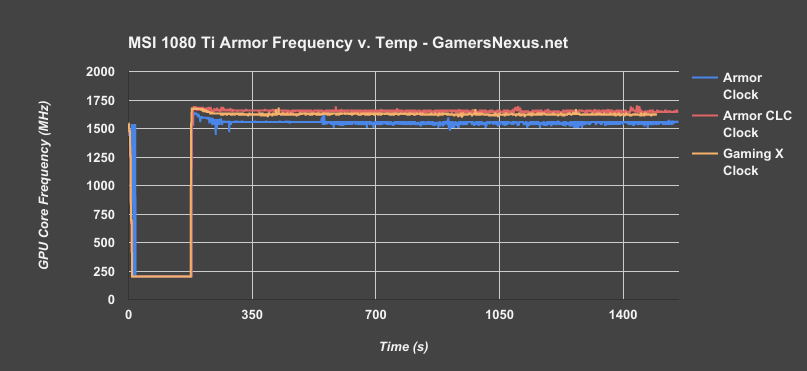
MSI 1080 Ti Armor Frequency vs. Time
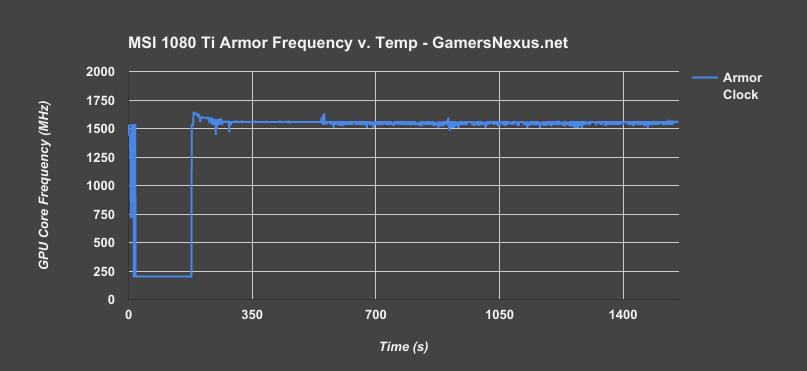
This chart is produced using the higher auto fan speeds (~80%), showing that the MSI 1080 Ti Armor falls hard as temperature ramps. The frequency falls from ~1630MHz to ~1520MHz within the first two minutes of the test (including gaming workloads). Keep in mind that this is a power virus, so clock is not enumerated as a game would demand -- but we’ve got Superposition benchmarks to illustrate those numbers.
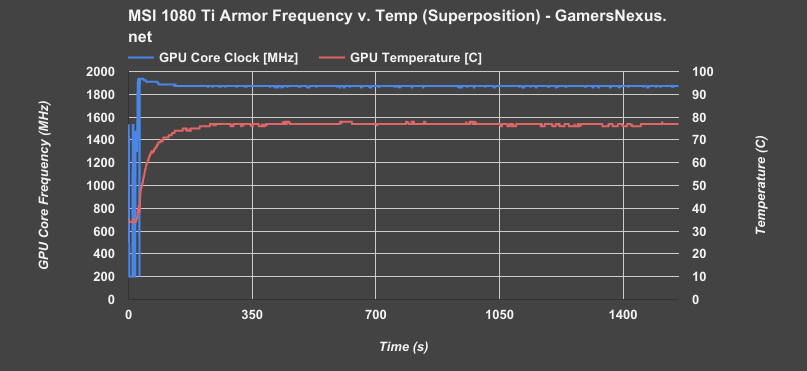
The same thing here, really. We’re immediately dropping clocks and framerate as a result of the rising, unchecked temperature.
| AVG FPS | 1% LOW | 0.1% LOW | |
| First pass | 73 | 54 | 52 |
| Second pass | 72 | 52 | 50 |
| Third pass | 72 | 52 | 50 |
| Fourth pass | 71 | 52 | 50 |
| Fifth pass | 71 | 52 | 49 |
| Sixth pass | 71 | 52 | 48 |
| Seventh pass | 71 | 52 | 48 |
| Eighth pass | 71 | 51 | 48 |
Here’s a framerate reduction over time table. This shows eight loops of Metro: Last Light tests, illustrating performance degradation over time resultant of thermals. The loss is not great enough to complain about in real time, but it is an unnecessary reduction in performance. A better cooler would completely absolve the card of these issues. The Gaming X does not experience the same degradation at the same rate.
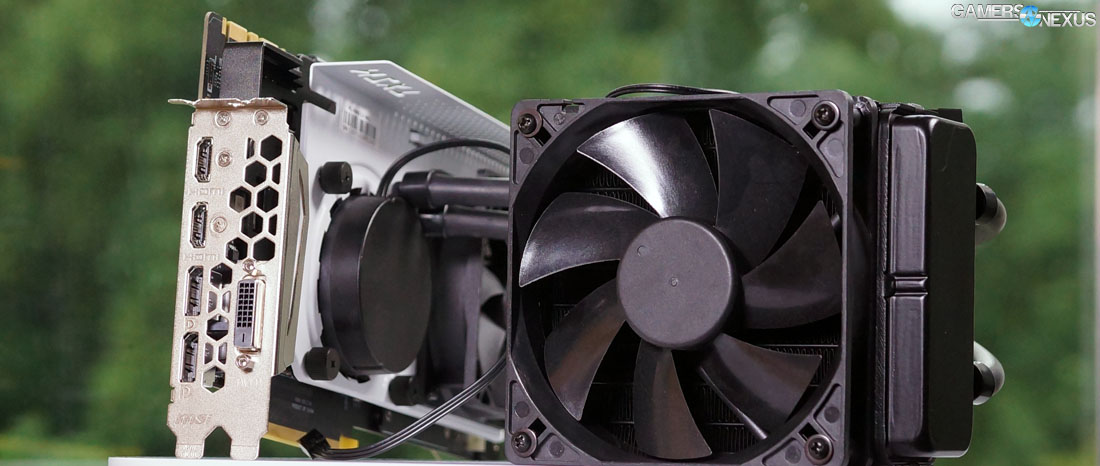
Hybrid Mod of 1080 Ti Armor ft. Kraken G12
Sticking an NZXT Kraken G12 cooler onto the MSI 1080 Ti Armor will allow us to keep VRM cooling while replacing the GPU cooling with a CLC (Asetek 570LC, using an EVGA Hybrid fan for the radiator cooling).
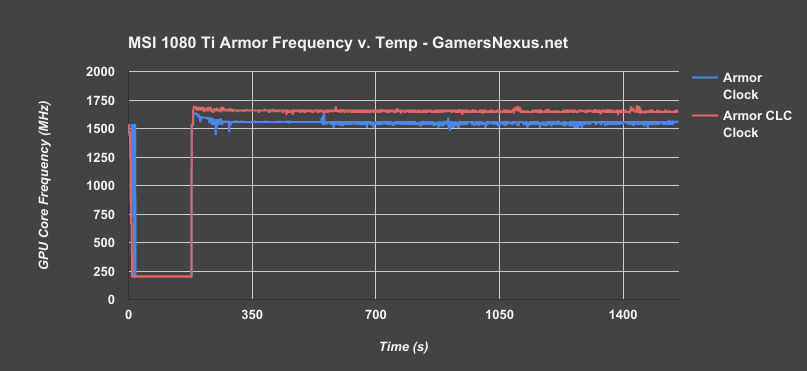
This chart shows nearly a perfectly flat line for the frequency, which is what we want. This means that we’ve got less clock fluctuation, aiding in framerate and frametime delivery, and we’ve improved overall framerate. This is comparable performance to the Gaming X card, which uses the same PCB and a strong-performing Twin Frozr cooler:
The fact that the Gaming X aligns so closely with the liquid-cooled version of the 1080 Ti Armor tells us that, yes, the Armor really is a Gaming X with a cheaper cooler. That makes it a good solution for liquid cooling.
MSI 1080 Ti Armor Temperatures - Air vs. Liquid
This chart provides a look at component-level temperatures after our liquid cooling mod, showing a reduction in VRAM, MOSFET, and GPU readings that make for a much better card.
MSI 1080 Ti Armor at 40dBA - Air vs. Liquid
A revisit of the 40dBA normalized noise chart, where we now see the CLC version of the Armor chart-topping. This was with a ~65% radiator fan speed and 900RPM VRM fan speed.
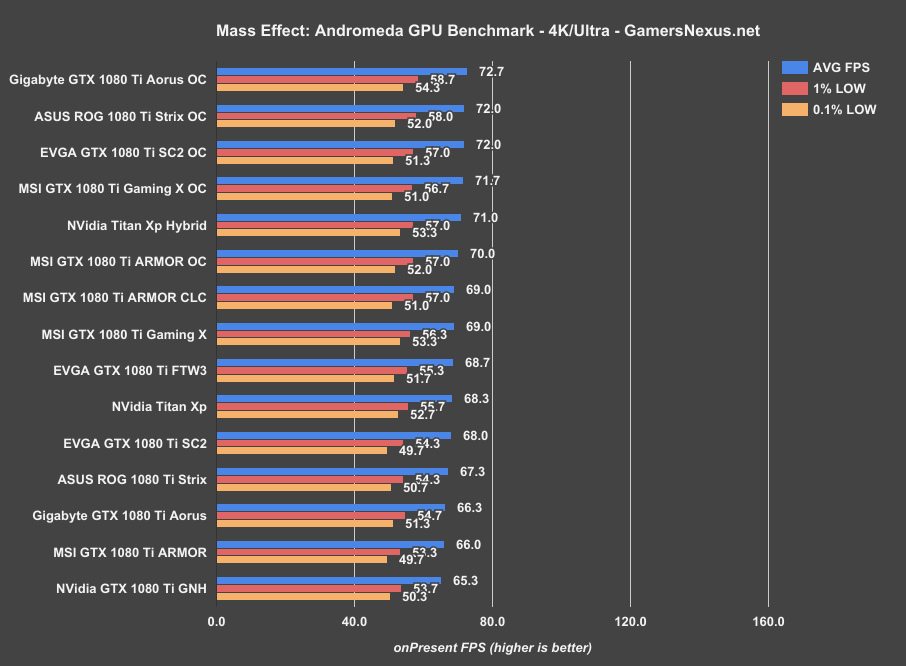
Some FPS Numbers
FPS isn’t the biggest deal with AIB partner models of the same card, as we’ve demonstrated before, particularly considering that GPU silicon quality can vary so much from card-to-card. That said, we can see some differences under adverse thermal scenarios, as demonstrated clearly in our 1080 Ti FE Hybrid mod results.
Here's the problem with the above charts: We don't get the full picture with a thermally challenged card. To truly see performance, we'd have to account for the fact that there's framerate degradation as the gaming session drags on -- you'll see a slight reduction in FPS over gaming sessions that last long enough to drive up the temperatures. As the fans start screaming to keep pace, there's also the noise concern, hence the huge focus on noise and temperature charts above.
Even with the thermal deficit, our framerate is somewhat comparable to most the other 1080 Ti cards -- as you’d expect, really. The biggest difference is that of noise and of efficiently dissipating heat, two things the Armor is not particularly competent with. That said, as a bare PCB, the Armor offers itself as what is effectively a Gaming X for $50 off. That discount makes the Armor an excellent candidate for liquid cooling or hard modding, as you get a good, custom PCB with a disposable cooler.
Out of the box, we wouldn’t recommend using the Armor cooler -- it’s really meant for a 1070, not a 1080 Ti, and that shows. Sticking the Armor into a case with higher ambient temperatures (it is not unreasonable for case ambient to be +10C over room temp) would further threaten performance and cause clock drops. The Armor is also limited in cooling potential -- it’s already at 80% for most of our numbers, leaving little room left to improve. If air cooling is your preference, it’s best to buy something else. An extra $20 for an SC2 Black Edition would be well worth it, though there are alternatives at $700 that can also work.
As a bare PCB for CLCs, though, the Armor is a good card. We’re just not sure if that was its intention. This is a good solution for folks intending to go with liquid, either through hybrid mods or with compatible water blocks. The air cooler will suffer when thrown into cases with a medium to high internal ambient temperature, and it is not unreasonable to see +10C internal case ambient given the right mix of components (or wrong mix, really). In these instances, clock dropping will be more exaggerated.
Editorial, Testing: Steve Burke
Video Producer: Andrew Coleman