Intel’s Coffee Lake CPUs aren’t a hard “response” to Ryzen; the CPUs have been taped-out for a while now, but the response appears to align more with the release timeline and pricing. X299 moved forward to compete with Threadripper, and Coffee Lake received a similar treatment. One thing we won’t know, of course, is whether the pricing is some sort of a response to Ryzen. Intel’s i7-8700K premiere CL CPU carries an MSRP target of $360 1ku, a $10-$20 jump over Kaby Lake 7700K CPUs with fewer cores and similar frequencies. Either way, the i7-8700K is here now, and we’ve got a densely packed review covering most aspects of Coffee Lake.
Our Intel i7-8700K review will focus on delidding, liquid metal application, overclocking, gaming & streaming benchmarks vs. Ryzen, power draw, and production benchmarks. Our i5-8600K review will post separately, as this is dense enough as-is.
Deprecating Old Tests
As a foreword, we’ll be deprecating our old CPU benchmarks going forward. Coffee Lake marks a refresh of our CPU test suite, though we are still carrying-forward some now-retired tests for comparative/archival data. These tests will be slowly phased-out as we accumulate more data for the new benchmarks. The idea is to conduct both simultaneously, with the older option acting somewhat like an LTS build as it is gradually retired.
The new testing involves a new suite of games, new testing methods (including 1440p tests), delidding & LM testing (debuted in our X299 coverage), and new production render testing.
Overclocking & Reject Sample
It seems that we received one of the worst samples of the media lot, when it comes to i7-8700K overclocking. We ended up stuck at 4.9-5.0GHz with a Vcore of 1.40-1.42, a far cry from Der8auer’s golden sample unit at 5.2GHz and 1.375Vcore:
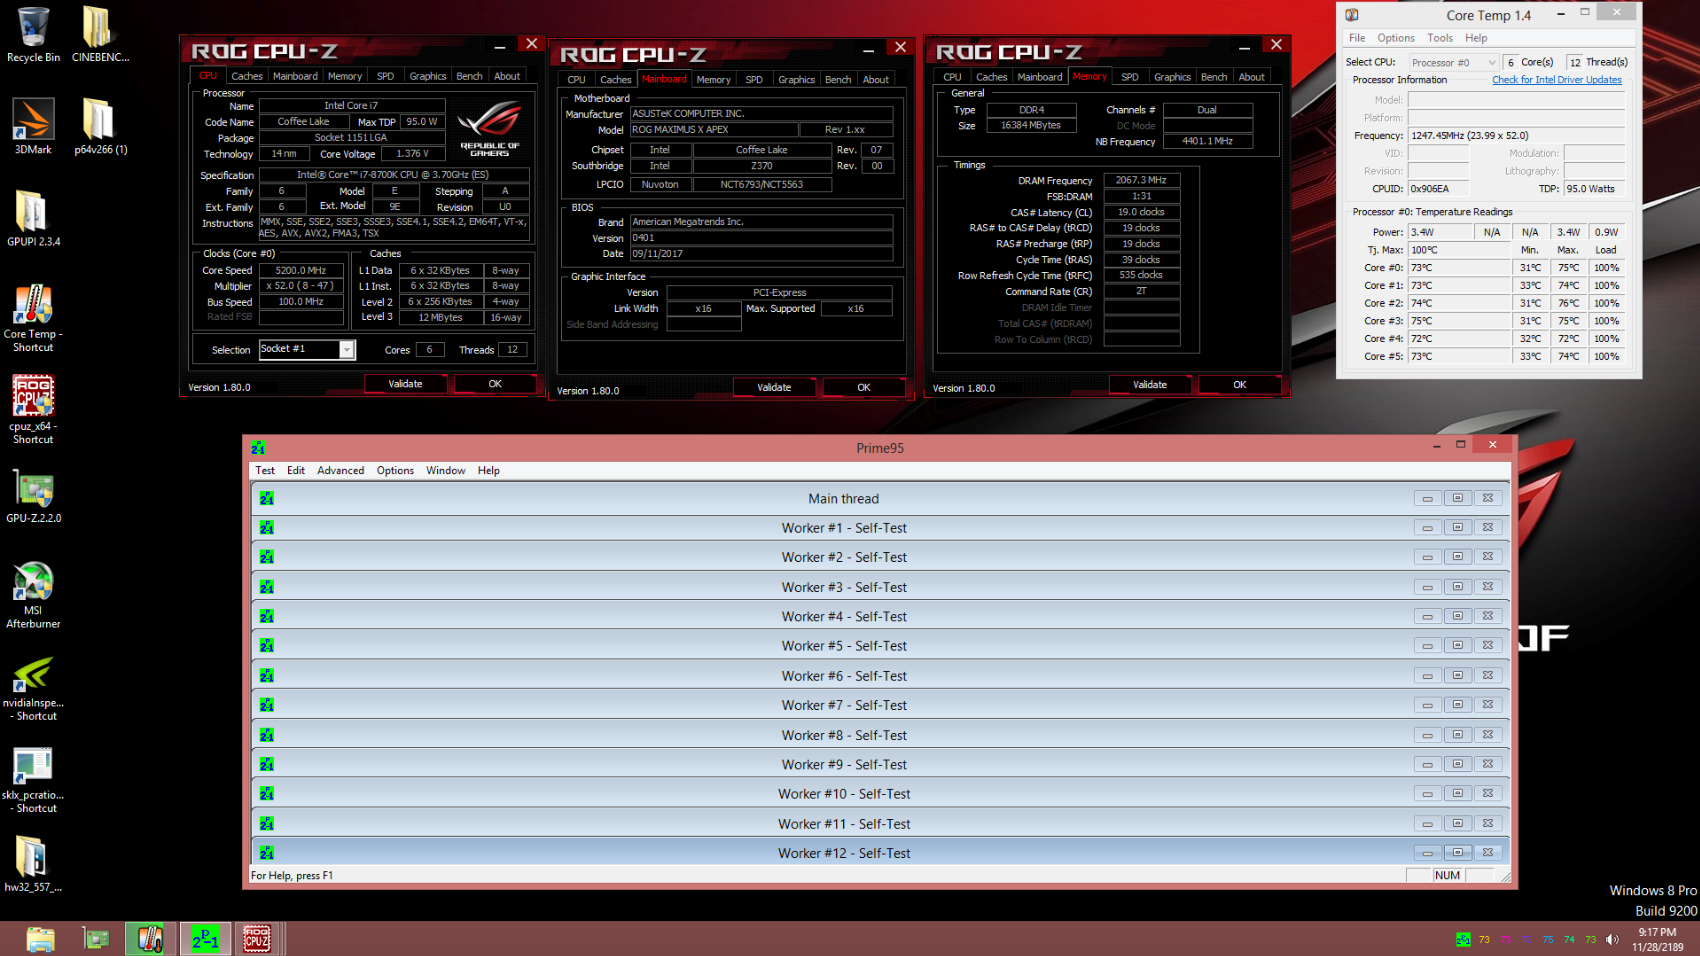
We struggled to hold 5.0GHz stable in some production tests (like Blender), and required high voltage to hold 4.9GHz. We haven’t re-attempted overclocking with liquid metal yet, but did delid the CPU with Rockit Cool’s delid kit and used Conductonaut liquid metal.
Some of this comes down to the motherboard. Gigabyte's Ultra Gaming Z370 board seems to output lower voltage than we ask for in BIOS, which makes it difficult to gauge what's actually going on versus what you're telling the board to do.

Test Platform
All of the new (non-legacy) CPU tests were conducted with 3200MHz CL16 memory. A GeIL EVO X kit was used across the board, with some exceptions made for a GSkill RGB Trident Z kit that had been reconfigured to match the GeIL timings. We’ve also moved to a 1080 Ti FTW3 from the 1080 FTW1, making for a stark difference in GPU bottlenecking headroom between the legacy and new tests. Part of this means updating drivers to version 385.69, with Windows now updated to Creator’s Update (game mode disabled) for new CPU benchmarks and reviews. An EVGA SuperNOVA T2 1600W PSU was used as the primary power supply, with a Kraken X62 (max pump + fan speeds) used for the cooler on all benches.
Previous platform and test methodology information can be found in more recent CPU reviews, but we are updating in big ways for CL onward. We’ll detail the test method updates in a separate content piece in the future, as this content is presently being written while the writer is falling asleep for microseconds, hours ahead of embargo.
READER FAQ
To answer a few common questions this morning:
- All tests were run BEFORE the delid (stock conditions) except for the liquid metal tests, obviously.
- The 1700 was used for comparison because it is the 1700X & 1800X. They're all the same. Just overclock one to 4GHz and you've now represented all Ryzen 7 CPUs at 4GHz.
Let’s get some quick synthetics out of the way, then move on to the real testing:
NOTE: We observed issues with Gigabyte's F2 EFI revision that forced some tests to run in MCE mode. Fortunately, these do not impact our gaming results, as we used F4 and F5a for those (with MCE disabled by default). The synthetic benchmarks have been mostly recalculated to reflect this issue of Gigabyte's BIOS.
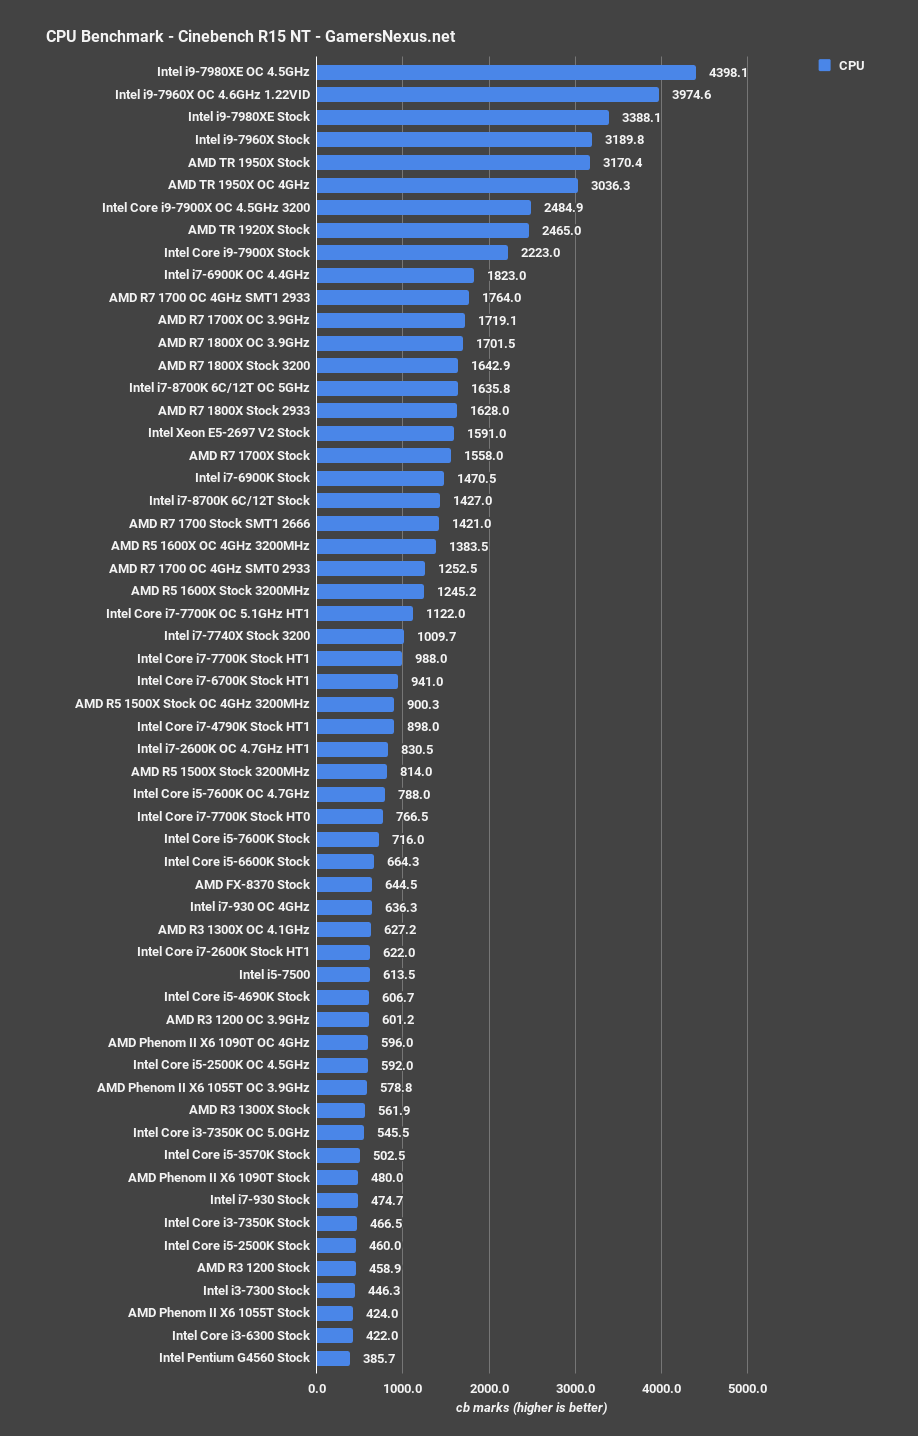
Intel i7-8700K Cinebench Score (CORRECTED)
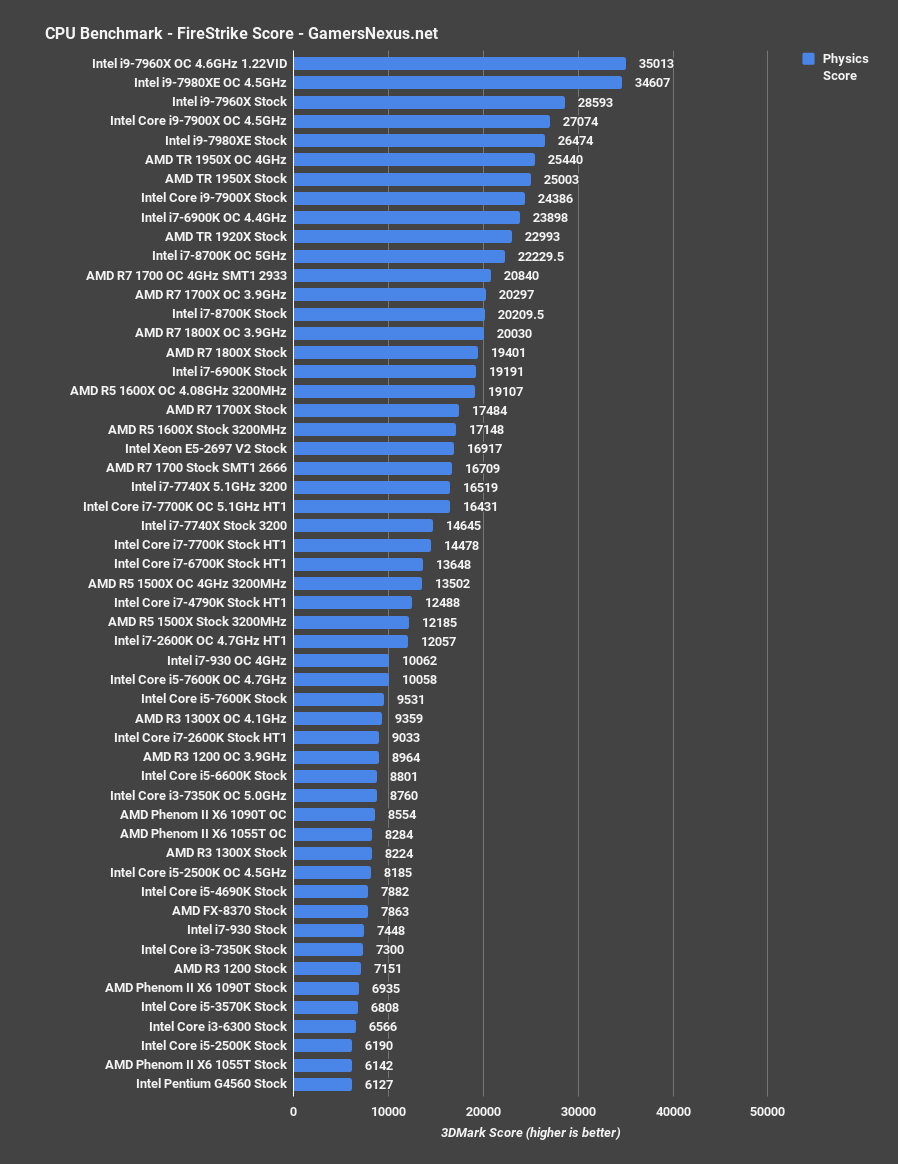
Intel i7-8700K FireStrike Score
Let's move along to the real testing. Continue to the next page for thermals, delidding, & liquid metal.
Intel i7-8700K Thermals & Delidding
We’ll start this one with thermals and delidding, since that’s been a popular topic lately. We’re running these tests with fixed frequencies and voltages, as that’s the only way to properly control for fluctuations in CPU behavior. We used Rockit Cool’s $40 delid kit to remove the IHS. It proved trivial to use and worked flawlessly which, for a $40 kit, is pretty damn good. We can recommend this one for Coffee Lake delids – the previous model for Kaby Lake CPUs will also work here, and delidding the 8700K is easier than the Skylake X CPUs as it lacks the dual-substrate layout.
Delidding the CPU was matched with removing the silicone adhesive from the IHS, and applying Thermal Grizzly Conductonaut liquid metal.
i7-8700K Delid Thermals: Blender at 4.9GHz / 1.4Vcore
Let’s start with the more exaggerated results: When testing Blender with a 4.9GHz frequency and 1.4 core voltage, our 8700K with Intel TIM and an NZXT X62 landed at 76C average core temperature, with a 10-second peak of 76.6C and a liquid temperature of 40.65C. The liquid metal version at the same frequency and voltage measured at 52.59C, or a reduction in average core temperature of nearly 24C.
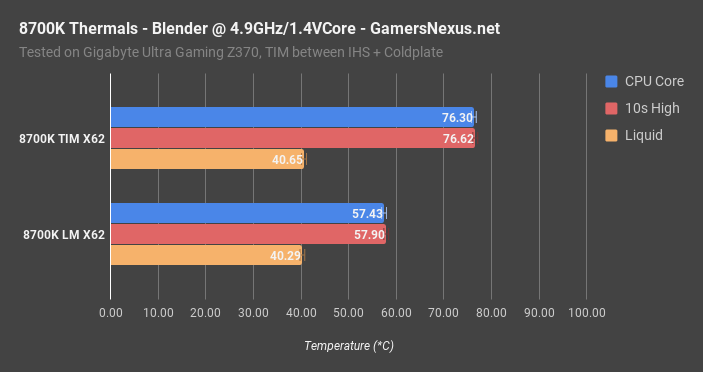
Liquid temperature measured about the same as before, at 39.82C. Looking into this further, we realized that, measured at a current clamp on the EPS12V rails, the 8700K with TIM was drawing about 10-20W more power at the same voltage and frequency. We’re not yet positive, but our present theory is that this outcome is a result of power leakage reduction on the CPU as a result of improved energy transfer efficiency from the die to the IHS.
i7-8700K Delid Thermals: Prime95 4.7GHz / 1.35Vcore
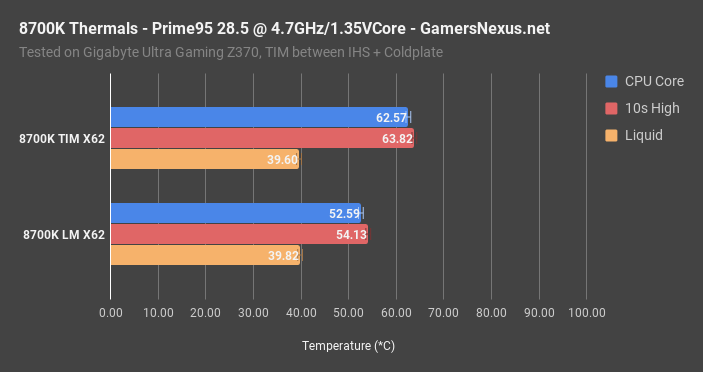
Testing with Prime95 28.5 and the CPU locked to 4.7GHz core, 1.35Vcore, we found the delta much closer than in the earlier overvolted test. The TIM test plants us at 62.6C average core temperature, with the 10-second high at 63.82C. Liquid temperature is effectively matched to the liquid metal version, at 39.6C versus 39.8C. This is within our test resolution and error. Using Conductonaut, we’re at 52.59C, for a 10-degree reduction in average core temperature.
This isn’t as big of a deal as with the Skylake-X CPUs, where we were constrained in overclocking by thermal limits, but is still worth considering for higher voltage overclocks. Coffee Lake actually runs reasonably cool, all things considered, and doesn’t need a delid for consumer overclocks (like the 7960X did). That said, a 10-20-degree reduction is no small feat, and means lower fan RPMs to achieve the same temperature. For anyone planning to push higher overclocks, we can recommend the liquid metal and delidder that we used. If you’re worried about successful delids, we’ve heard that Silicon Lottery plans to start binning Coffee Lake CPUs within the next week, and they offer a delidding service on frequency-binned CPUs.
As for the results here, Coffee Lake clearly isn’t in nearly as much need as Skylake-X for delids with overclocks. To be clear, none of the CPUs “need” to be delidded – but Skylake-X benefits in big ways from the move, as we were becoming thermally constrained prior to encountering voltage constraints when overclocking. With Coffee Lake, the constraint was primarily voltage or frequency stability, not thermals. The improved transfer efficiency does help reduce power leakage and benefit everything a bit, of course, but it’s not a hard requirement for overclocking. There are big gains to be had from delidding the 8700K, they just aren’t as ensconced in grandeur as the Sky-X delidding. The CPU works just fine without a delid. We’d still recommend it for serious overclocks, but it’s not “needed,” as some earlier rumors falsely indicated.
Continue to the next page for power consumption tests.
Thermals and power are directly related. Higher power consumption means higher heat, naturally, and the ability to get rid of that energy more efficiently also directly correlates with power leakage reduction.
Our power tests use Blender, FireStrike, Total War, Cinebench, and Prime95 for a mix of real-world and synthetic applications, ranging from stressful to lightweight in power consumption.
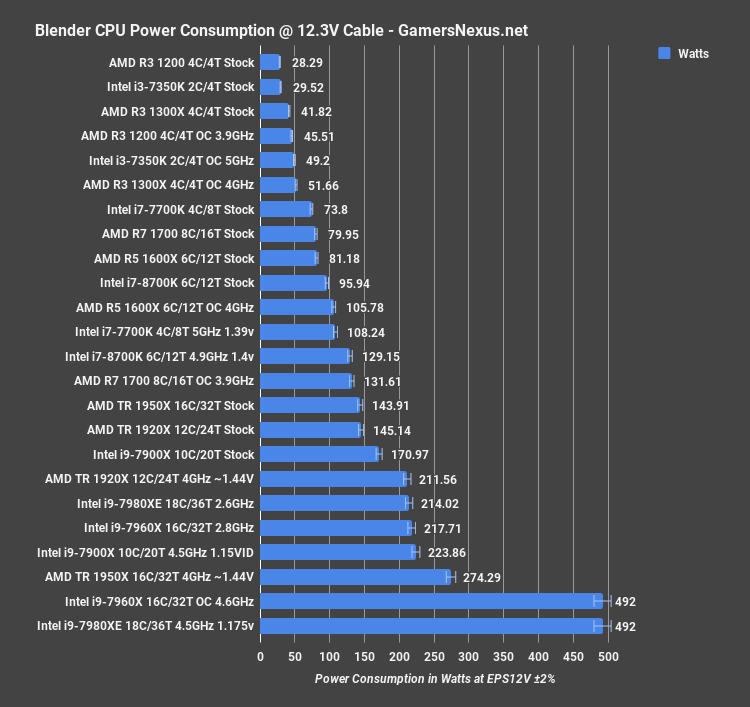
Intel i7-8700K Power Consumption: Blender
Starting with Blender, the i7-8700K pulls about 96W down the EPS12V cables in its stock configuration, permitting the CPU to complete the render in 26.6 minutes. The R7 1700 pulls about 80W in this configuration, completing the render in around 29 minutes. More on that later. Overclocking the i7-8700K puts us up to 130W when at 4.9GHz and 1.4V on our magically awful chip, which is right around where our overclocked R7 1700 lands for power. The i7-7700K stock CPU measures at 74W for this test, marking it about 20W lower than the 8700K. A lot of this has to do with motherboard and BIOS, as always, so these numbers could change.
Intel i7-8700K Power Consumption: FireStrike
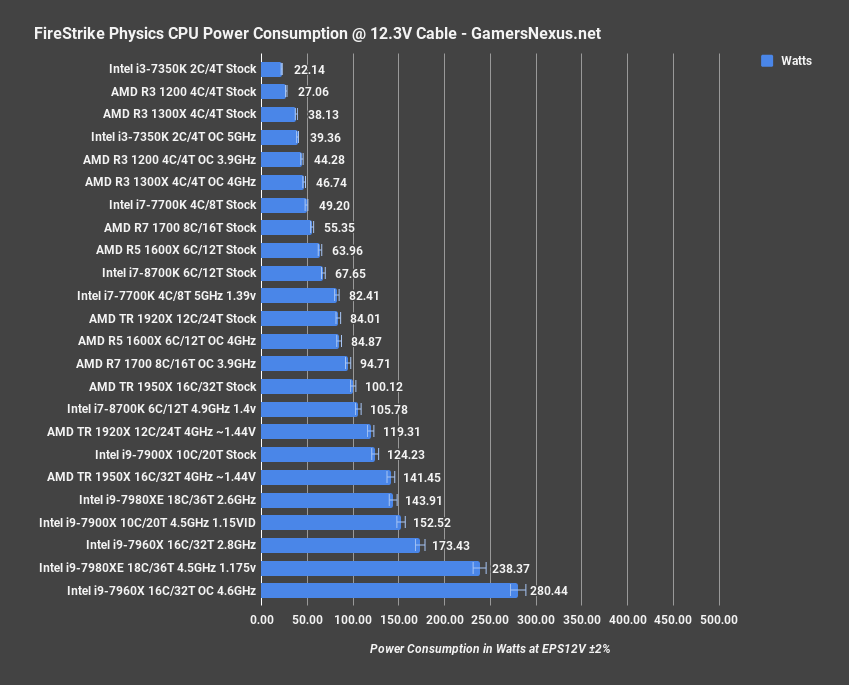
For the FireStrike Physics test, the 8700K plots at 68W under its stock configuration, or 106W when overclocked. For comparison, the R7 1700 draws about 55W stock and about 95W when overclocked. As for the 7700K, that’s sitting at around 50W with our Gaming 7 motherboard on the latest EFI.
Intel i7-8700K Power Consumption: Total War
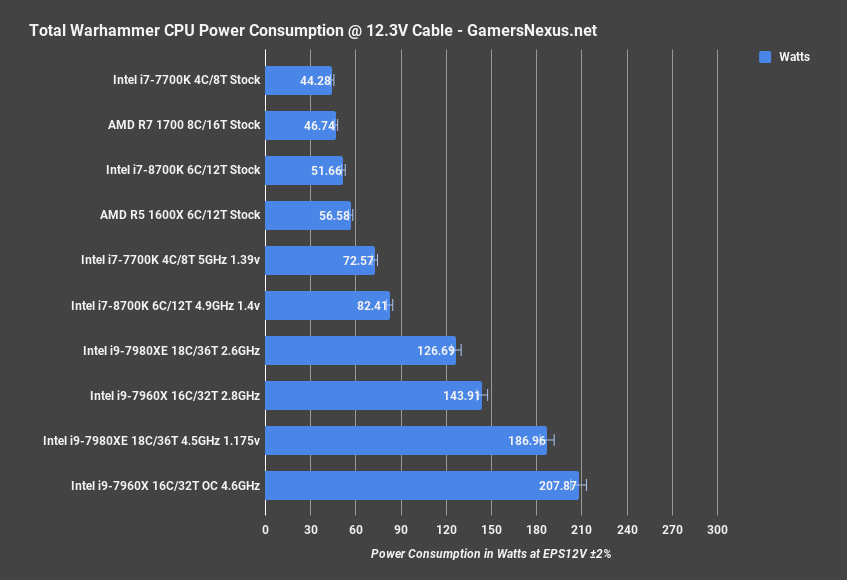
Total War: Warhammer power consumption (using the new bench) lists us at 51.6W, flanked by the 7700K (44W stock) and 1700 (46.7W), with the overclocked 8700K drawing an additional ~30W at 4.9GHz / 1.4Vcore.
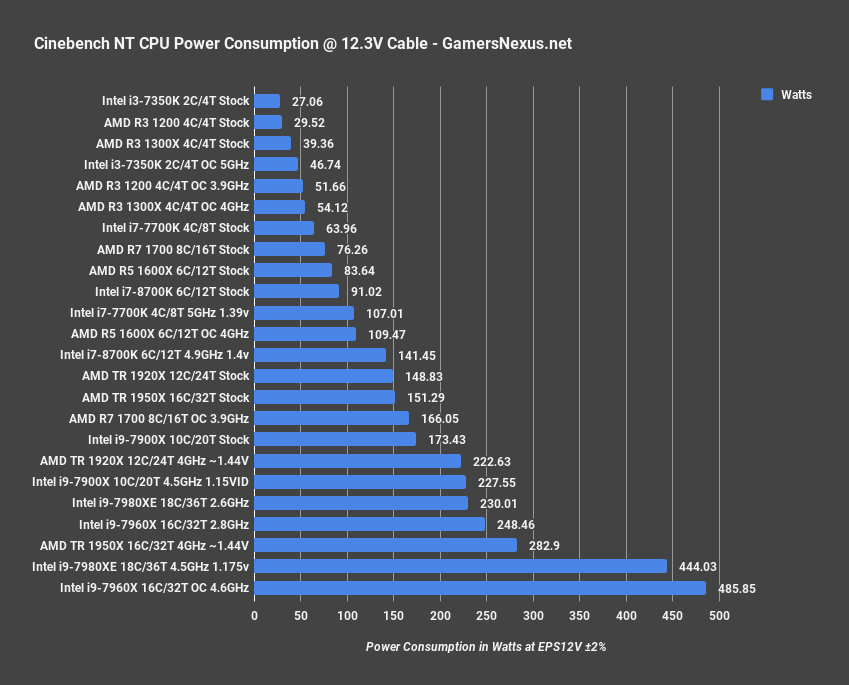
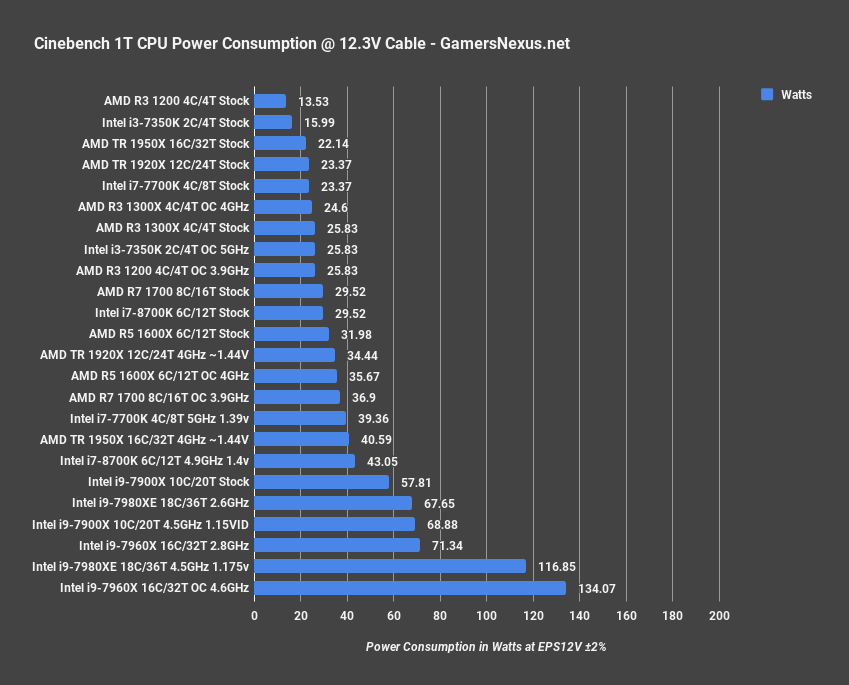
Intel i7-8700K Power Consumption: Cinebench NT & 1T
Intel i7-8700K Power Consumption: Prime95 29.2 8K
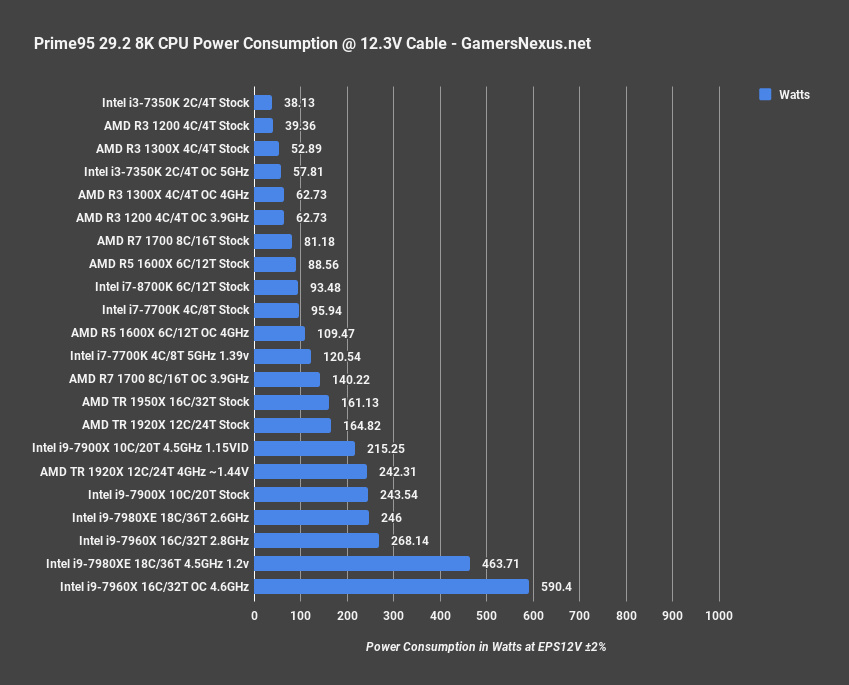
The Prime95 29.2 sample above is particularly interesting: What's not shown is that the X299 CPUs occasionally spike to 50A (615W) draw, but then trip OCP and crash. This can happen nearly instantaneously, causing jumps in power consumption that spike as much as +25A without warning, hence OCP. We did not encounter this behavior on the 8700K, but are remaining alert.
For game streaming benchmarks, continue to the next page.
Intel i7-8700K Streaming & Recording Benchmarks
We have two streaming and recording tests prior to our gaming workloads: For the first test, we’re benchmarking livestreaming capabilities as encoded on the CPU, using OBS and X264 with the Faster preset, outputting to YouTube at 10Mbps. The second test is done with local recording, captured at 15Mbps and using X264 Fast for the preset. The second test is the more intensive of the two, and is more likely to stress the CPU into a point of dropping frames. We primarily care about dropped frames, here: The benchmark looks at experience for the player and for the viewer, with player-side experience measured by a 5-minute FPS capture of gameplay, and viewer-side experience measured by outgoing log files and analysis of the final video output.
Realistic Workload: YT Streaming at 1080p60 / 10Mbps / Faster (DiRT)
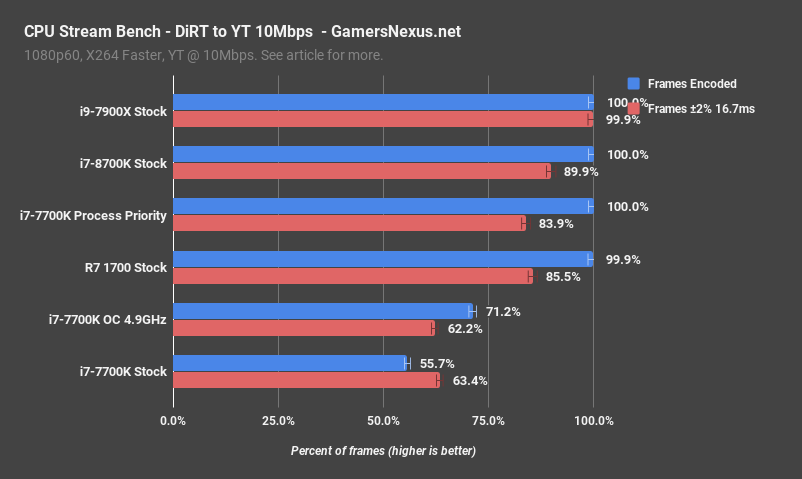
We’ll start with the easier workload. Streaming DiRT Rally to YouTube at 10Mbps and with the Faster preset, we end up encoding 100% of frames out of both the 8700K and R7 1700, with effectively no dropped frames on either. We’re at or below 0.1% drop frames on the R7 1700, but that’s within test variance and margins. At this quality setting, the two produce the same viewer experience for the stream. The 7700K dropped 44% of its frames prior to process prioritization, with the overclocked variant dropping about 30% of frames. Manually assigning process priority allowed the 7700K to deliver 100% of frames, dropping 0, but did require manual tuning. The 8700K and R7 1700 avoid this requirement.
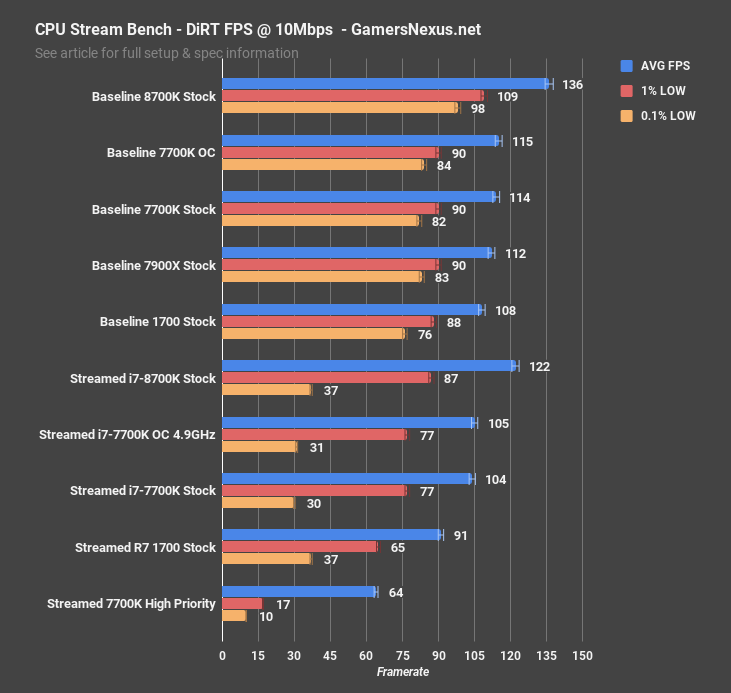
The next side of the coin is the player experience, shown in FPS. The 8700K delivers a baseline performance of 136FPS AVG, with 1% low frametimes measured at 109FPS, or 98FPS for 0.1% lows. Streaming drops us down to 122FPS AVG – really not a bad drop – with 1% lows at 87FPS, which is also not bad. 0.1% lows have fallen down to 37FPS, which seems a trend for all of our streamed outputs – we just can’t sustain low latency 99.9 percentile frametimes when streaming while gaming. A separate capture box is needed for that. It’s not something we noticed in this title, but highly competitive eSports players may want to take note.
The R7 1700 places at 108FPS AVG baseline, with its streaming output at 91FPS AVG, 65FPS 1% low, and 37FPS 0.1% lows. AMD suffers from the same frametime degradation as Intel in these single-system streaming tests, but starts at a lower baseline performance, managing to lose less of its initial performance offering. This comes down to the threads versus frequency argument: Ryzen has more threads at a lower frequency, and the game wants frequency, but the stream wants threads. It’s able to keep up with both, but at a hit to game performance.
The 7700K performs well in this title when left to baseline or non-prioritized performance, but remember that we dropped 30-45% of our frames when not prioritized, so the performance is shallow. Prioritizing viewer-side streaming performance meant no dropped frames, but also tanked our player-side performance.
The 8700K significantly improves on the 7700K’s former position, and manages to keep-up with the 1700 at these settings when streaming, with a faster framerate when gaming.
The question is how it keeps up when we turn up the heat and push a more synthetic, torturous workload on both CPUs.
Torture Scenario: 1080p60 / 15Mbps / Fast (Local Recording of DiRT & DOTA)
This is more of a worst-case scenario, meant to stress the CPUs to a point of showing differences. We’re recording locally at 15Mbps and using the fast preset, done for both DiRT and DOTA.
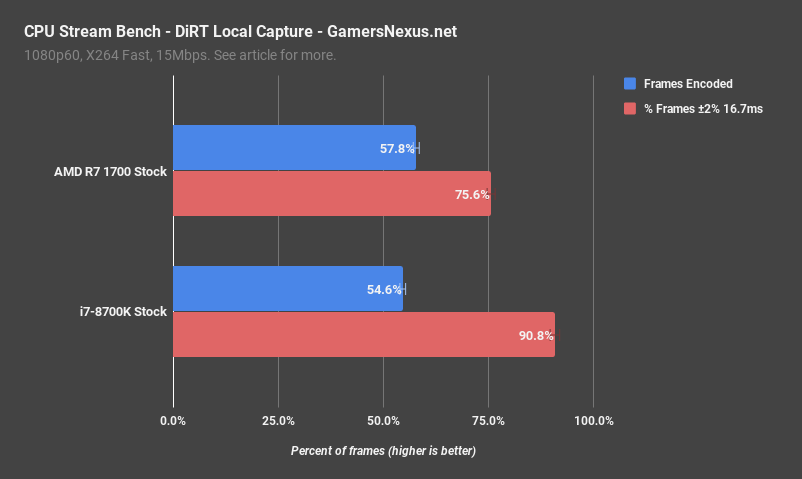
With DiRT, we deliver 54.6% of frames to the recording, dropping 45.4%. The R7 1700 manages to deliver 57.8%, dropping 42.2%. Extra threads are helping in the encoding process and manage to push the R7 1700 stock CPU into the lead over the 8700K stock CPU, with room for both to improve from an overclock, obviously, but we reserved that time segment for other tests.

Where the R7 outperforms by a few percentage points in delivered frames to the stream, it does technically deliver them with more variable latency. The 8700K delivers its 54.6% of frames with 90.8% averaging the desired 16.667ms, with roughly 4.6% above and below the 16.667ms 60FPS delivery window. The R7 1700 CPU delivers its higher percentage of frames, 57.8%, with 75.6% of those frames averaging 16.667ms. Just under 11% of frames are faster than 16.7ms, with just under 14% slower than 16.7ms. Neither of these outputs is playable, obviously, but the goal isn’t playability – it’s a stress test, at which point you’d obviously step-down to something like the Faster or Ultrafast preset. The R7 1700 and 8700K both have pros and cons here, with the R7 delivering more overall frames, albeit more chaotically.
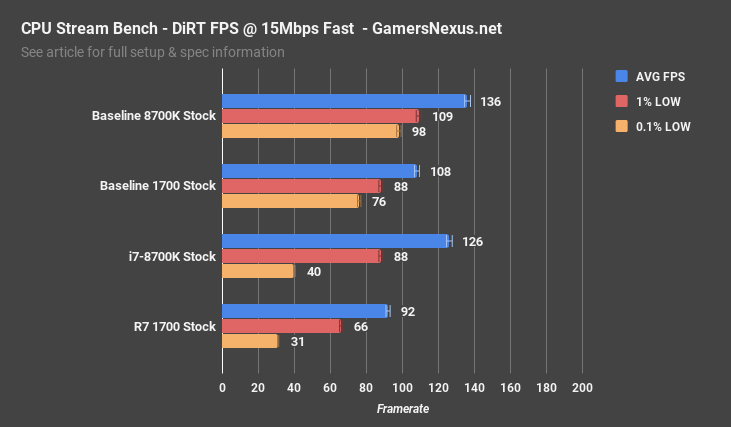
As for FPS, the 8700K averages 136FPS baseline, without any capture interference, and the R7 1700 averages 108FPS baseline. Neither CPU drops very far in its captured performance: We fall to 126FPS AVG on the 8700K and 92FPS AVG on the R7 1700, which amount to 7.4% and 14.8% reductions from baseline, respectively. Both CPUs have room in player-side FPS to improve capture-side delivery. In heavy workload scenarios, we’d recommend playing around with process priority and affinities to better manage where the resources are spent. There’s not much point in spending all those CPU resources on FPS at or above 100, for either CPU, when the recording can’t keep up. The 8700K has more room to play with this particular title and greater consistency, despite a slight deficit in total frame delivery.
DOTA2 Torture Scenario

With DOTA2 under the same conditions, the story changes a little bit: The R7 1700 captures 85% of its frames successfully, dropping 14.9% in this torture workload. The i7-8700K captures 68% of its frames successfully, dropping 31.9%. We won’t show a chart for this quick fact, but both CPUs push 88% of their frames within the 16.67ms window – it’s just that the 1700 manages to deliver a significantly higher count of frames to the capture file. Playing these files back side-by-side, the result is obvious: In this particular title, the R7 1700 does provide a better capture output than the 8700K, though neither is ideal for our torture load. You’d want to drop settings a little bit on the 1700 to recoup those 15% of dropped frames, but you’d have to drop significantly on the 8700K or start tuning priorities.
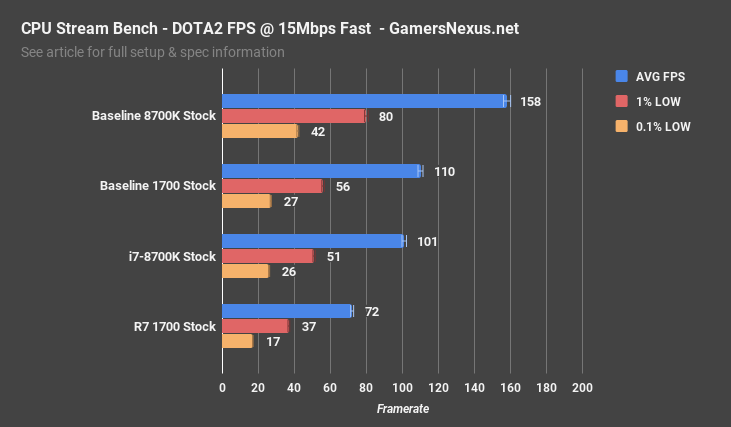
Here’s a look at the framerate chart, which gives a better idea as to where the 8700K’s power is going. Baseline performance is 158FPS AVG for the 8700K, or 80FPS for 1% lows. This is significantly bolstered over the 110FPS AVG and 56FPS 1% low of the R7 1700, which is already known to drag a bit in DOTA2. Beginning the game capture, the 8700K drops 36% of its throughput, to 101FPS AVG, with the 1700 dropping a similar 35%, to 72FPS AVG.
Where the 8700K significantly outperforms the R7 1700 in player-side framerate, it is significantly underperforming in capture framerate. Giving process priority to OBS would solve some of this problem, as would an overclock, but that’s exiting out-of-box territory.
To make things very clear: Both these CPUs, the 1700 and 8700K, are perfectly capable performers for live streaming in our earlier-tested 1080p60 / 10Mbps scenario. The torture workload immediately above is meant to draw-out differences between powerful CPUs.
Continue to the next page for game benchmarking.
Game Benchmarking – Legacy & Updated
For game tests, we’re starting with legacy benchmarks first, then moving to our more data-limited new tests. Please keep in mind that these legacy benchmarks are primarily provided for scaling comparison against 10 years’ worth of Intel and AMD parts, but for modern tests, we’ll want to look to the new game benchmarks. The new charts are more limited on how much is present, as the tests were just instituted.
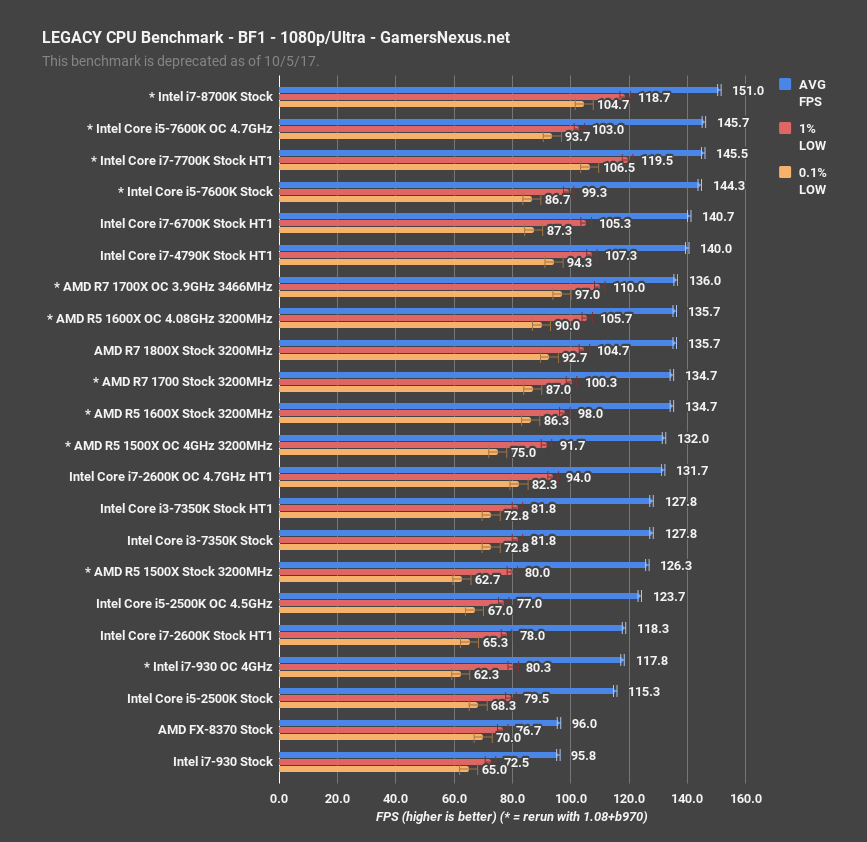
Legacy Game Benchmark – Battlefield 1 on 8700K
In Battlefield 1, the 8700K chart-tops at 151FPS AVG, placing it a few percent ahead of the 7700K. As for scalability, it goes like this: The i7-930 Nehalem CPU runs at 96FPS AVG, with the overclocked variant at 118FPS AVG. The i7-2600K runs at 118FPS AVG, with 4.7GHz performance at 132FPS AVG. That’s roughly a 23% climb stock-to-stock. We skip Ivy Bridge here and jump to the Devil’s Canyon 4790K, operating at 140FPS AVG, with the i7-6700K at 141FPS AVG and the 7700K at 146FPS AVG. Part of the reason for our new tests is this one: We’re bumping into other limits, so we’ll soon be moving on to the 1080 Ti and new games.
Legacy Game Benchmark – Watch Dogs 2 on 8700K
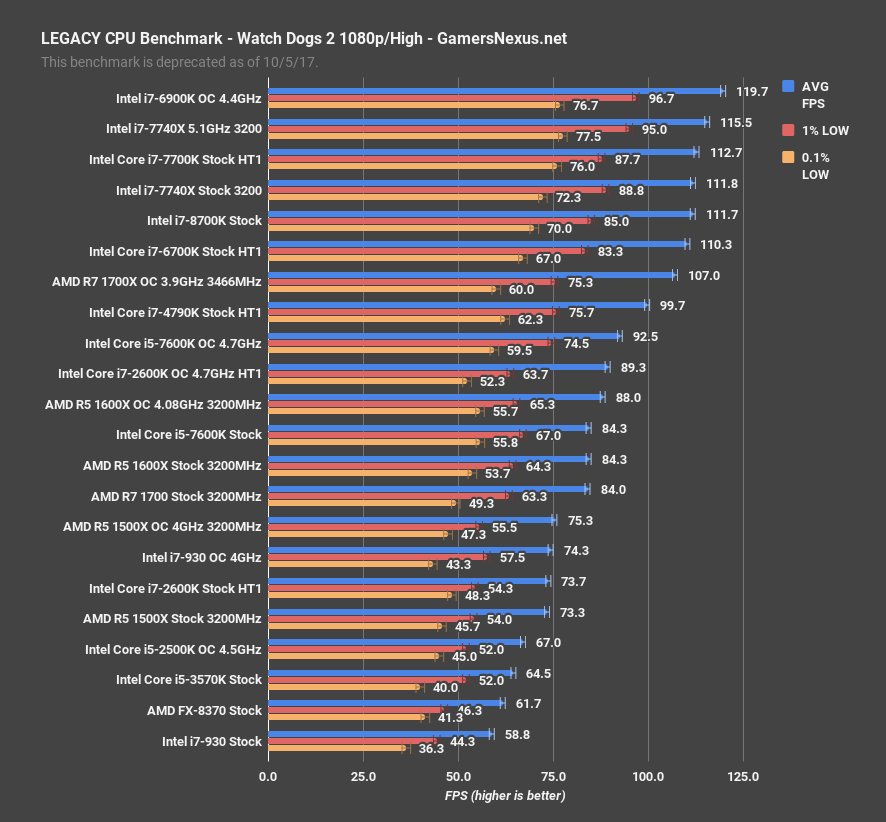
In our legacy Watch Dogs 2 test, the 8700K performed nearly the same as the 7700K, held back in some ways by the more limited boost clock. We noticed that our Gigabyte board often only turbos to 4.4GHz all-core during games, which is 100MHz lower than the 7700K’s all-core turbo. This sometimes means a slight deficit to framerate, despite the increased core-count; just like AMD’s trouble with heavily threaded CPUs, Intel is going to face an adoption challenge on the gaming front. In the future, it’ll happen – but for games out today, some will benefit from the threads and some would better benefit from speed. We have been told that some of the ASUS boards boost to 4.7GHz all-core in stock settings, which would net higher FPS.
New Game Benchmark Suite
Moving on to the new game tests, please note that none of these results are comparable with any previous tests. We are using a 1080 Ti, a newer version of windows, different memory, different settings, and different test patterns. Legacy tests use a 1080 FTW1.
8700K Civilization VI Benchmark
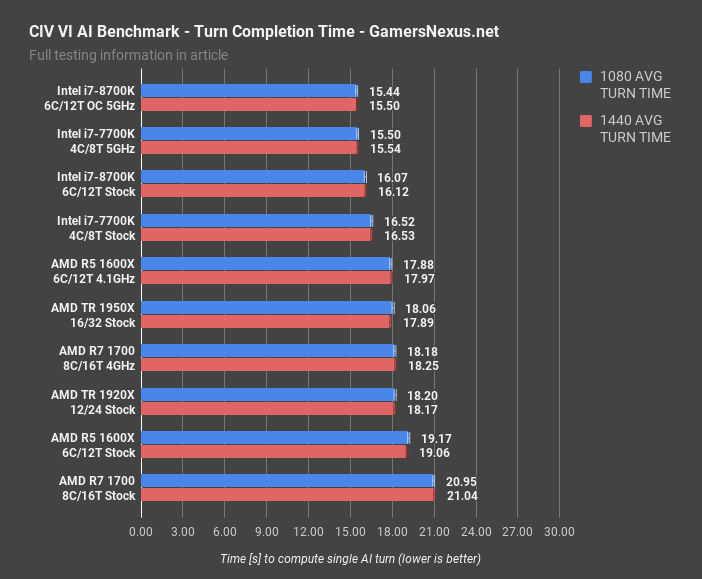
Starting with Civ VI, we used the AI benchmark to test the time required to compute AI turns, as FPS is useless here. The turn time is about the same at 1440p as it is at 1080p, though we did test both. AVG FPS actually goes up for worse CPUs, because the time spent sitting idle on the screen is longer, as it takes longer for the game to calculate a turn. This makes FPS an unusable metric for this particular AI benchmark.
The 5.0GHz overclocked i7-8700K holds the fastest average turn time, at about 15.4-15.5 seconds per turn. To give an idea for range, this is a 26.6% reduction from the slowest time. Although a 5-second range average turn time is not huge, keep in mind that this is per-turn, so a 5-player game would benefit from a 25-second reduction in total time to get back to your next turn. Across long play periods, this can add up, but the relevance is up to you.
Anyway, the 8700K stock CPU completes its turns in about 16.1 seconds, or about 4% slower than the overclock. The 7700K stock CPU completes its turns in 16.5 seconds, with the 4.1GHz 1600X not far behind. As you can tell by looking at the 1600X stock & OC numbers, the 1700 stock & OC numbers, and the 8700K, frequency matters in this game. The 7700K versus the 8700K indicates that frequency is of at least slightly more import than thread count.
Total War: Warhammer 1 CPU Benchmark – 8700K vs. R7 1700
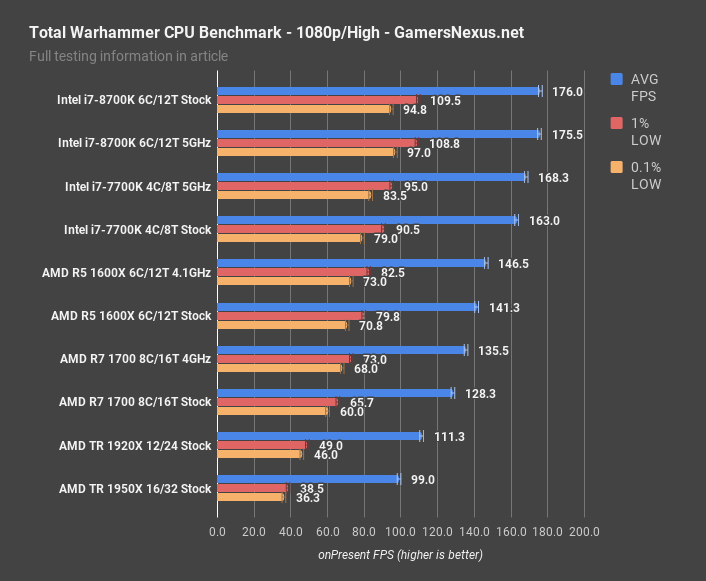
For Total War’s new benchmark, we measured the 8700K as a chart-topper at 1080p, with 176FPS AVG and lows at 110 and 95FPS. We experienced a bottleneck at 1080p, with the overclock not providing any additional performance versus stock. The 7700K is 7.4% slower at 163FPS AVG, with the R5 1600X at 4.1GHz running a 147FPS AVG and 16% slower than the 8700K. Total War favors the frequency advantage of the 1600X over the stock 1700, clearly.

At 1440p, we equalize some of the distance with GPU limitations, but still see differences. The i7-8700K is clearly bottlenecked on the GPU, operating at 153FPS AVG for each SKU. The 7700K runs at 143, or 7% behind. The stock R7 1600X runs 20% behind the 8700K, here.
Project Cars 2 CPU Benchmark on i7-8700K
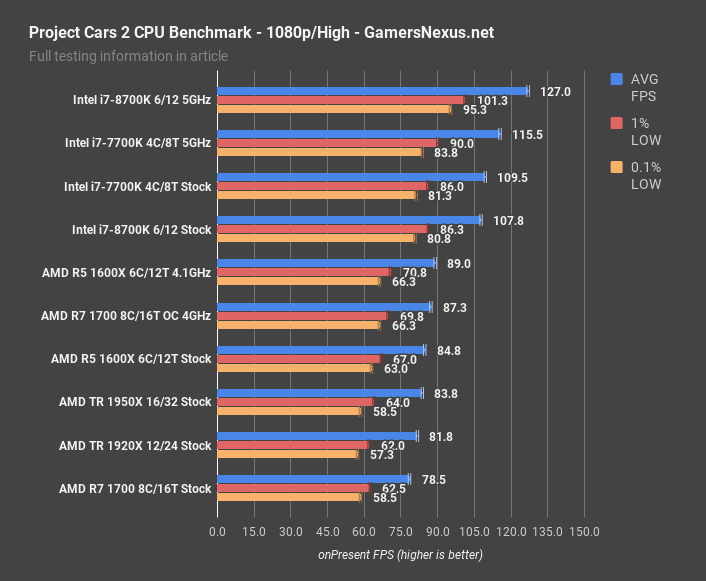
Project Cars at 1080p has the 5GHz 8700K at 127FPS AVG, benefiting from the frequency-focus of the game. The 4.4GHz all-core operating frequency condemns the 8700K to perform about the same as the 4.5GHz 7700K in our testing, both at around 108-110FPS AVG. The R7 1700 further demonstrates the frequency-focus of this game, placing at 78.5FPS stock, but 87FPS at 4GHz. The result is a staggering 45% advantage for the 5GHz 8700K versus the 4GHz 1700, or 43% if versus the 4.1GHz 1600X. Stock-to-stock, the difference shrinks to 27% versus the higher-clocked 1600X.
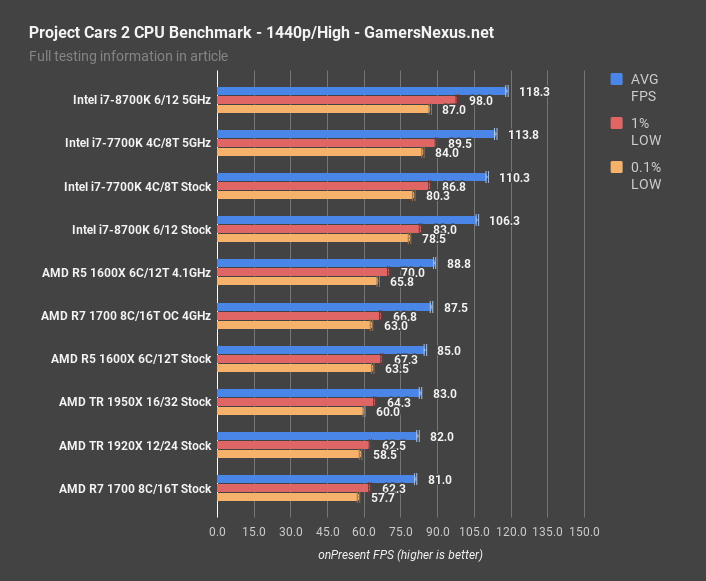
At 1440p, the 8700K manages 118FPS overclocked, 106FPS stock, with our all-core 100MHz deficit to the 7700K producing the expected favor for Kaby Lake. Ryzen performance remains more or less exactly where it was for the 1080p results, as a result of being CPU-bottlenecked.
GTA V CPU Benchmark – 8700K
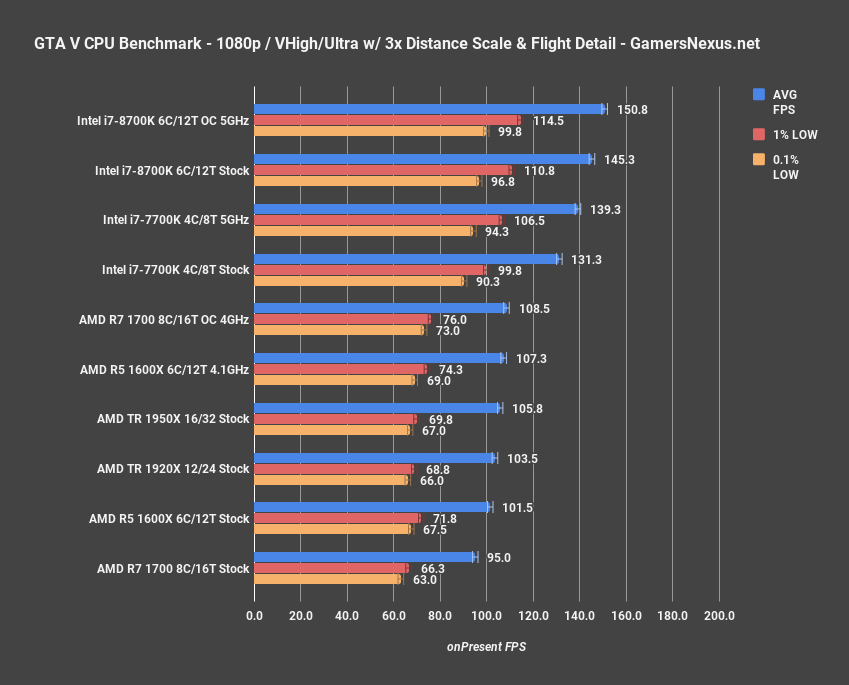
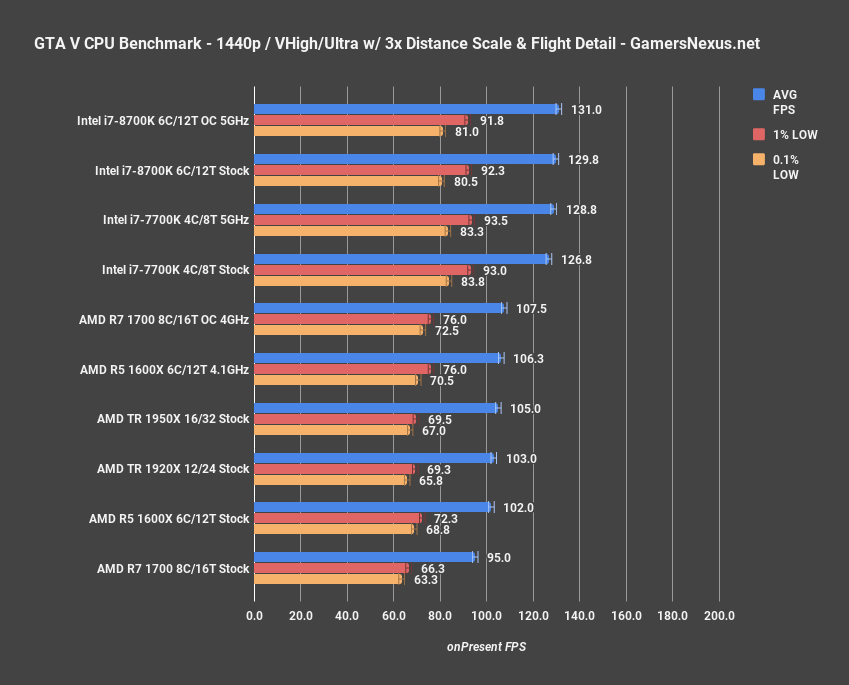
Keep in mind that GTA V encounters a bug at 187.5FPS, triggering severe stuttering in some cases.
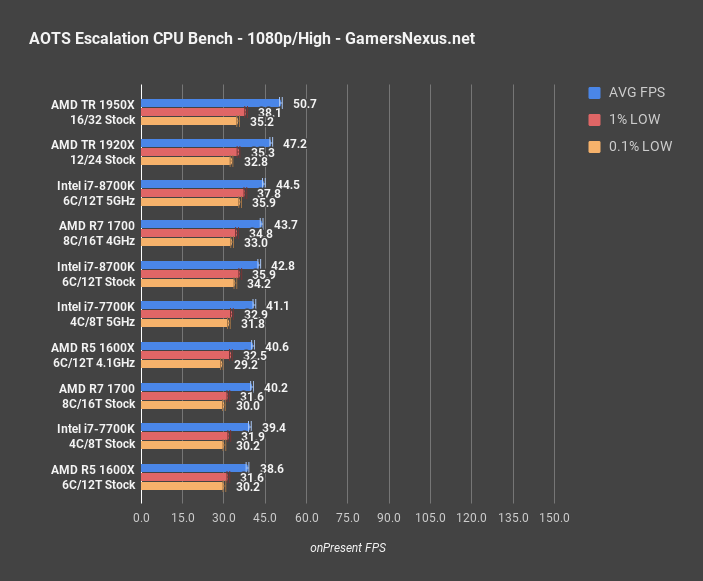
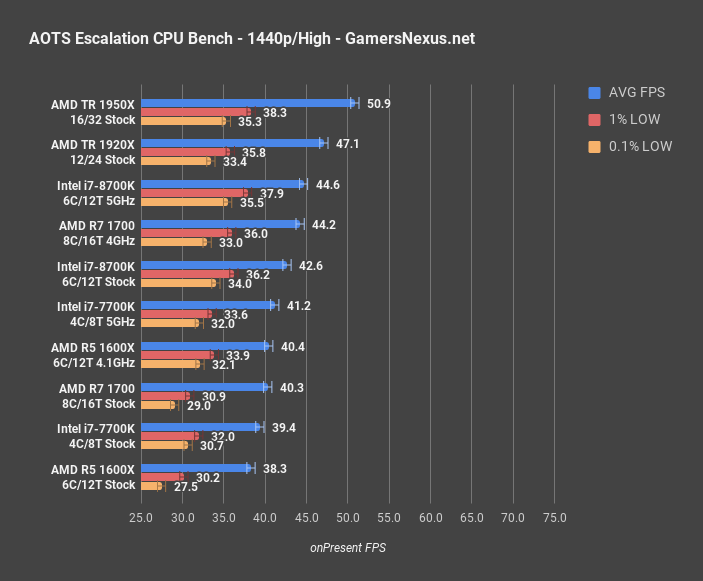
Ashes of the Singularity Dx12 CPU Benchmark – 8700K
Continue to the next page for Blender & Premiere tests.
Blender CPU Benchmarks – 2.78a & 2.79
Getting into some of the production workloads, we’ll start with our legacy Blender test, using version 2.78a, then move into our updated set of renders on 2.79. Like the gaming section, we’re doing this to provide some idea of scaling for a year’s worth of CPUs, but also provide the important modernized information with a more limited data set. The new tests will grow as we move forward.
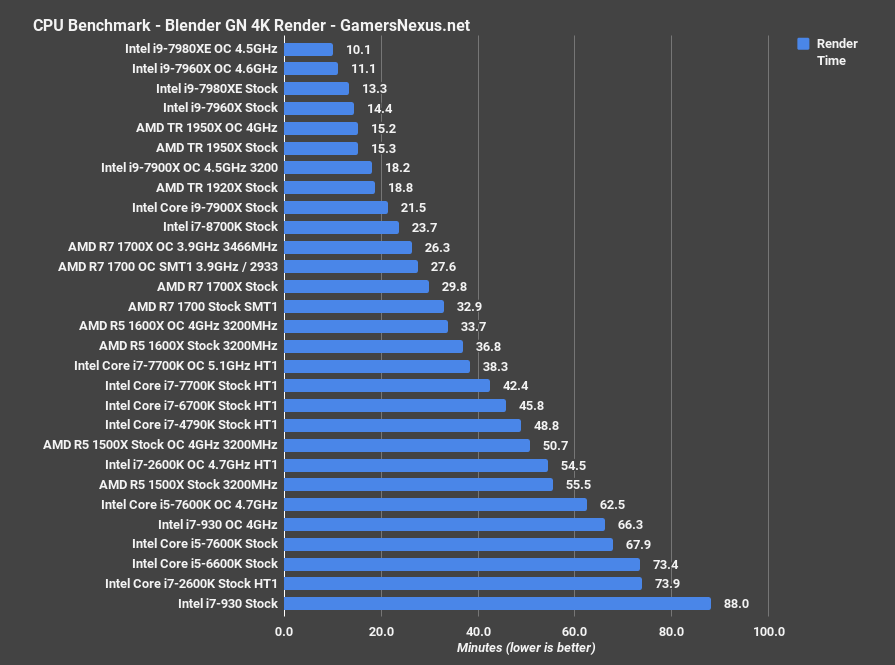
With version 2.78a and our shown in-house monkey heads render, the i7-8700K stock CPU takes 23.7 minutes to complete the render, which is about a 44% time reduction from the i7-7700K stock CPU’s 42-minute render time. Compared to R7 CPUs, the 8700K takes about 11-13% less time to render than 3.9GHz overclocked R7 CPUs, including the 1700X at 3.9GHz and 3466MHz. The 8700K takes 28% less time to render than the R7 1700, thanking its high frequency and core combination for the performance.
Turns out, Intel also has version 2.78a to thank. For version 2.79, we’re using the tests shown on the screen now: These include the monkey heads, a GN intro render, and a heavily modified Blender project sample file, where we tuned the settings. These projects each contain different, carefully-selected material types and physical elements to stress different aspects of rendering.
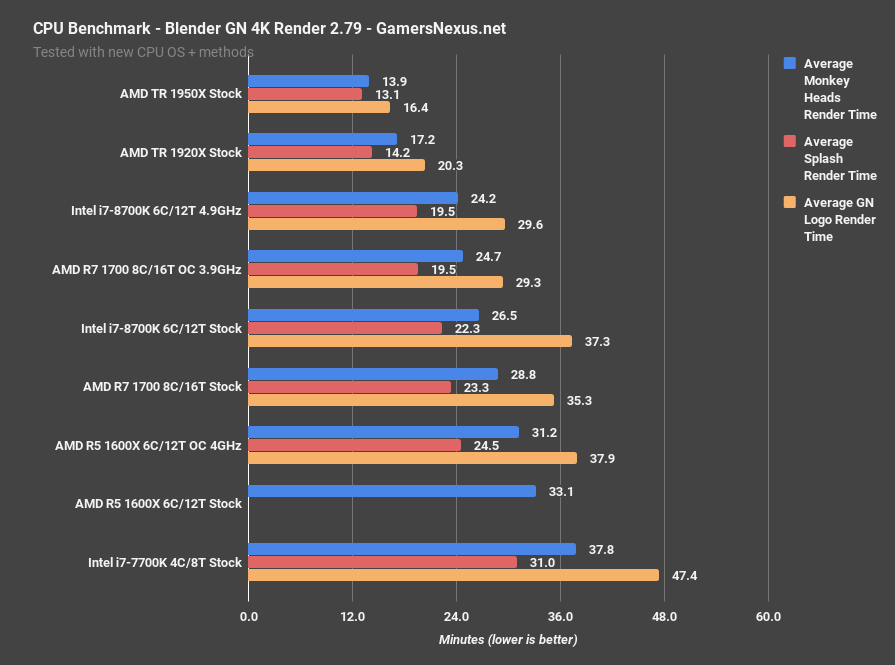
The monkey head render takes 26.6 minutes to render on the 8700K, compared to 28.8 minutes on the R7 1700, both with 3200MHz CL16 memory. The 8700K completes the monkey head render 7.6% faster than the R7 1700, in this case, closing the gap. Overclocking both produces a 24.15-minute render on the 8700K, or 24.7-minute render on the R7 1700.
The modified Splash logo takes 22 minutes to render on the stock 8700K, or 19.5 on the overclocked version. The R7 1700 stock CPU completes the render in 23 minutes, making the 8700K finish with a 4% time reduction. Overclocking the 1700 ties it with the 4.9GHz 8700K. Some CPUs will overclock higher, naturally, but it seems the gap won’t be that large for this type of render.
Improvements over the 7700K are significant, and position the 8700K as an actually viable rendering CPU, whereas the 7700K would be far better accompanied by CUDA or replaced with another option.
Premiere CPU Benchmarks with 8700K – 1080p60 AVCHD
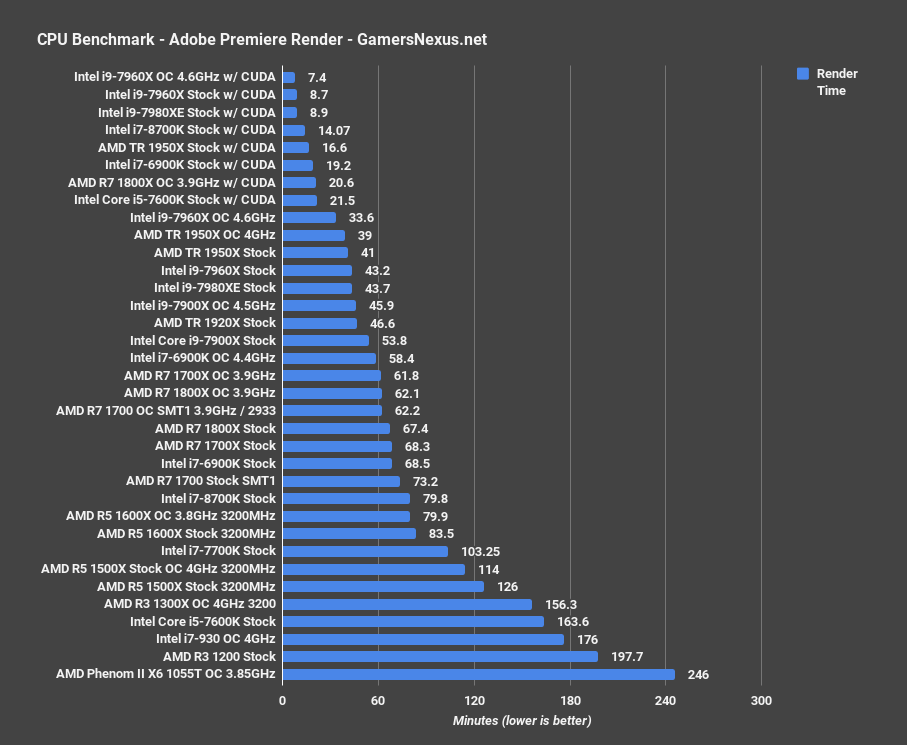
For Adobe Premiere, we’re still primarily focusing on CPU renders, but will soon be adding CUDA renders to the CPU benchmarks. It seems that the modern version of Premiere cares a bit more about CPU spec than previously.
With the 8700K, we’re completing our 1080p60 AVCHD render in 79.8 minutes, which is about tied with the 12T 1600X once it’s overclocked, and 6 minutes slower than the R7 1700 stock CPU. Generationally, this is a jaunt of 24 minutes from the 7700K stock CPU, which completed the render nearly 30% slower. For CPU-focused renders, it appears that Ryzen remains the better choice for this particular project file. The 8700K does well, but is beaten by the R7 CPU. Again, though, Premiere is difficult to test for: The render times greatly change based on what’s going on in the video and the effect files, so this is very much a YMMV situation.
Conclusion: Intel i7-8700K 6C/12T Review
Availability is still a giant question mark, here, and may yet result in follow-up coverage as we determine the situation of presence of the product at retailers. Rumors indicate low quantities at launch, but we haven’t been able to firmly confirm those. For now, this conclusion is being written (albeit sparingly) under the assumption that you’re considering a purchase at MSRP ($~350-360), not some jacked-up price, and that the product is available. The 8700K does a lot of things well, but if it can’t be bought, it’s going to be another Vega situation. We’ll keep an eye on that throughout the day, and please let us know of what you spot at regional retailers.
As for performance, CPU reviews are getting complex enough that each section is somewhat self-contained, and each appeals to different needs of different audiences. As such, mini-conclusions are contained throughout the review sections, rather than one massive conclusion at the end. We’ll defer to the rest of the body of this work for our multifaceted conclusions.
Editorial, Test Lead: Steve Burke
Additional Testing & Planning: Patrick Lathan
Video: Andrew Coleman