The AMD R5 2600 and 2600X are, we think, among the more interesting processors that AMD launched for its second generation. The R5 1600 and 1600X received awards from us for 2017, mostly laying claim to “Best All-Around” processor. The 1600 series of R5 CPUs maintained 6 cores, most the gaming performance of the R7 series, and could still capably stream or perform Blender-style production rendering tasks. At the $200-$230 price range, we claimed that it functionally killed the quad-core i5 CPU, later complicated by Intel’s six-core i5 release.
The R5 2600 and 2600X have the same product stack positioning as the 1000-series predecessors, just with higher clock speeds. For specs, the R5 2600X operates at 3.6GHz base and 4.2GHz boost, with the 2600 at 3.4/3.9GHz, and the R5 1600X/1600 operating at a maximum boost of 4.0 and 3.6GHz, respectively.
Test Platform (Sponsored by Corsair)
Motherboard | Gigabyte H370 Gaming 3 for Pentium (w/ 2400MHz) | GN’s side channels |
CPU | This is what we’re testing | - |
Memory | Corsair Vengeance LPX 3200 16-18-18-36 | Corsair |
Cooler | NZXT Kraken X62 | NZXT |
Power Supply | Corsair AX1600i | Corsair |
Video Card | EVGA GTX 1080 Ti FTW3 | EVGA |
For AMD, we primarily tested on these platforms:
- Gigabyte X470 Gaming 7, EFI revision F4B
- ASUS Crosshair VII, EFI revision 0505
- ASUS Crosshair VI, EFI revision 6008
Note that our initial Gigabyte X470 BIOS revision did not support disablement or tuning of XFR2. We ended up scrapping initial (internal) test data and replacing it once we received more consumer-ready BIOS revisions.
Wherever “X370” is mentioned, that’s the Crosshair VI. When X470 is mentioned, in gaming and production benchmarks, that’s the Gigabyte X470 Gaming 7. For overclocking, memory scaling, and game streaming tests, that’d be the ASUS Crosshair VII motherboard.
For Intel, we’re primarily using the ASUS Maximus X motherboard. Synthetic and Blender results, along with power results, are using the Gigabyte Ultra Gaming. We tested with the latest BIOS and with new Windows versions.
Game Streaming Test Methodology
Game streaming is tested on Gigabit Fiber internet, with active monitoring for packet loss or network-side errors (there were none). We use OBS v. 21.1 for livestreaming, and configure 1080p/60 for the stream output. Encoding is set to H264 with Faster settings, used for what we consider to be a high-quality stream at 10Mbps. We also test with 12Mbps at Medium encode settings, meant to serve as a torture test for when differences fail to emerge at more reasonable 10Mbps/Faster settings. Streaming requires both a quality streamer-side framerate and quality viewer-side delivery. It is impossible to deliver greater than the specified framerate of 60FPS to the viewer and playback service (Twitch, YouTube), and so a “perfect” score would be 100% frame delivery within 16.67ms per frame.
We actively log framerate performance for five minutes in DotA2 and DiRT Rally, with Playerunknown’s Battlegrounds (PUBG) logged for ten minutes. Multiple passes are conducted. We store all final MP4 clips locally and analyze them for further data validation and to calculate dropframes. YouTube plays back the livestream on the same host system, which increases load further and creates a real streaming experience.
We also log “baseline” performance metrics; that is, performance without any active livestream. The goal is to determine performance scaling and loss from baseline when adding a stream, which aids in determining the efficiency of a particular processor at juggling a game and a stream simultaneously. This also helps us understand scheduling.
A lot can be done to further tune and improve player and viewer experience with streaming, like process priority tuning and affinity tuning, which we’ve previously demonstrated as helpful with Intel scheduling.
Note again: We will reference video playback in this analysis. You’ll find the streamed clips in our video, embedded in this review.
Continue to the next page for game streaming benchmarks.
PUBG Streaming Benchmark – R5 2600X vs. i5-8600K
For streamer-side FPS in PUBG, the i5-8600K’s baseline, stock performance permitted a 138FPS AVG framerate, which butts it up against the FPS cap – the average would stretch a bit higher without that consideration. Lows are well-timed insofar as PUBG, which has issues with spurious frametimes in the 0.1% low range.
The R5 2600X stock operated a baseline performance of 127FPS, with lows functionally equal and indistinguishably different from the 8600K’s lows. The 8600K technically maintains a lead of 8.7%, but again, this is only half of the equation – and arguably the less important half.
At 10Mbps and Faster H264, the 8600K only drops 10FPS, and the same is true at 12Mbps with the much more intensive Medium encode setting. This would indicate that scheduling is keeping the entire workload on Intel, with limited resources made available for streaming. We’ll soon check that.
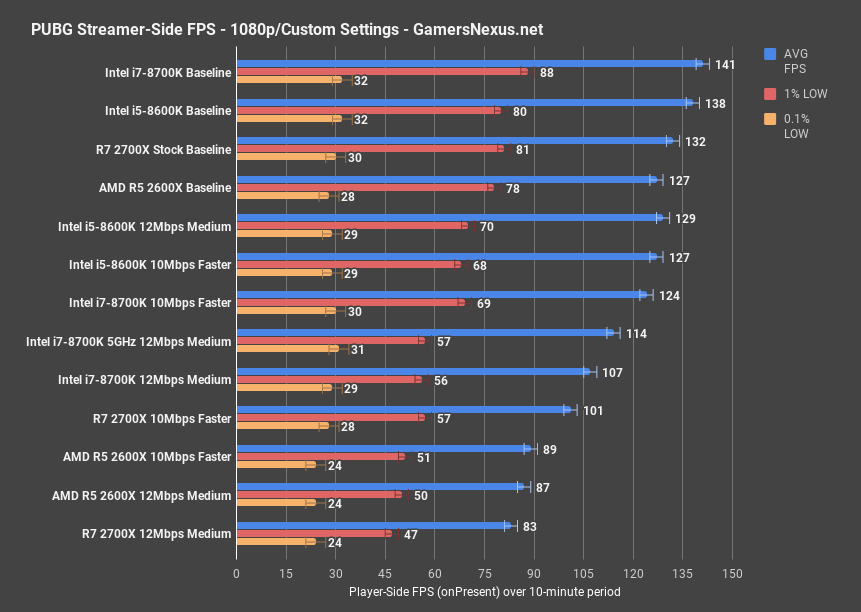
The R5 2600X drops harder in framerate, so the loss as offset from baseline is a greater dip at 30% reduced from non-streamed performance, but we don’t know what that means just yet. What we know for now is that the player would likely be satisfied with performance on either CPU if live streaming, although Intel holds an objective streamer-side framerate advantage when left stock and without priority or affinity tuning.
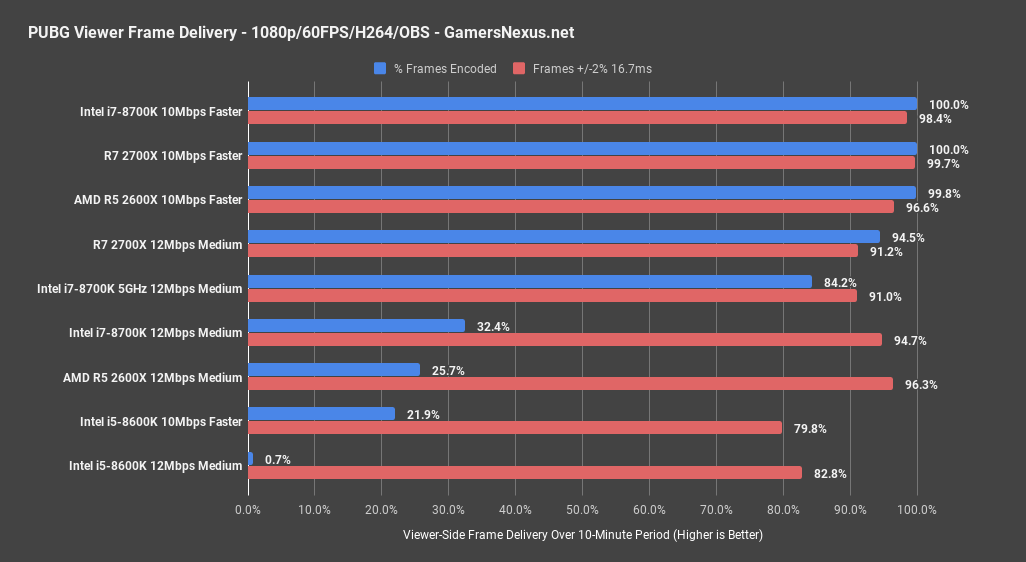
Moving on to the viewer-side chart, here’s where those numbers manifest: AMD’s 30% drop for streamer-side performance proves a worthwhile sacrifice, because it’s able to successfully encode 100% of frames for the stream. The 8600K completely crumbles when under the load of even Faster settings for encoding. You could get this to work, but it’d require dropping the encoding quality further and tuning some affinities and priorities. Even at our reasonable, realistic quality of Faster and 10Mbps, the 8600K struggles to keep up when left stock and untuned.
For Medium, we’re looking at a synthetic test, as we noted, to illustrate outside of margins which CPU is superior. AMD claims that flag for this test, managing to deliver 26% of its frames under the strain of a Medium encoding speed, while Intel gets clobbered down to a handful of frames delivered. It’s not even a slideshow – it’s just a picture.
Now, as for how useful this is, that depends. What you’re seeing on the screen right now is a video playback of both streams at 10Mbps. This is about the quality we stream to YouTube when we’re being conservative, and the 6C 8600K has a hard time with managing both the stream and the game. Again, capping the game and prioritizing resources would help, but the 2600X doesn’t require that treatment. It’s good to go out of box. The 2600X has substantially more headroom to sustain a higher quality stream with PUBG. Both are capable of streaming, it just depends on how much quality you want and how much you want to be under the hood to work on the 8600K.
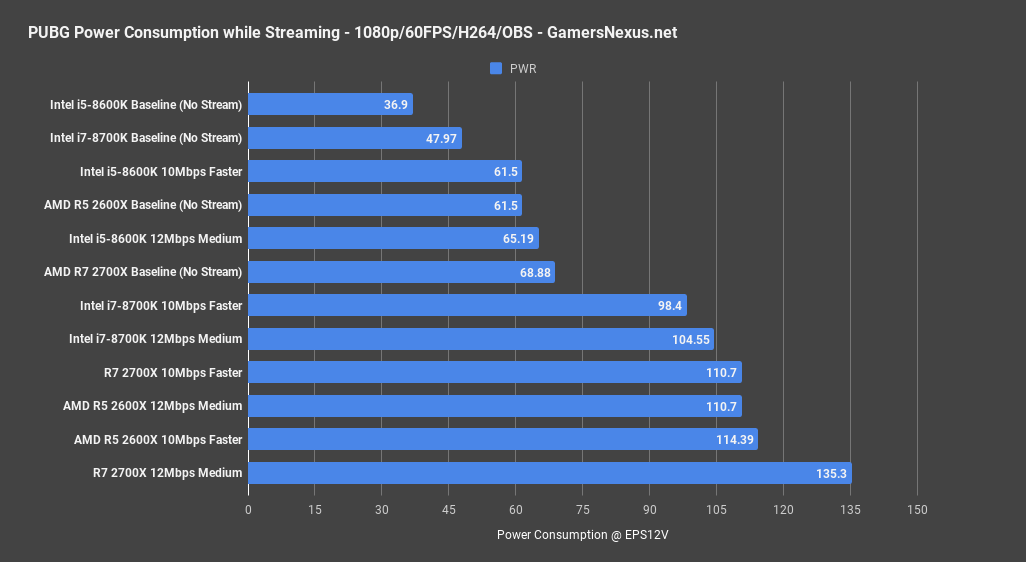
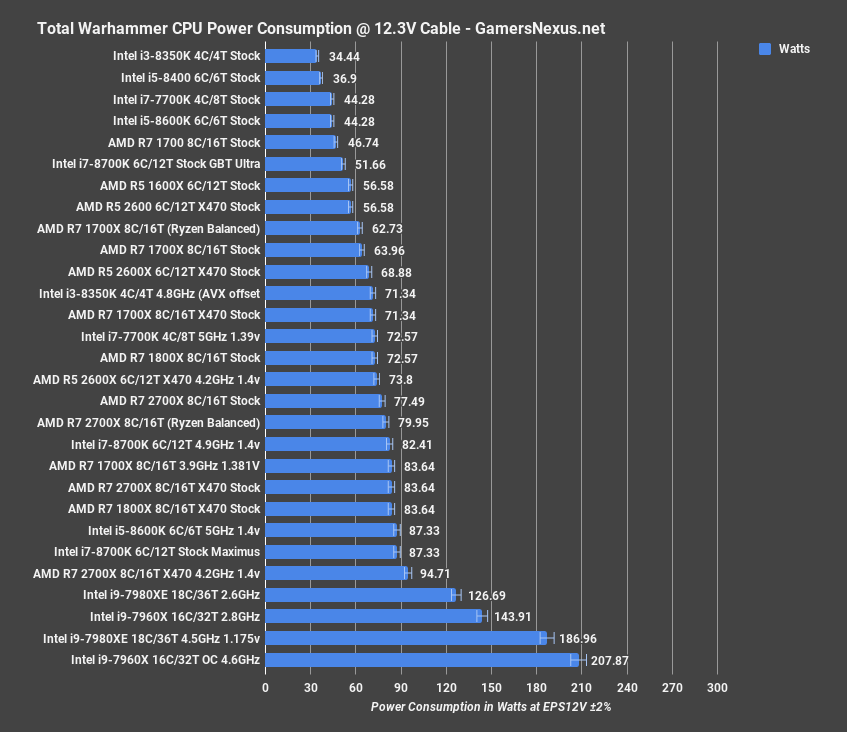
Power consumption while streaming is also sort of interesting. Clamped at the EPS12V rails, the Intel i5-8600K only ever draws between 37W for baseline non-streaming and 65W for streamed output. The R5 2600X baselines at 62W, with streaming at 111-114W. That’s a significant increase over the Intel CPU, but it’s also accomplishing the task that we asked it to do, so that’s fair.
The i7-8700K draws about 48W baseline, or 98 to 105W when streaming. The R7 2700X pulls between 68W baseline and 135W for a heavy stream. This is also why AMD’s TDP rating will confuse people – that’s not the same number as straight power consumption, as we explain in the review.
DOTA2 Streaming Tests – R5 2600X vs. i5-8600K
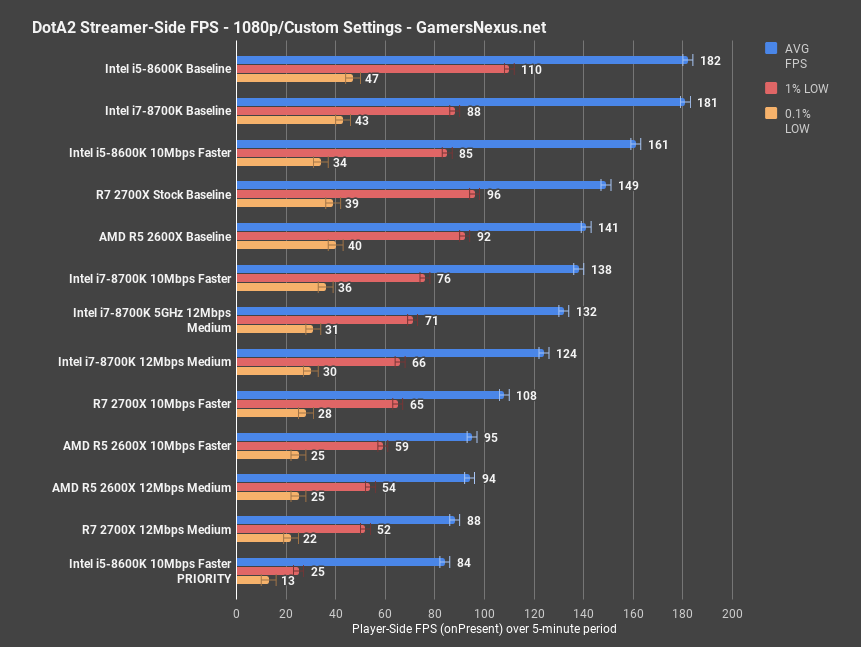
For DOTA2, streamer-side framerate positions the R5 2600X baseline at 141FPS AVG, led by the 8600K at 182FPS AVG. This isn’t uncommon for DOTA, which tends to favor frequency at least somewhat. On the face of it, Intel has a substantial lead – but again, we have to defer to the viewer experience chart.
Streaming on the 8600K doesn’t hurt our framerate too much, bringing us down 20FPS to 161FPS AVG.
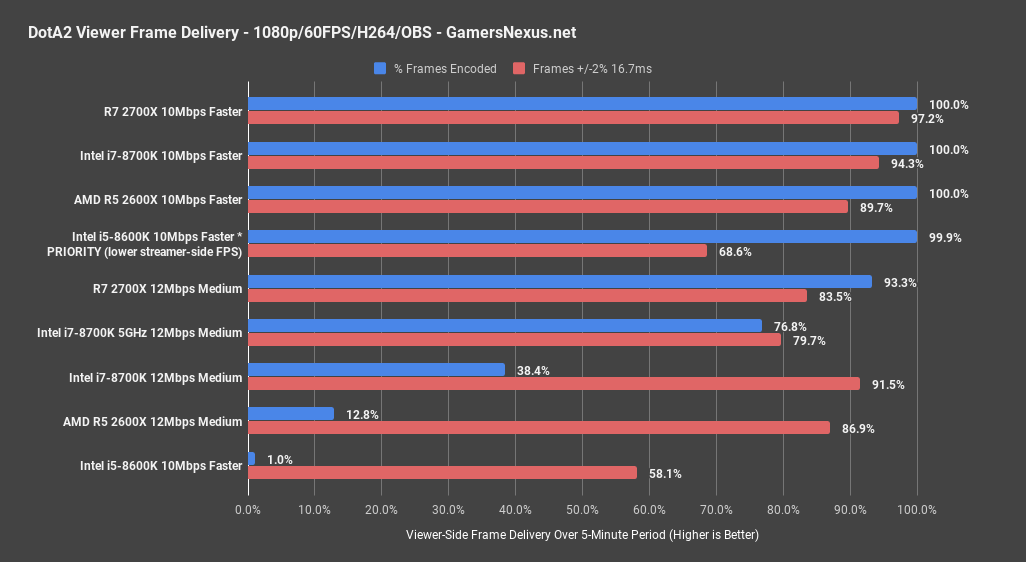
As for the viewer experience, here’s what it looks like when left completely untuned by the player. It’s not so good for the 8600K, as illustrated plainly here, even though the streamer is getting over 160FPS AVG during this time period. The viewers get one frame every now and then – 1FENAT, as we affectionally call it. It’s our new metric. 1FENAT is equal to one frame every now and then. The upshot is that, when it does eventually cough-up a frame, it’s 58% likely to be within a 16.7ms delivery window.
The R5 2600X at 10Mbps Faster doesn’t have these problems, and delivers 100% of its frames. It may sustain a lower streamer-side framerate, but the stream itself is perfectly delivered, outside of a 10% variance on frame delivery timing. AMD’s frequency deficit contributes to the lowering of its hard FPS, but its thread advantage is what grants the outright lead in streaming.
For what it’s worth, we did try setting OBS to high priority of the 8600K. It helped, but you’re entering territory where the player has to do more hands-on tweaking to force something to work. It’s a bit ironic, really, as this is the situation AMD was in just one year ago, with Ryzen’s messy lineup of launch BIOSes and motherboards. Now, AMD’s platform is relatively mature and stable, but Intel’s i5s require some help to pass the tests.
Blender CPU Benchmark – R5 2600X vs. i5-8600K, R5 2600
We’ll start this one with Ryzen’s strong point, like the 2700X video. If you missed the 2700X review, absolutely go watch it – the biggest improvement in Ryzen+ is its ability to hold a similar clock at a significantly lower voltage than Ryzen 1, which also aids in power consumption. That doesn’t apply as you get to 4.2GHz, of course, but really applies at 4.0GHz. We won’t recap that here. Check the other video.
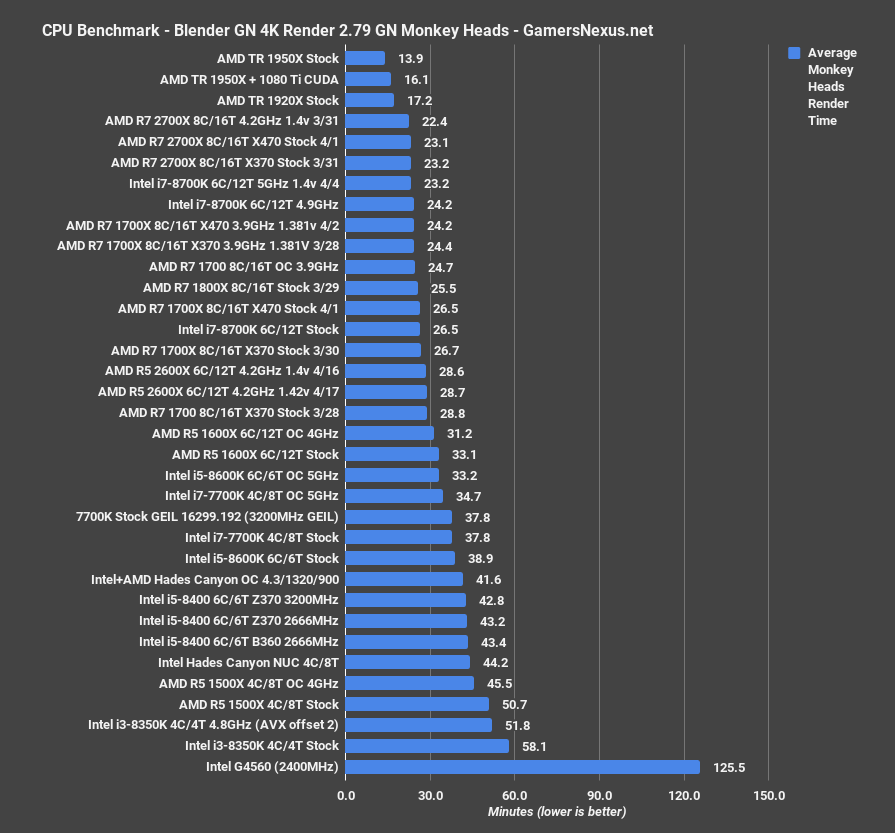
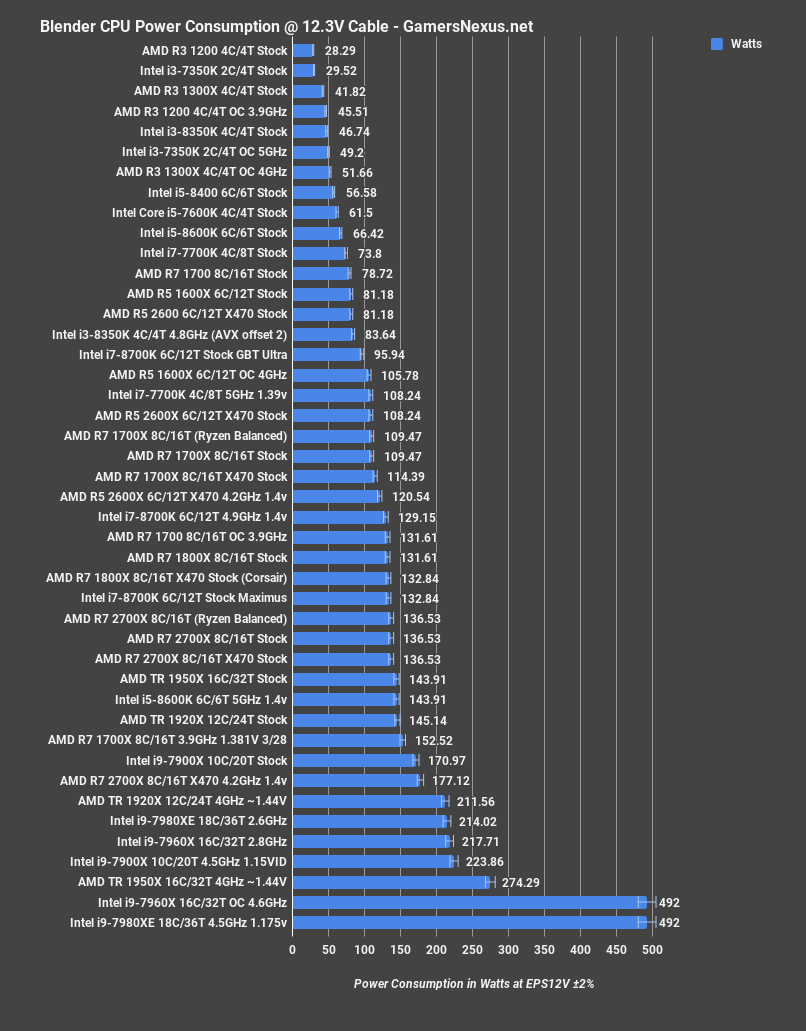
Anyway, starting with our in-house 3D rendering scenes that use Blender, we see the advantages of the R5 2600 and 2600X. The R5 2600X CPU completes the GN Monkey Head render in about 28-29 minutes, ranking it about 2 minutes behind the R7 1700X stock CPU. This is serious performance, considering the 1700X runs two additional cores – and that’s significant in the world of perfectly scaling render software.
Overclocking is, again, completely pointless here. XFR2 does the job for us, and we had no headroom to go to 4.3GHz.
![]()
For comparison, the 8600K at 5GHz barely manages to finish its render in 33 minutes, granting the 2600X a 13% time reduction. Not bad at all.
Perhaps more impressively, our GN Logo render applies a different type of load and stress to the CPUs, and allows an overclocked 2600X to surpass a stock 8700K, somewhat remarkably.
Continue to the next page for gaming benchmarks.
AMD R5 2600 & 2600X CPU Gaming Benchmarks
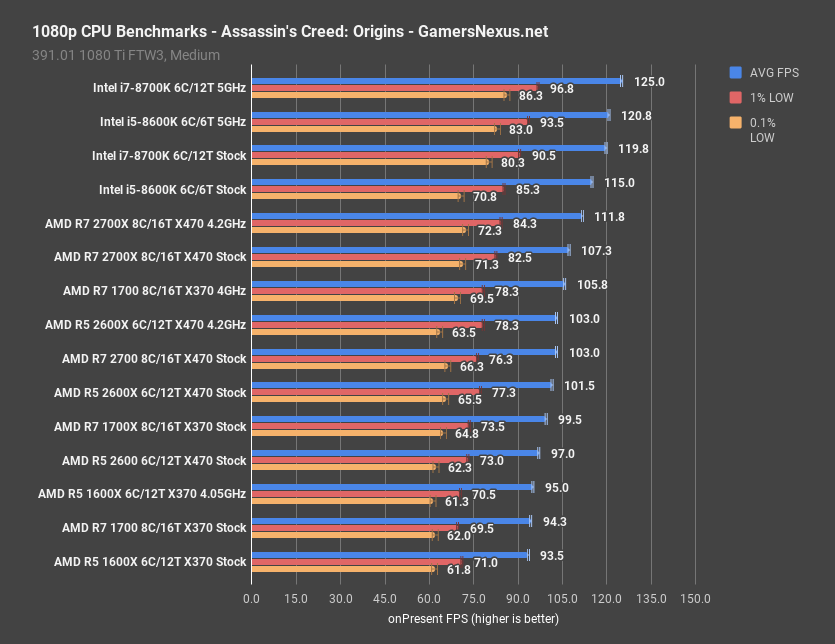
Assassin’s Creed: Origins Benchmark – R5 2600, 2600X, i5-8600K, 2700
Assassin’s Creed: Origins starts us off at 1080p. For this one, the R5 2600X stock CPU places at 102FPS AVG, with lows at 77FPS and 66FPS. These numbers are all reasonable, and scale from the stock 1600X – placing at 94FPS AVG – by about 8.6% from last year’s model. That’s with both stock. Overclocked, the 2600X at 4.2GHz pulls a lot more power and gains negligibly in the FPS department, at 103FPS – a 1.5% increase, and just outside of our error margins. The overclocked 1600X lands at 95FPS AVG, also gaining negligibly.
The R5 2600 non-X CPU, which operates a frequency of 3.4 to 3.9GHz, runs the test at 97FPS AVG, with lows about the same as every other Ryzen 5 CPU on the chart. Compared to the R7 2700X stock CPU, operating at 107FPS AVG, performance uplift versus the stock R5 2600X is about 5.7%.
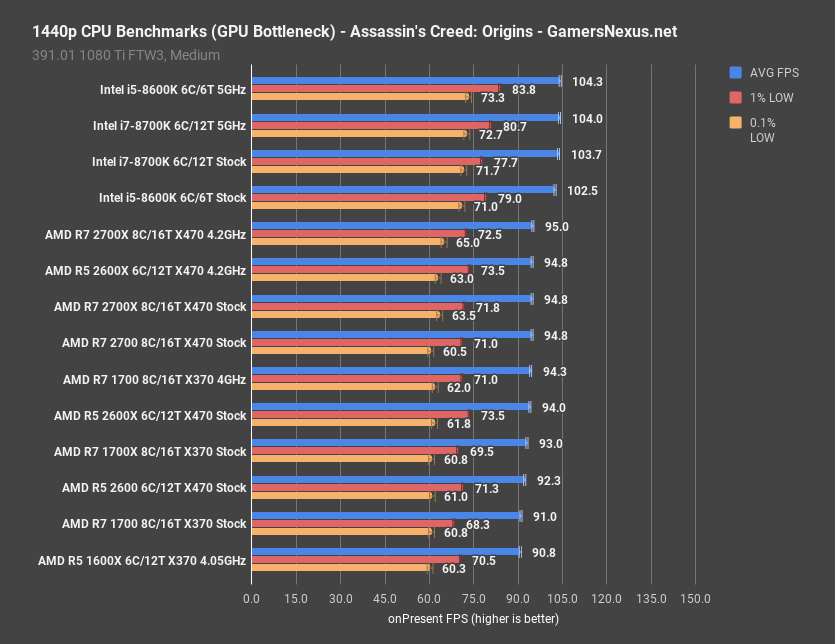
Of course, at 1440p, all of that equalizes. Like we demonstrated in our R7 2700X review, the differences primarily thin-down to just Intel and AMD, where we see about a 10% gap between them. Other than that, once we’re intra-architecture, there is functionally zero difference in a GPU-bound benchmark.
Watch Dogs 2 CPU Benchmark – R5 2600, 2600X, i5-8600K, 2700
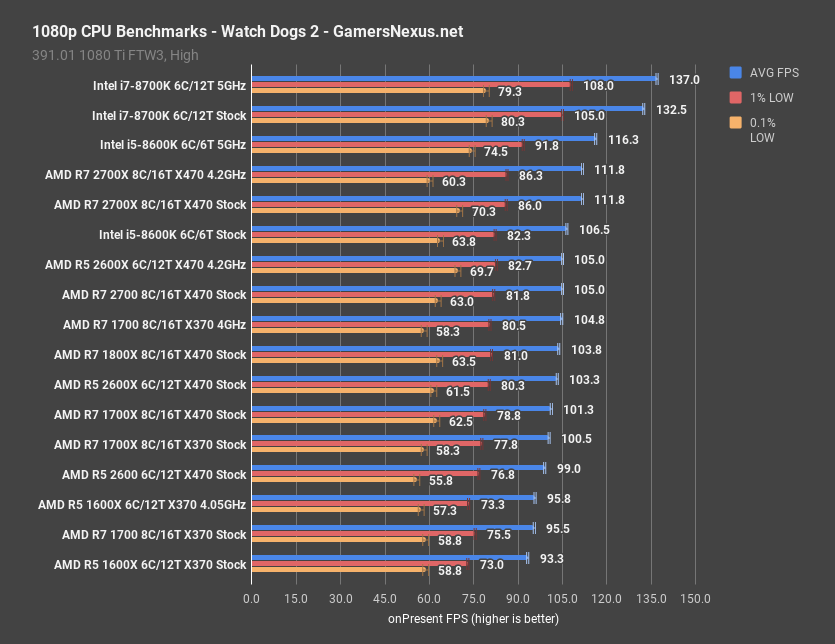
Moving on to Watch Dogs 2, we measured the R5 2600X stock CPU, using X470, as performing at 103FPS AVG, with GN’s founded 1% and 0.1% lows at 80FPS and 62FPS, respectively. Overclocking gets us an increase of 1.6%, and is entirely not worth it – a result of XFR2 being functionally as good as a manual OC when pushed against the limits of ambient cooling. The 2600 operates a couple percent behind the 2600X, as expected. The stock 1600X runs at around 93FPS AVG, allowing the stock 2600X an 11% lead before overclocking – but again, they can overclock to the same frequency, basically.
The competing i5-8600K outperforms the 2600X by about 3.1% when both are stock. Overclocking gets the 8600K up to 116FPS AVG, a lead of 10.7% over the overclocked 2600X at 4.2GHz, while also retaining higher 1% and 0.1% low frametime performance.
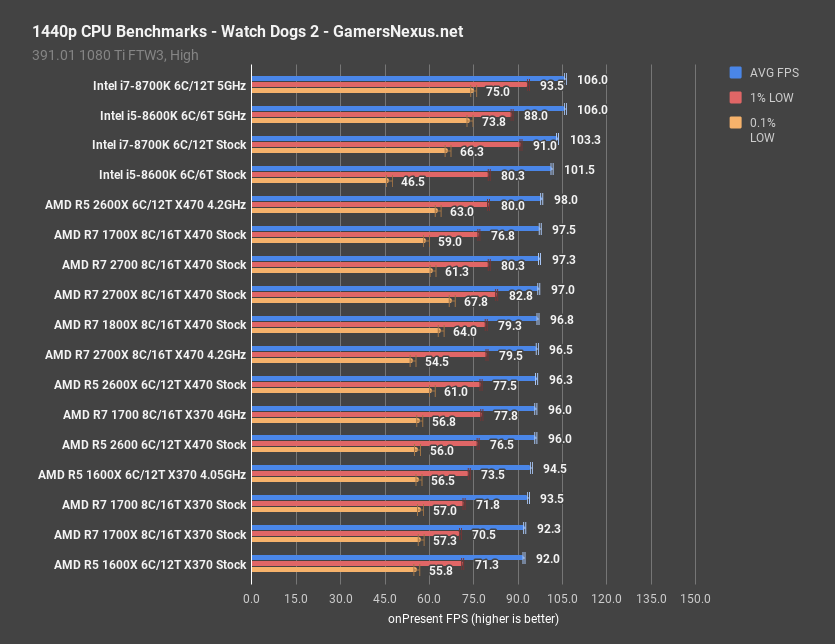
As expected, 1440p equalizes this to some extent. Just like in our 2700X review, the Intel processors retain a bit of a lead, but all the intra-arch CPUs remain close in performance.
Project Cars 2 Benchmark – R5 2600, 2600X, i5-8600K, 2700

Project Cars 2 at 1080p plants the 8600K 5GHz overclock right alongside the 5GHz 8700K, illustrating that Project Cars favors clock speed over nearly all else. This is further demonstrated other overclock scaling.
The 2600X stock CPU operates at 110FPS AVG, with an overclock granting all of 1FPS – within test variance, and functionally equal in performance. The 2600 operates at 106FPS AVG, granting the 2600X stock CPU a lead of 4%. This vanishes when overclocking the 2600, which is trivial. Compared to the 1600X stock CPU, the 2600X stock operates at 110 to 97.8FPS AVG, or a 12.7% lead generationally. The 2700X doesn’t offer much of an improvement in this department, with its efforts more noticeable under Blender or streaming applications.
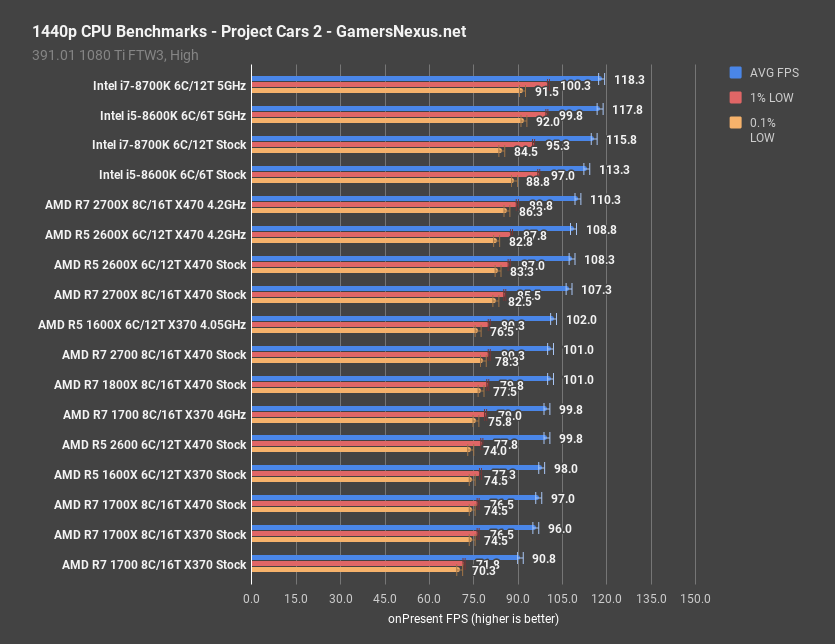
Cars at 1440p mostly just shows more of the same – scaling primarily vanishes between same-arch CPUs, with Intel holding a bit of a lead. Both are GPU-bottlenecked.
Ashes of the Singularity Benchmark – R5 2600X vs. 2600, 2700
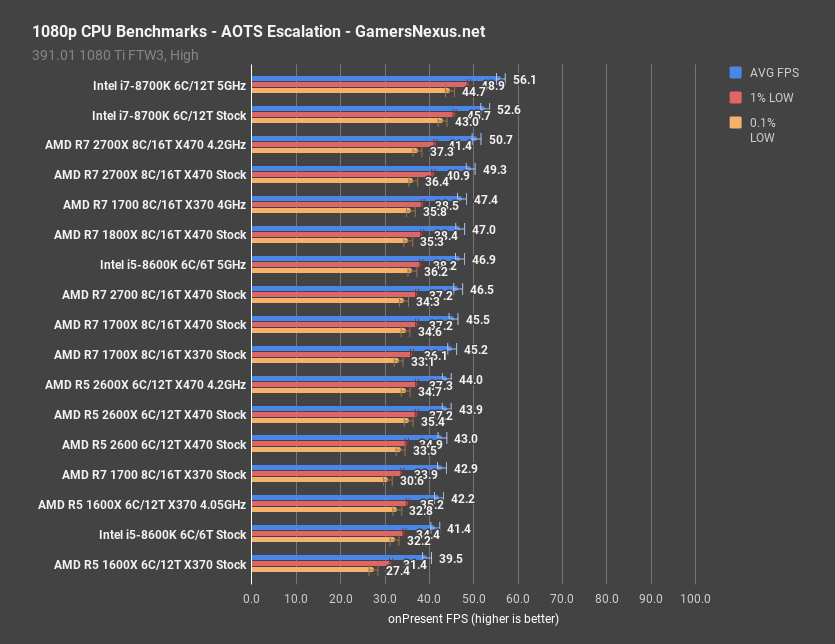
Conversely to Project Cars, Ashes of the Singularity can actually leverage additional cores – although it does like frequency, to some extent.
For this one, the i7-8700K at 5GHz leads the charts at 56FPS AVG, followed by the overclocked R7 2700X at 4.2GHz with 51FPS AVG. The overclocked 1700 isn’t far behind – illustrating why we’d suggest sticking with Ryzen 1, if you already have it – and the i5-8600K at 5GHz runs at 47FPS AVG, about equal to the stock R7 2700, and with frametimes also equivalent.
The 2600X stock CPU pushes 43.9FPS AVG, with an overclock providing nothing of value. The 2600 is a single digit behind, and can be overclocked to make up that ground. Finally, further down, the 8600K stock CPU operates at 41FPS AVG.
Similar scaling to what we’ve seen elsewhere.
Civilization VI CPU Benchmark – R5 2600 vs. 2600X, i5-8600K
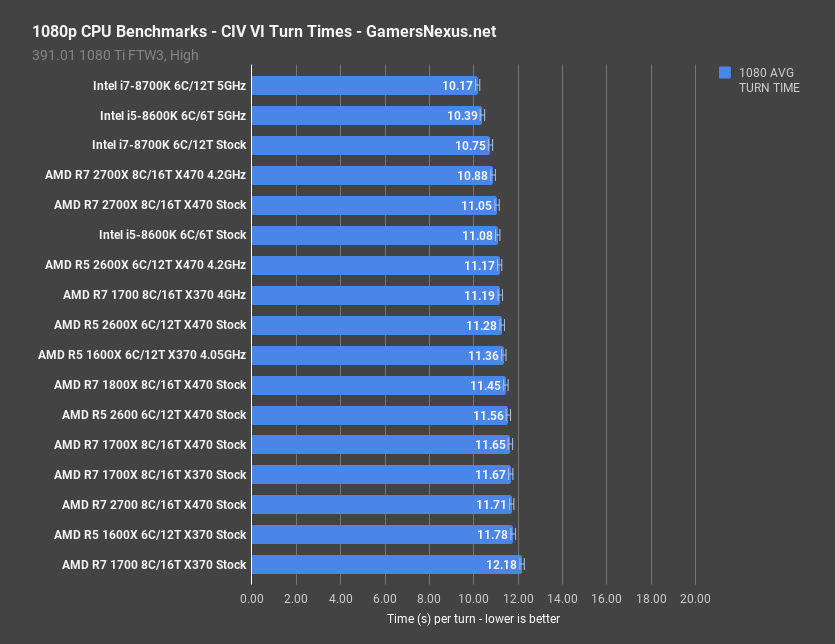
We test turn times for Civilization VI, but the game recently got a huge update that completely upended our previous testing. We have retested as a result. The 2700X stock CPU finishes each turn in 11.05 seconds, with all five turns taking about 55 seconds. Overclocking reduces the time requirement to 10.88 seconds, for a 1.5% time reduction. The 8700K stock CPU operates at 10.75 seconds – not a huge change – with the overclocked variant at 10.17 seconds, also not particularly game-changing. Civilization’s update has tightened turn times to a point of limited usefulness in benchmarking, although it is still a highly consistent and unique benchmark for the CPU. The 2600X performs similarly to the 8600K – and everything else, really. There’s not a lot of difference in these tests.
GTA V CPU Benchmark – R5 2600X, 1600X, 8600K

GTA V is our last one. At 1080p, GTA V posts the 8600K stock CPU at 136FPS AVG, with a significant performance uplift of 11% when overclocked to 5GHz. The 2600X at 116FPS AVG operates about 4.7% ahead of the 2600 non-X, and about 11.5% ahead of the original 1600X and its 104FPS AVG; granted, overclocking to 4.05GHz nearly ties that matchup.
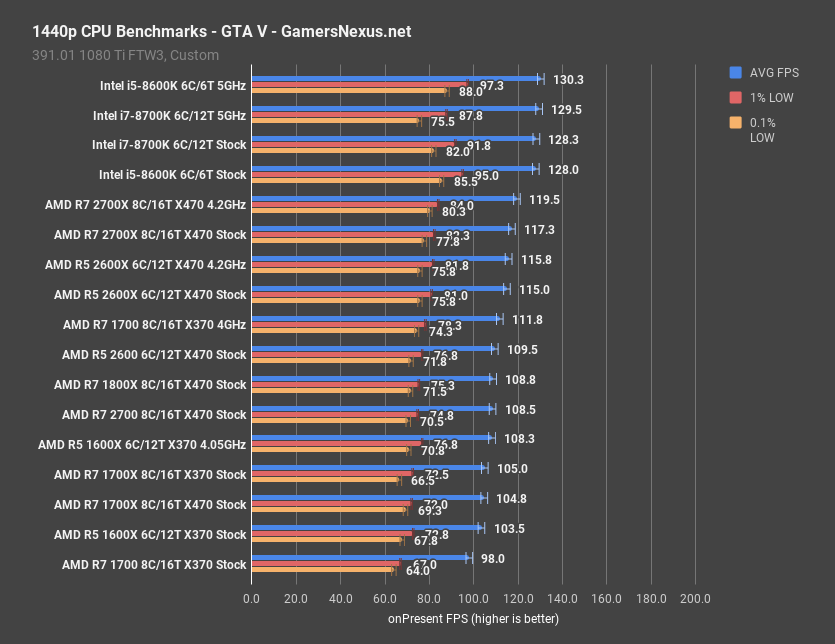
1440p demonstrates that we hit a GPU bottleneck at 130FPS AVG, with the overclocked 8600K and 8700K both within margin of error of one another. The 2600X runs close to where it did at 1080p – around 115FPS AVG.
AMD R5 2600 & 2600X Power Consumption
We measure power consumption as clamped at the EPS12V rails. We used the Gigabyte Gaming 7 X470 motherboard for Ryzen 2000 series CPUs – if you are curious about power capabilities and loss on behalf of the VRM, we have a video discussing and analyzing the Gaming 7’s PCB. This is not measured at the wall,
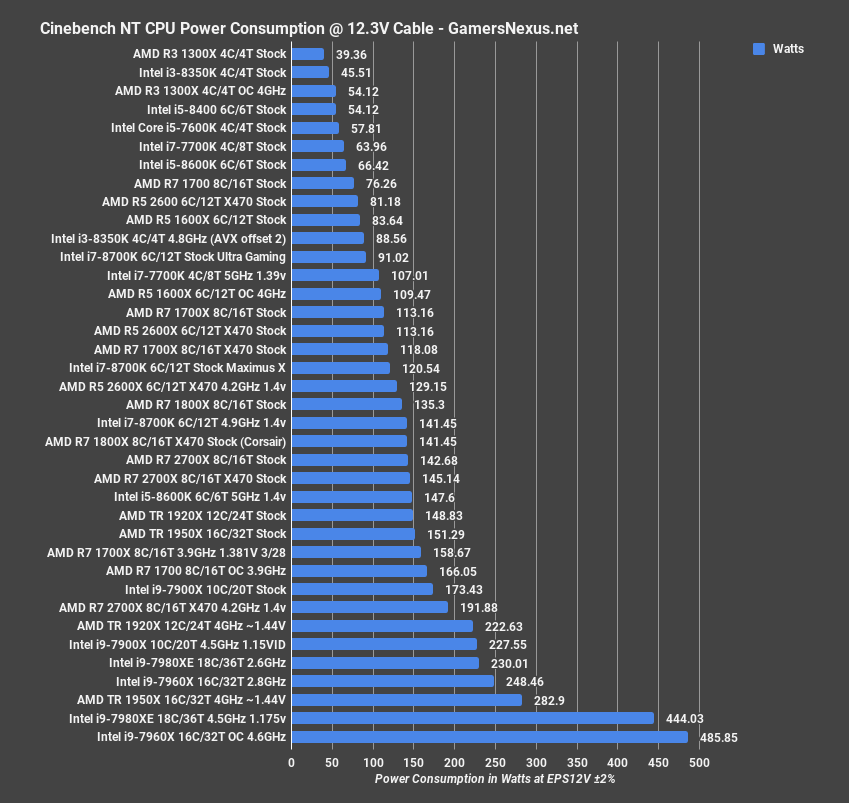
Power Consumption – R5 2600 & 2600X
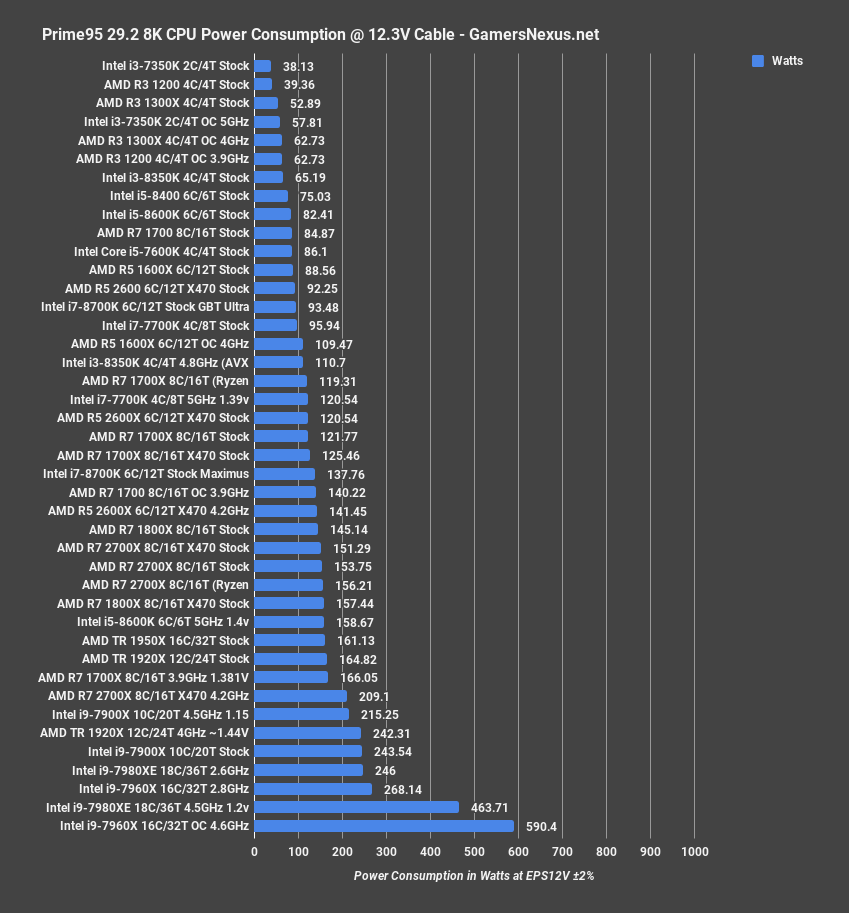
For power consumption, we plotted the R5 2600 non-X at 81W at the EPS12V rails for Cinebench multi-threaded, landing it between the 1600X stock and 1700 stock from the first generation. The 2600X draws about 113W at the rails in our test, with the 2600X overclocked at 130W – a completely unworthwhile endeavor, given XFR2. It’d be more worth it for the non-X. For frame of reference, the 2700X stock CPU measured 145W, or 192W when overclocked. This is largely because AMD and its board partners are blasting the 2700X with more voltage than necessary when stock.
Conclusion: AMD R5 2600X & 2600 vs. Intel i5
We’re getting to a point where Ryzen’s generational improvements, from a pure FPS and performance perspective, are going to look an awful lot like Intel’s. If you bought Ryzen 1, there’s really no reason to replace it with Ryzen 2. AMD’s improvements are primarily in unseen places to the end user, like the reduced minimum voltage at a given frequency, which we previously highlighted here. These are less flashy than gaining, say, 20% in framerate, so will undoubtedly be largely overlooked by the general userbase. Such improvements are critical, and we think AMD has done well to reduce voltage at a given frequency over first generation.
As for the rest, it’s rather lateral from Ryzen 1. If you already own a 1600X, don’t buy a 2600X to replace it. If you don’t own a current CPU, strongly consider a 2600X. The 2600 and 2600X get all the same accolades as the 1600 and 1600X did. They’re the same price, they perform a bit better, they reduce given-frequency voltage requirements, and they fit in the same boards. Where we’d previously recommend the R5 1600, we now recommend the R5 2600. It’s as simple as that.
The R5 2600(X) is an all-arounder CPU, and if it weren’t for Intel’s 6-core i5s, it’d be the only option. The 6-core i5s still have some viability, but AMD’s R5 line remains our go-to at the price point, in general, with Intel remaining the go-to at the $330 for gaming, or AMD at $330 for production/streaming-type applications (although the 8700K does well to compete there – better than the 8600K does to compete with the R5s).
Editorial, Host: Steve Burke
Testing: Patrick Lathan
Video: Andrew Coleman