We recently revamped our CPU benchmarking for significantly expanded workstation benchmarks, allowing us to better analyze CPU performance in non-gaming scenarios. Of course, this methodology update wouldn’t be complete without revisions to our gaming tests. These updates include more games, better testing in games where we’ve encountered GPU bottlenecks (that limit usefulness in CPU reviews), and improved accuracy of results. This takes the knowledgebase of what we’ve learned over the past year and builds upon shortcomings we’ve found.
With Ryzen 3000 CPUs just around the corner, likely announced at Computex next week, we have begun the process of preparing our test bench for the inevitable 3700X (or whatever they end up calling it). This means re-running CPUs through our testing until we repopulate the charts in time for Ryzen 3’s release, which is a process that we’ll begin publishing today.
GN CPU Testing Methodology for 2019
Starter CPUs
Our goal for this testing was to get a relatively wide sweep of CPUs tested so that we could find any potential shortcomings of the testing approach. For this reason, we have an eclectic mix of CPUs, but did put most of our emphasis on testing the R7 2700(X), i9-9900K, and R5/i7 CPUs, as we know these are the most interesting to our audience. Here’s the list of initial CPUs we tested, with more to be added as we go:
- AMD R5 2600
- AMD R5 2600X
- AMD R7 2700
- AMD R7 2700X
- AMD TR 2990WX (in most benchmarks)
- Intel i5-8600K
- Intel i7-8700K
- Intel i7-9700K
- Intel i9-9900K
Most of these CPUs were also overclocked for a second pass through the entire test suite. A full run on the test suite, including games (not featured today), takes approximately 8 hours per CPU, plus another ~8 hours for the overclocked variant. We try to keep them running relatively non-stop and around the clock when we’re working on CPU content.
We are still adding CPUs. This is a 'pilot episode' of our new gaming testing!
CPU Test Methodology
Our CPU testing methodology is split into two types of benchmarks: Games and workstation workloads, but every CPU which is sufficiently high-end will go through both sets of tests. We are beginning to spend more effort publicly documenting the exact versions of our tests, hoping that this is helpful to those reading our tests. We are also detailing more explicitly the unit of measurement in text, although our charts typically do this as well. Our workstation benchmarks include the following tests:
- 7-ZIP Compression benchmark (version 1806 x64). Unit of measurement: MIPS (millions of instructions per second; higher is better)
- 7-ZIP Decompression benchmark (version 1806 x64). Unit of measurement: MIPS (millions of instructions per second; higher is better)
- 7-ZIP dictionary size is 2^22, 2^23, 2^24, and 2^25 bytes, 4 passes and then averaged. Thread count equals the CPU thread count.
- Blender 2.79 GN Logo render (frame from GN intro animation, heavy on ray-tracing). Unit of measurement: Render time in minutes (lower is better)
- Blender 2.79 GN Monkey Heads render (CPU-targeted workload with mixed assets, transparencies, and effects). Unit of measurement: Render time in minutes (lower is better).
- GNU Compiler Collection (GCC) version 7.4.0, compiling 8.2.0 on Windows 10. Unit of measurement: Render time in minutes (lower is better). Run with Cygwin environment.
- Chaos Group V-Ray CPU Benchmark (1.0.8). Unit of measurement: Render time in minutes (lower is better)
- Cinebench R15 (used for internal validation). Unit of measurement: CB Marks (higher is better)
- TimeSpy Physics. Unit of measurement: 3DMark points & FPS (higher is better)
- Adobe Photoshop CC 2019 (Puget 18.10). Unit of measurement: Average score (higher is better)
- Adobe Premiere & AME CC 2019 (GN test suite: 1080p60 convention shot; H.264, 35Mbps, 5.2, High profile, AAC+Version 2, Audio 256K). Unit of measurement: Render time in AME (lower is better). CUDA enabled.
- Adobe Premiere & AME CC 2019 (GN test suite: 4K60 aroll+broll; H.264, 35Mbps, 5.2, High profile, AAC+Version 2, Audio 256K). Unit of measurement: Render time in AME (lower is better). CUDA enabled.
- Adobe Premiere & AME CC 2019 (GN test suite: 4K60 charts; H.264, 35Mbps, 5.2, High profile, AAC+Version 2, Audio 256K). Unit of measurement: Render time in AME (lower is better). CUDA enabled.
All tests are conducted multiple times for parity and then averaged, with outliers closely and manually inspected. The number of times tested depends on the application and its completion time. We use an internal peer review process where one technician runs tests, then the other reviews the results (applying basic logic) to ensure everything looks accurate. Any stand-out results are reported back to the test technician and rerun after investigation. Error margins are also defined in our chart bars to help illustrate the limitations of statistical relevance when analyzing result differences. These are determined by taking thousands of test results per benchmark and determining standard deviation for each individual test and product. Any product that has significant excursions from the mean deviation will be highlighted in its respective review.
GN CPU Test Bench 2019
| Product | Courtesy Of | |
| CPU | This is what we're testing! | GN, Intel, & AMD |
| Motherboard | See article, changes per CPU | Various |
| RAM | Corsair Vengeance LPX 4x8GB 16-18-18-36 | Corsair |
| Video Card | EVGA RTX 2080 Ti XC Ultra | EVGA |
| PSU | EVGA SuperNOVA T2 1600W | EVGA |
| CPU Cooler | NZXT Kraken X62 280mm | NZXT |
| SSD | Samsung 860 EVO 250GB | GN |
| Project/Game SSD | Samsung 860 PRO 1TB | GN |
Motherboards used are varied based upon platform. Where compatible, we used the following:
- ASUS Maximus XI Hero Z390
- ASUS Crosshair VII Hero X470
- MSI MEG X399 Creation
Although we’d all love to run numerous test benches simultaneously, we have determined that GPU silicon variance can significantly alter results even within the same video card model. As such, we only one run bench at a time, and we always use the same GPU. Driver version 417.71 is used. Adaptive sync is not used in testing.
MCE is always disabled on test platforms, ensuring that turbo boost durations should be running within specifications set by the CPU manufacturer. We also try to keep an eye out for other motherboard trickery, like MSI’s oft-boosted BCLK, and then reset to stock settings when applicable. XMP is used on the Corsair memory in our test benches.
Gaming CPU Benchmarks
Our gaming benchmarks use the following titles:
- Hitman 2
- Assassin’s Creed: Origins
- GTA V
- Total War: Warhammer 2 (Battle)
- Total War: Warhammer 2 (Campaign)
- Shadow of the Tomb Raider
- F1 2018
- Sid Meier’s Civilization VI
Most games are tested in both 1080p and 1440p. The point of this is to determine how much scaling matters once pushing more load to the GPU; in most instances, chart toppers will begin to bleed together and look the same as they hit GPU bottlenecks, illustrating where a CPU’s performance advantages may cease to benefit a particular card. In other instances, however, we can see that there are still noteworthy gains in higher-end CPUs. It just depends on the title.
The game quality settings are defined in each chart and section below, if curious about any of the quality choices made. A minimum of four test passes are completed for each title, if not more, and frametime measurements are logged for each run. We only insert frametime benchmarks for a few of the charts, normally when something interesting happens, and select on an article-to-article basis. Framerate results are inserted for each of these games as well, except in instances where we may need to temporarily remove a chart from the cycle as a result of game updates. Each game is kept on a specific version as long as possible, but some of the more online-centric games do force updates. For these, we do our best to validate if performance has changed. If we detect a change, we make a note to rerun as many CPUs as realistically feasible before the next CPU benchmarking article.
Total War: Warhammer 2 Battle
The TWW2 battle benchmark is basically the same thing as the TWW1 test we ran in our previous methodology, just using a different scene and with different armies. The same problems with inconsistent 1% and 0.1% lows from the first Total Warhammer game affect this one, but the overall FPS averages are still relatively reliable. The “high” preset is still used.
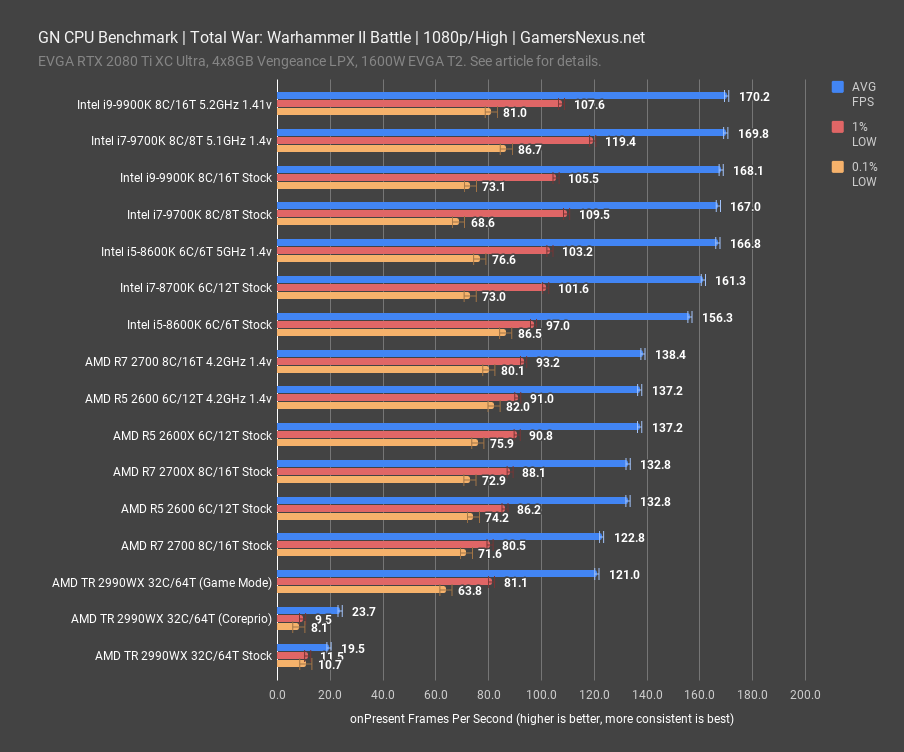
As with all the other games so far, the overclocked 9900K is the top scorer, with the slightly lower-clocked 9700K trailing by an insignificant margin. Average FPS of the 5.1GHz overclocked 9700K is only 3 FPS beyond that of the 5.0GHz overclocked 6 core/ 6 thread 8600K, implying that here again is a game that doesn’t much benefit from more than 6 threads, and instead becomes more focused on higher frequencies. This is the first game so far that strongly benefits from the 2990WX’s game mode, which brings the FPS average up from 19.5 to 121. That’s still worse than the other CPUs we’ve tested, but at least it’s not broken. Coreprio appears to slightly raise performance as well, but nowhere near as much as simply turning off cores with game mode.
Here's where it gets interesting: If you’re looking at the stock R5 2600 non-X result of 133FPS AVG versus the stock R7 2700 result of 123FPS AVG, you might wonder about why that happened. We already know that this game likes frequency more than threads, and so we can take that and expand with another chart:
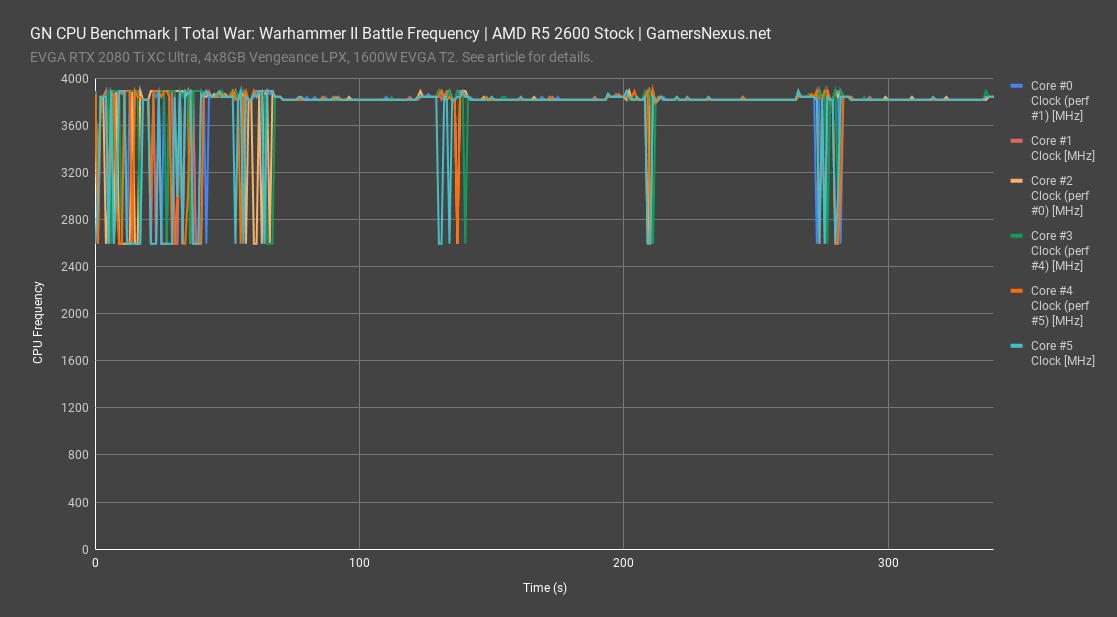
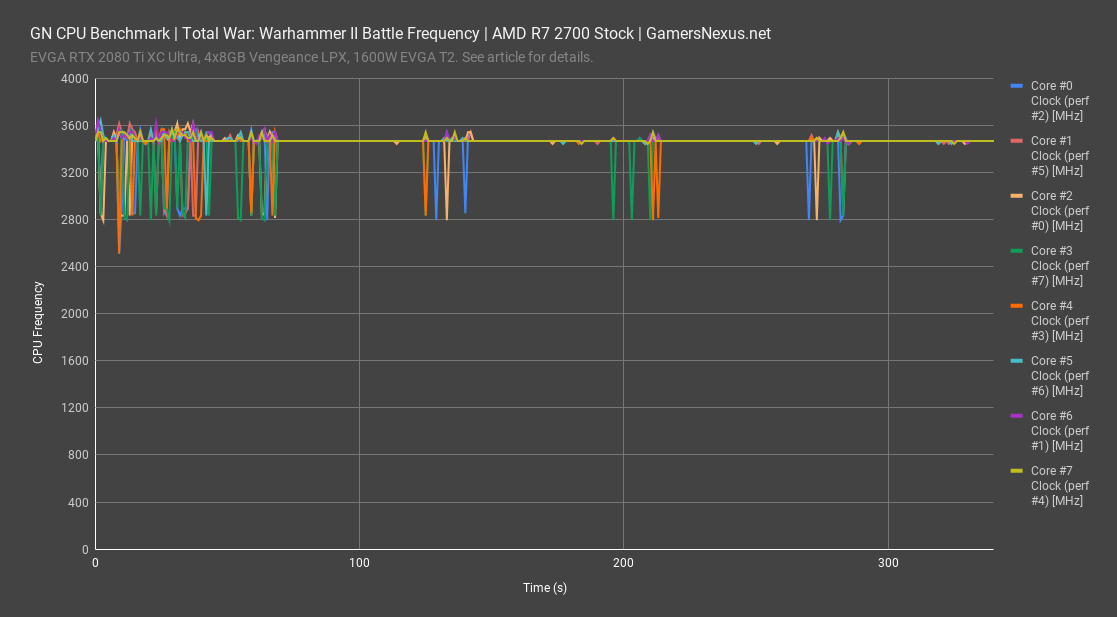
In this chart, we ran the test on the R5 2600 versus the R7 2700, both stock, and logged the frequency on each core during the test. As illustrated by the chart, the R5 2600 maintains a much higher frequency of 3816 to 3850MHz all-core, something we can see as plotted against all 6 core clocks in this chart. The R7 2700 runs closer to 3467MHz all-core. Although we like recommending the R7 2700 non-X, it’s normally under the stipulation of a user-applied overclock. There’s still a lot of all-core headroom to gain here, but this illustrates exactly why the R7 2700 gets outmatched by the cheaper R5 2600 in frequency-bound titles.
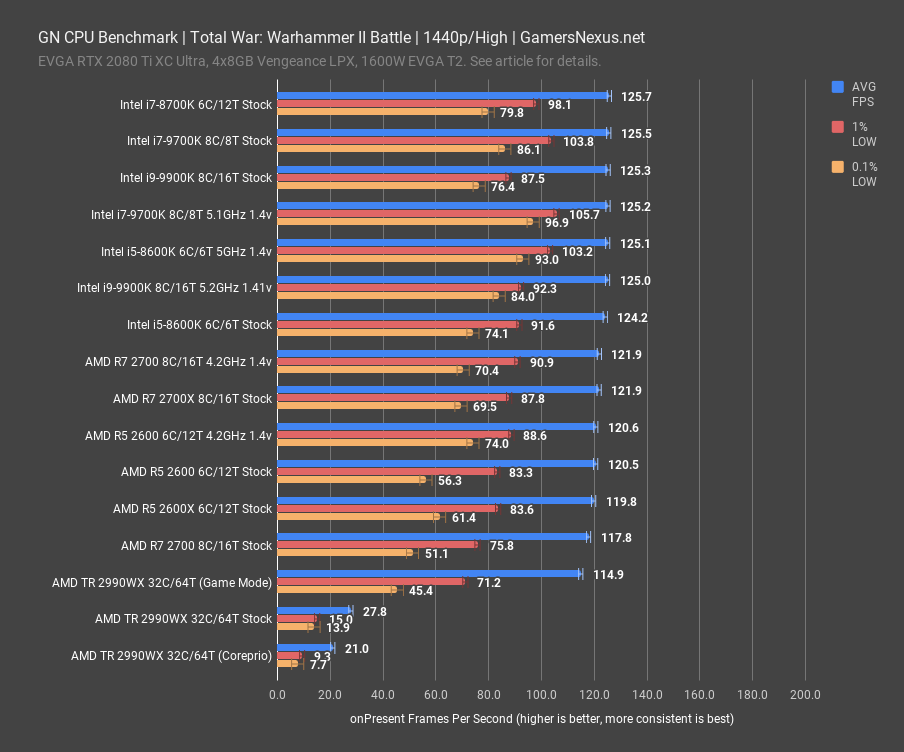
FPS lowered for every CPU tested when the resolution was raised, so we’re encountering GPU bottlenecking at 1440p. This is sort of the point of the 1440p test, though, as it illustrates a degree of realism that can sometimes be lost at 1080p. If you were to run these graphics settings on a 2080 Ti with this game, the choice between an 8700K, 9700K, 9900K, or really anything above the $5 2600 at 4.2GHz would be largely irrelevant. They’re all about the same. The top half of results – that’d be the i5-8600K through the i7-8700K – are all within margin of error. If you’re confused why the 8700K is “better” than the 9900K, don’t be – it’s not, it’s just that the results are within error margins and test variance, and so we can neither distinguish nor realize the actual differences between these processors. There are some differences in 0.1% and 1% low values, illustrated primarily in the overclocked 9900K, 9700K, and 8600K, but that’s about the only difference. These are all beyond the cutoff for GPU bottlenecking, but below that level there’s still some differentiation between the CPUs. The 4.2GHz 2700 and stock 2700X are neck-and-neck, again proving the value of AMD’s non-X CPU. The stock 2600 and 2600X are almost tied, but the 2600X does have slightly better 1% lows. The 1440p doesn’t provide much value beyond reminding us that GPU limitations can limit CPU differentiation when playing at higher settings.
Total War: Warhammer 2 (campaign)
The baked-in TWW2 campaign benchmark is much more CPU-bound than the battle benchmark, which is a good thing given the obvious GPU limitations of the 1440p battle benchmark.
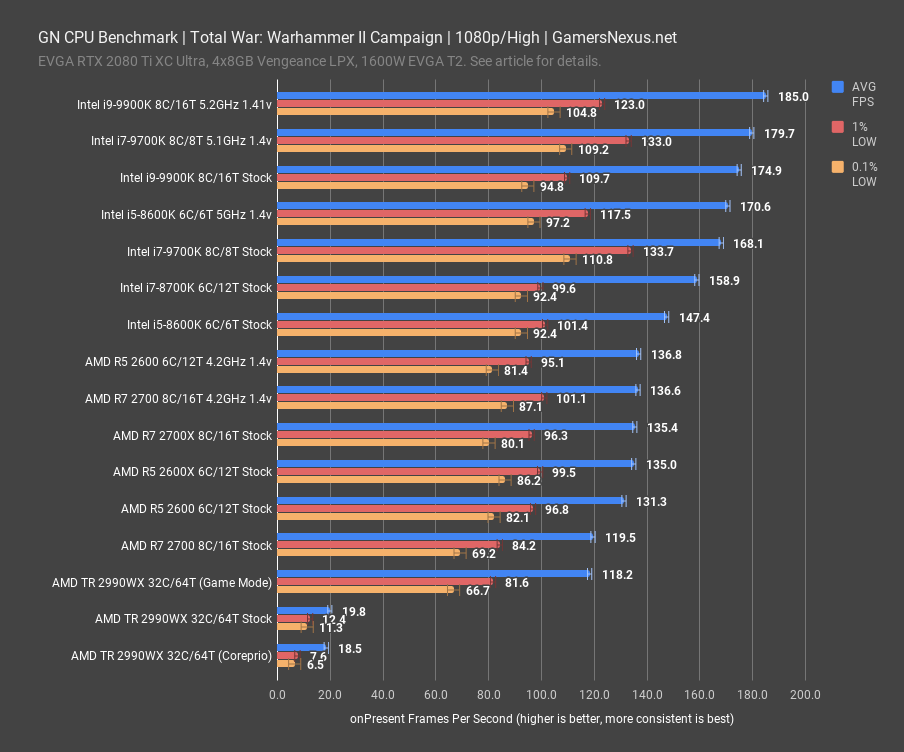
The overclocked 9900K and 9700K lead here as well, which makes sense. The results should (and do) line-up nearly the same as they do in the battle benchmark, but with more differentiation at the high-end. Overclocking the 9900K to 5.2GHz gives it a boost of about 6% over the stock 9900K, with the 9700K OC receiving a boost of 7%. Frametimes are reasonable across most of the chart, although there’s still some natural run-to-run variance that builds a bigger error bar in the 0.1% low category.
As for other rankings, the 8600K at 5GHz surpasses the stock 9700K and stock 8700K, which is a clear illustration that Total War: Warhammer is still heavily dependent upon frequency of each part. This is further illustrated with the differentiation between the R7 2700X stock CPU, plotting 135FPS AVG, and the R5 2600X stock CPU, plotting 135FPS AVG. The extra cores don’t matter much here, but the frequency ties things up.
The 2990WX does terribly here, predictably, as the game doesn’t quite understand what to do with the threads and scheduling gets screwy and memory latency causes delays. Coreprio doesn’t fix anything, either, but restarting into game mode to disable half the cores does boost the 2990WX to R7 2700 levels of performance.
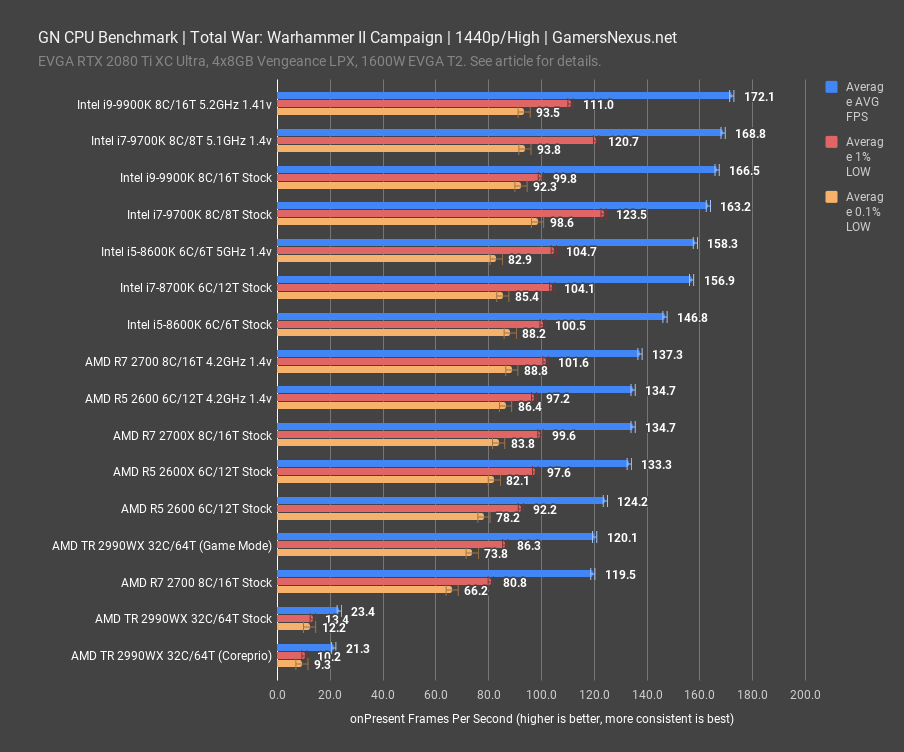
Unlike the battle benchmark, the campaign benchmark at 1440p shows some scaling right up to the overclocked 9900K and 9700K, where we do start to see some clipping off of the high end. The higher-scoring CPUs do have lower averages than they did at 1080p, though, so they are approaching a GPU limit. A lot of Ryzen results are within margin of error, like the 2600 at 4.2GHz, the 2700X stock, and the 2600X stock.
F1 2018
F1 is another returning title, with the methodology unchanged from the last round except for newer drivers and a newer version of Windows, the latter of which has more impact. The framerates at both 1080p and 1440p are far beyond the 144Hz limit that anyone might be trying to achieve, but they’re still mostly CPU-limited, so it’s a good test of relative performance.
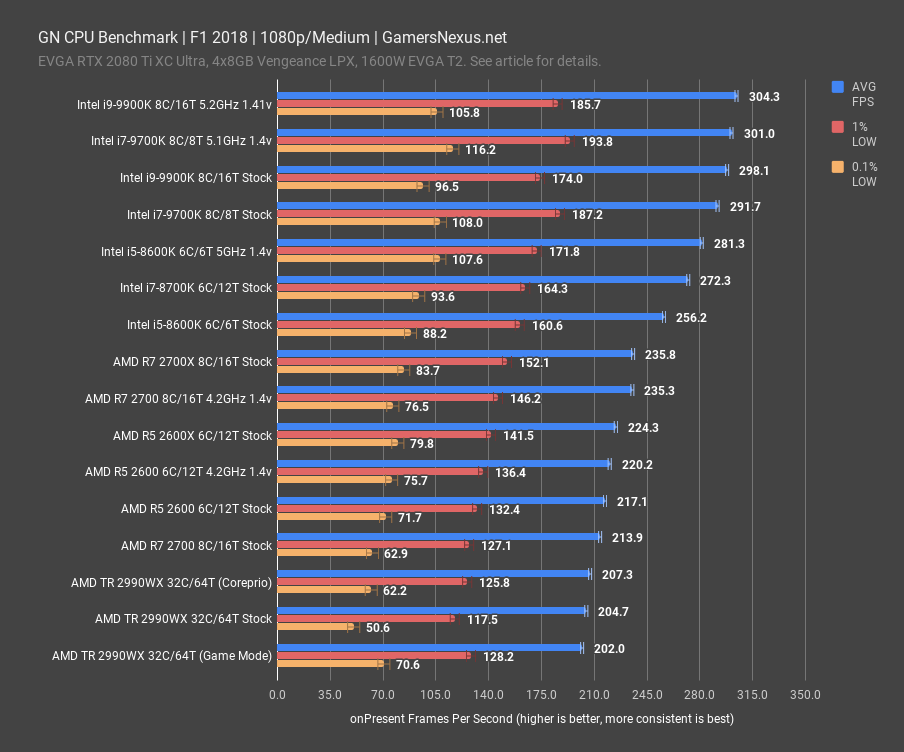
The overclocked 9900K and 9700K lead at over 300FPS average, with their stock scores following right behind. The 9900K stock and 9700K OC results are roughly within margin of error of each other, and are outside of our test resolution. As it is now, the chart has a clean Intel/AMD split with the typically higher frequency Intel parts at the top and the typically higher thread-count AMD parts at the bottom. The R7 2700X runs at about 236FPS AVG, ranking it as functionally equal to the overclocked 2700 at 4.2GHz – no surprise, as they’re about the same frequency here. The R5 2600X stock CPU ends up at 224FPS AVG, allowing the overclocked 2700 a lead of about 5%. It’s clear that Intel is enabling higher overall framerate here with its high-end parts, albeit more expensive on average, but we are entering territory where the question of practical and theoretical differences emerge. The relatively low frequency 2990WX performed worst of all, behind the stock 2600 and 2700, but this is expected for the Threadripper parts in gaming scenarios. The 2600 and 2700 end up in the same order as Total War: Warhammer, which is a result of the higher frequency on the stock 2600 when under all-core workloads.
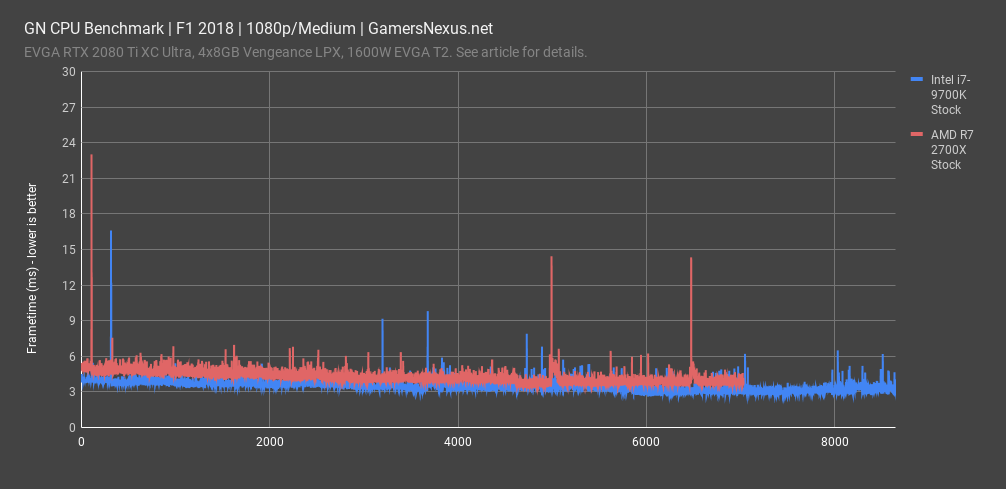
Let’s look at a frametime plot to better illustrate the differences. As a reminder, frametime plots give an up-close look at frame-to-frame creation time, showing how many milliseconds it takes to draw each frame to screen. This is an important metric that can get obfuscated with average framerates, even 1% lows, and helps illustrate consistency of frame delivery. The 9700K and 2700X both encounter occasional hiccups beyond 12ms, but these are rare and unnoticeable in single-frame doses. The user would not notice these. The 23ms spike is getting more noticeable, but the excursions to 9-12ms don’t become particularly noticeable unless several spikes happen in sequence. Overall, both of these CPUs handle the game with fluidity.
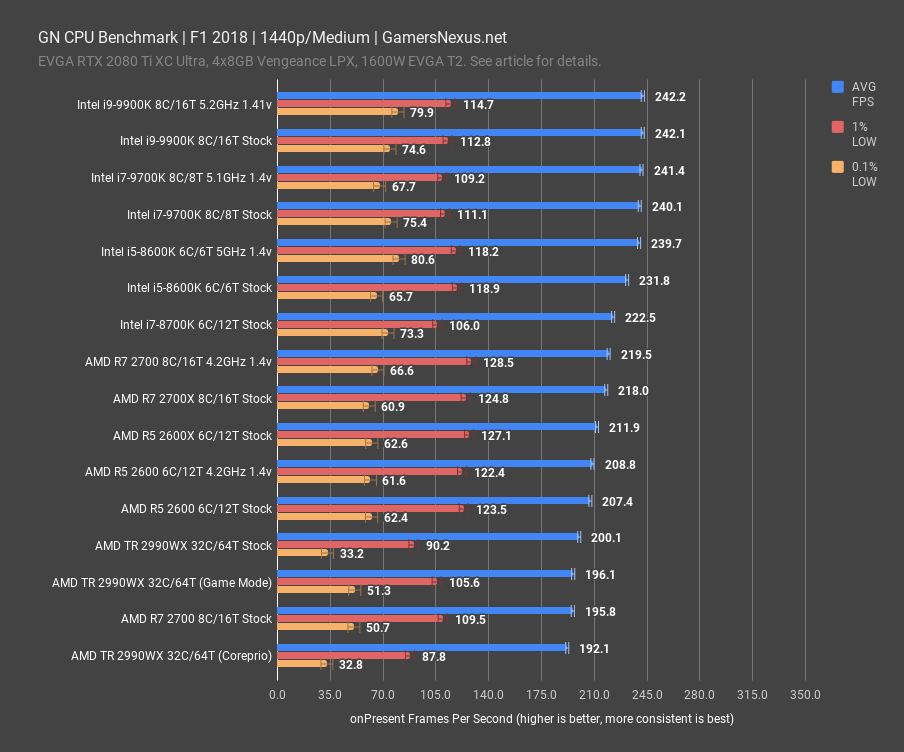
Going to 1440p, the increased resolution knocks the peaks off of the framerates with some GPU limitation, but only the 9700K, 9900K, and overclocked 8600K have reached the level where noticeable CPU scaling stops. The R7 2700 at 4.2GHz and 2700X are within error of one another and also not too distant from the stock 8700K, which is otherwise leading the pack of CPUs that are only occasionally hitting GPU limitations. The R7 2700 stock CPU doesn’t look great here, comparatively, but keep in mind that we’re still at about 200FPS in this title. The point though is that it is limiting a 2080 Ti at 1440p, although this bottleneck should further diminish as resolution increases. The 2700 deserves an overclock, as we’ve always said, as its performance climbs notably to 220FPS AVG when pushed to 4.2GHz all-core.
Assassin’s Creed: Origins
ACO is our most troublesome benchmark because of occasional stuttering that we have to correct for with extra bench passes, but it’s a good example of a game that responds strongly to overclocking, similar in behavior to Hitman 2. Settings remain at the medium preset, unchanged from previous testing.
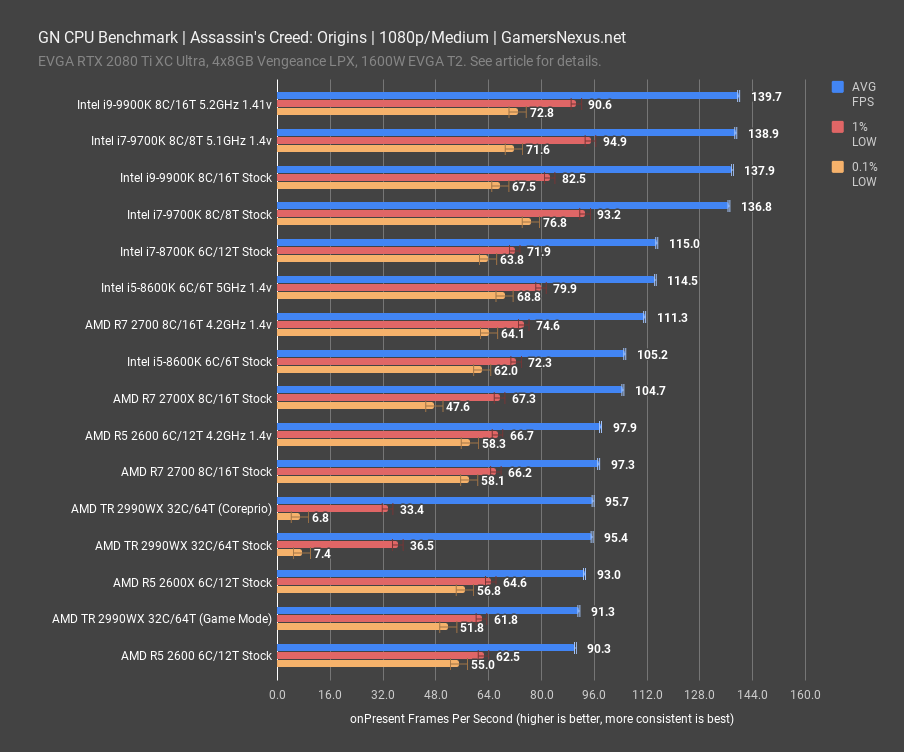
The top 4 CPUs are nearly tied at 1080p, approaching a definite GPU bottleneck and making this one of the games we’ll need to replace or revamp for our next round of testing. Still, the OC 9900K and 9700K hold a slight performance lead over stock. The 8700K stock is tied with the 8600K clocked to 5GHz, so we can say that Origins seems to benefit from higher thread-counts. Interestingly, the 2990WX results confirm this: even though the game suffered from hitching to the point of being unplayable, average FPS was slightly higher at stock than it was in game mode, even though game mode didn’t have stuttering pulling the average down. This is also a study in why we test with 1% lows, 0.1% lows, and frametime plots, because these deficits in Threadripper’s creator mode would not be shown if only looking at average FPS. In last place was the stock R5 2600, which performed much better with a 4.2GHz overclock, and again further confirms that threads are helping here – otherwise, it’d be faster than the stock R7 2700.
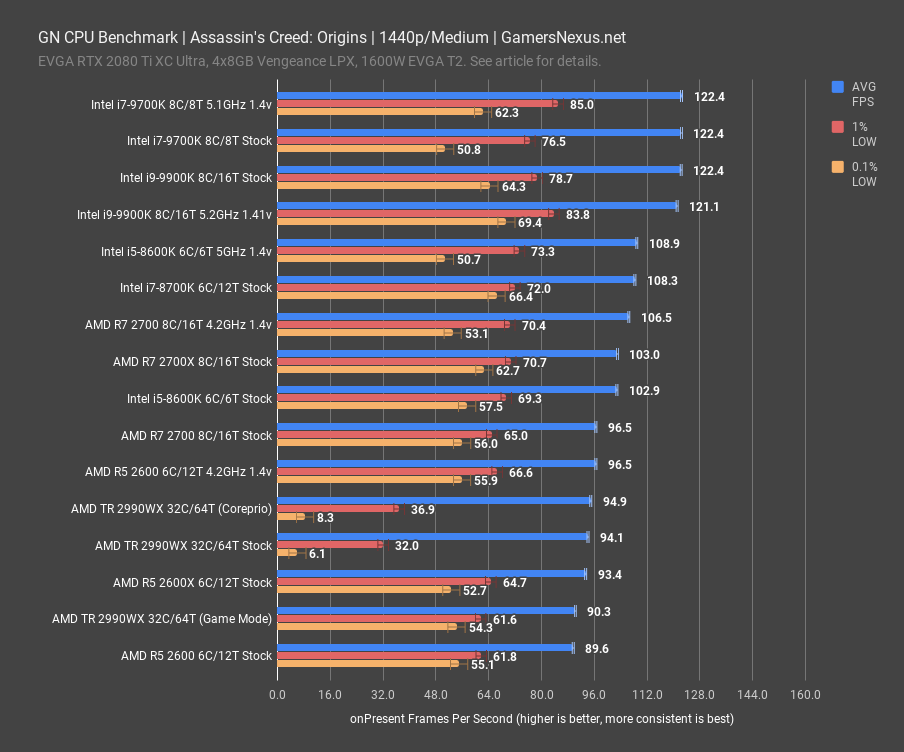
Raising the resolution makes the GPU bottleneck more prevalent, but there’s enough fluctuation in framerate during the test that it’s still really only the top 4 CPUs that have hit the wall. The 9700K and 9900K have a 1 FPS range between them, which is well within test variance for this title. The 8700K and overclocked 8600K have swapped leads but remain nearly tied, as have the 2700 stock and overclocked 2600, and the rest of the stack is ordered the same as it was at 1080. The same hitching issues plague the 2990WX unless game mode is enabled, which again slightly lowers the average FPS.
GTA V
GTA V returns with almost identical settings to our previous tests, but with high detail streaming while flying enabled and extended distance scaling maxed out. The segment of the built-in benchmark that we logged for testing was too often hitting the 187.5FPS engine limit on modern CPUs, and these tweaks are intended to make it more stressful by increasing draw calls that the CPU has to juggle for increased geometry drawing. GTA V is the oldest game we use for CPU testing by a longshot, and at some point it will need to be phased-out.
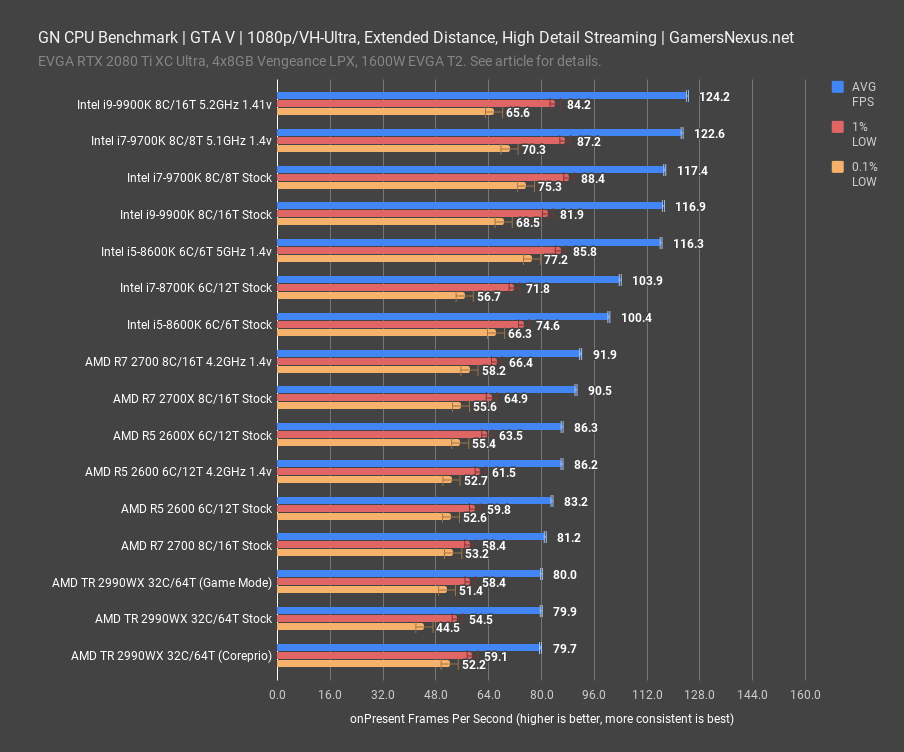
The overclocked 5.2GHz 9900K predictably leads the way, trailed just slightly by the 5.1GHz 9700K--again, there’s no tangible benefit from having more than 8 threads here. In fact, given how close the stock 8600K and 8700K scores are, it’s unlikely that there’s much benefit from having more than 6. As we fill-out the chart with older 4- and 6-thread CPUs, the answer will become clearer. The 2700 trails at roughly the same level as the 2990WX, which doesn’t significantly benefit from game mode or Coreprio outside of potentially more stable 0.1% lows. Other than that, Amdahl’s Law applies and GTA V favors frequency, with threads preferred only to a point. There’s a clear division in this chart between Intel and AMD, with AMD falling universally below 100FPS AVG. We saw this in our last round of GTA V tests as well, despite lighter settings, and so can illustrate gaming advantages in Intel CPUs for this benchmark – sometimes to the tune of 20% uplift. As for the 9700K stock and 9900K stock, we’ll again remind you that these results are within margin of error.
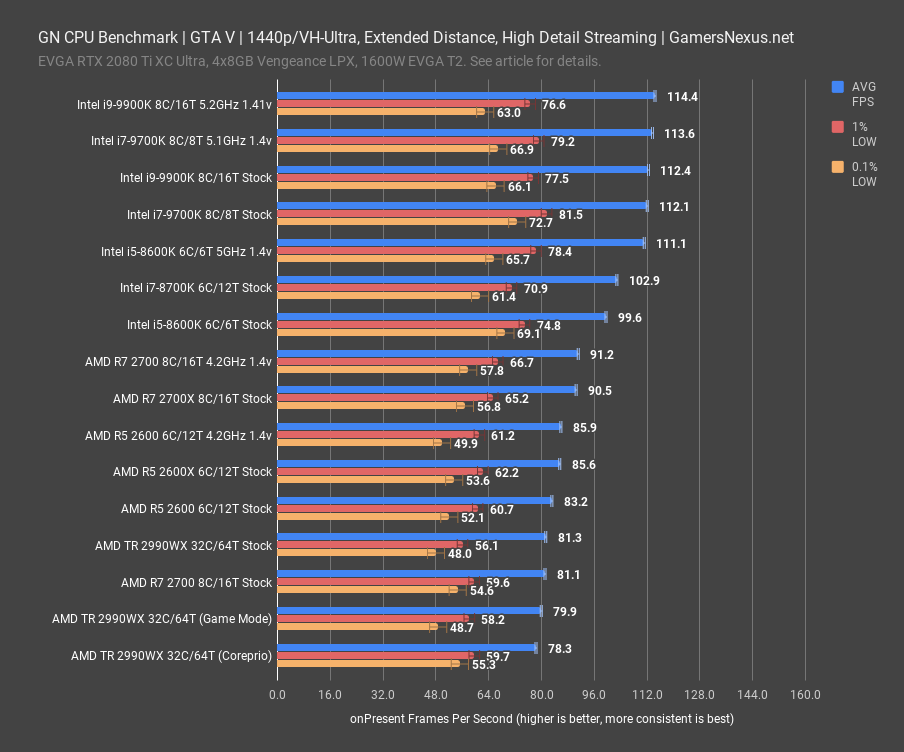
At 1440p, GPU limitations keep results at the high-end of the chart squished closer together. Note that, for the lower-performing CPUs, the scores are practically unchanged at either resolution, while the 9900K OC drops fully 10 FPS due to the partial GPU bottleneck. The stock 9900K and 9700K have technically swapped places on the chart, but the two stock CPUs perform essentially identically to each other at both 1080p and 1440p, and remain within error margins. The 2600X and 2600 are also close to one another here. The 0.1% lows of the 2990WX are again slightly worse at stock than they are with coreprio.
Shadow of the Tomb Raider
Shadow of the Tomb Raider gives us a little DirectX 12 representation. The medium preset is used.
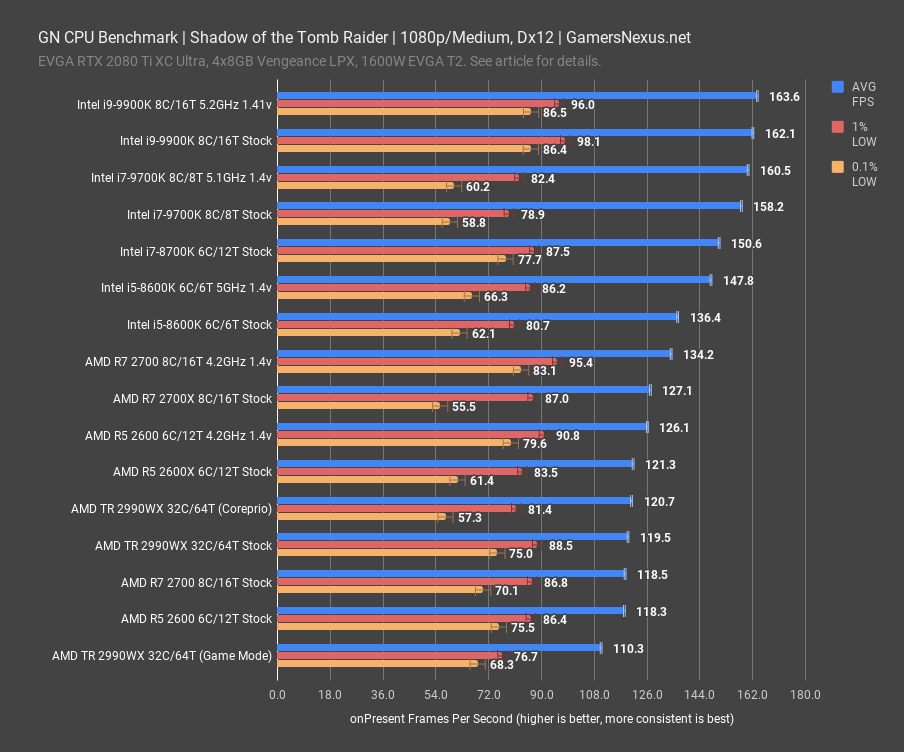
The 1080 results show a decent balance between threadcount and frequency being the deciding factor of performance. The overclocked 9900K still tops the chart, but the stock and Coreprio-enabled 2990WX results are significantly higher than the game mode result and, for once, the 2990WX exceeds both the stock 2700 and 2600 in performance. The 6C/6T 8600K places fairly high, but the 4.2GHz 2700 scored better than the 4.2GHz 2600, again confirming that Shadow of the Tomb Raider is benefitting from thread counts at least as high as 16. The 9700K stock CPU ends up about 24% higher in framerate than the R7 2700X, for point of reference.
As for 1440p, we cut that test from this batch. We discovered that it was GPU-bound almost all the way down the stack, and so there’s no value in illustrating the same number 15 different times.
Sid Meier’s Civilization VI
Civilization VI updated and replaced its AI benchmark in the middle of redoing our CPU tests, so we have fewer results for this title as of right now. The new test is still four passes with five turns per pass, but each turn is significantly longer and should magnify the differences between CPUs.
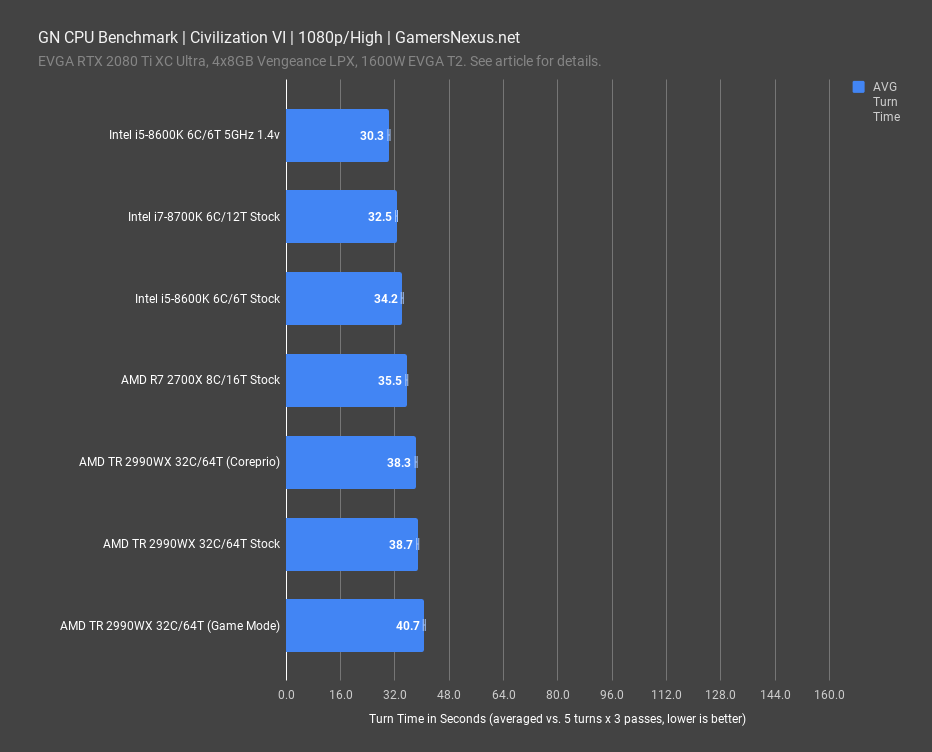
As CPU intensive as it is, the AI benchmark doesn’t make great use of higher thread counts. This game, like many others, likes frequency. The stock 2990WX resolves turns faster than it did in game mode, but not by much. The only overclocked CPU we’ve run Civilization on so far is the 8600K, since we had to throw out our original set of data, and the increase in frequency allowed it to surpass the other 12-, 16-, and 64-thread CPUs. At 30 seconds to complete a turn, a full pass with 5 AI players would take 2.5 minutes. That starts getting noticeable, so the slow-down from the 8600K to the 2700X’s 36-second turn time becomes noticeable. That’s another 30 seconds you’d be waiting for your next turn. We’ll revisit this test and add more as we go, as Civ VI updates enough that it wipes all of our data at least once a year.
Hitman 2
We use the Miami bench scene for Hitman 2. The important settings for CPU testing are max LOD and max simulation quality--even with relatively high GPU-related settings, CPUs have remained the bottleneck in our testing so far.
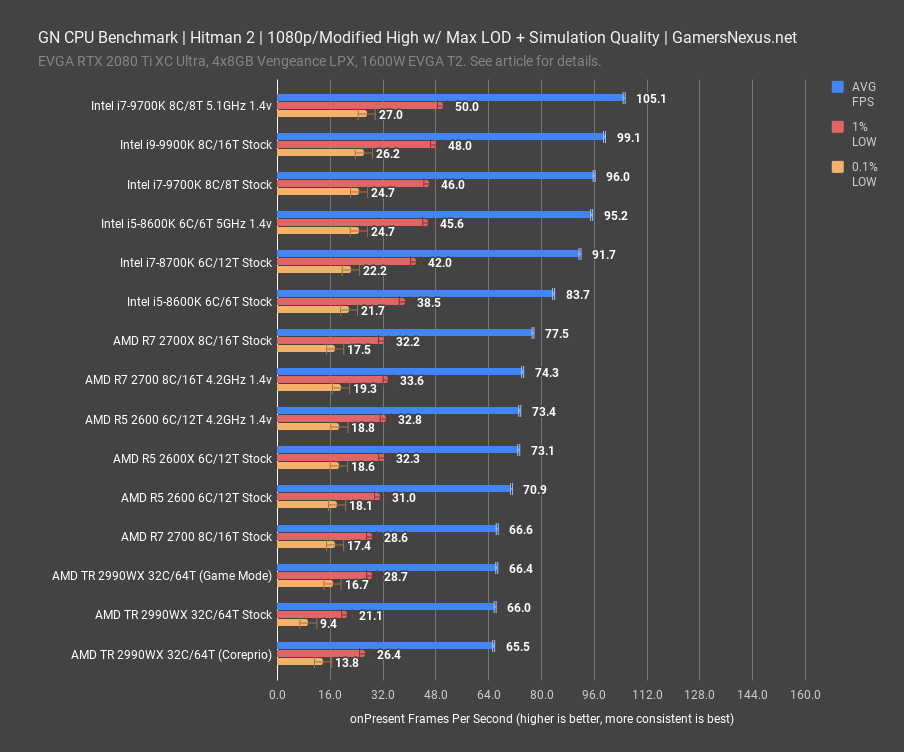
The overclocked 5.1GHz 9700K leads the pack, although we need to run the 9900K OC through here. It’s clear from the other results (2600 OC vs 2700 OC) that this title doesn’t benefit much from threadcounts greater than 8. The lowest-scoring gaming CPU was the R7 2700, thanks to its lower all-core frequency than the R5 2600, while the 2990WX scored lowest of all, with no significant difference from either switching to game mode or running the Coreprio service.
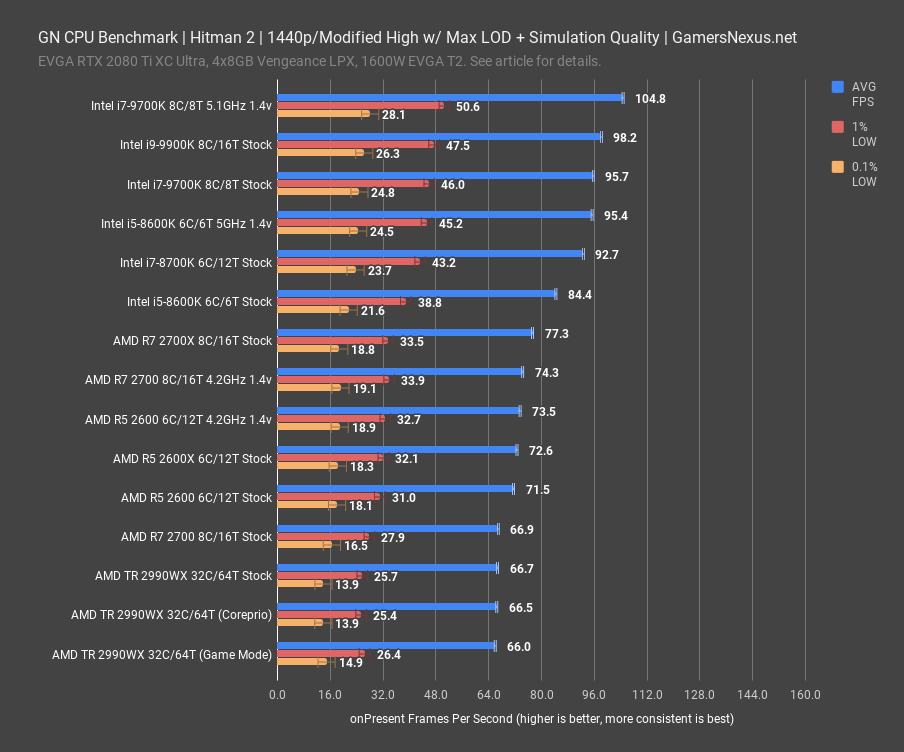
The results stack is exactly the same at 1080 or 1440. Testing the 8700K overclocked to a comparable frequency and seeing if it scores lower than the 9700K as well is next on our list. The 2990WX chugs along in last place again, with no uplift from game mode that would indicate this is because of too many cores.
Conclusion
That’ll start us out.
In the process of working through this first set of test data, we’ve already identified a few weak points and areas where we need additional (or reduced) testing. We’ll continue to iterate on this through the upcoming processor launches this year.
Editorial, Test Lead: Steve Burke
Testing, Editorial: Patrick Lathan
Video: Josh Svoboda, Andrew Coleman