AMD Ryzen 3 3300X CPU Review vs. 3100 Benchmarks: An R3 is Enough for Gaming & Clock-for-Clock
Posted on
This is the big one: In this review, we’re benchmarking the AMD R3 3300X $120 CPU, but we’re specifically interested in the real-world impact of the CCX-to-CCX communication latency in the Ryzen 3 3100 versus the Ryzen 3 3300X at the same overclocked frequency of 4.4GHz. It’s massive in some instances, beyond 20%, and eliminates the ability to just overclock the otherwise identical 3100 to meet the 3300X performance for cheaper. As discussed in our Ryzen 3 3100 review that’s already live, the 3300X runs a 4+0 core configuration with everything on one CCD, on one CCX, while the 3100 runs a 2+2 configuration on two CCXs on that CCD. We’re going to look at how much that impacts performance, but also review the 3300X versus basically every other current CPU, and a few older ones.
Unlike some previous CPUs, like the R5 3600 and 3600X, or the 2600 and 2600X, the AMD Ryzen 3 3100 can’t simply be overclocked to equate the 3300X’s performance. On paper, they look like the same CPU aside from frequency, but the difference is the CCX configuration (again, 2+2 vs. 4+0 on one CCD). The R3 3100 $100 CPU is 4C/8T and runs at 3.6GHz base, 3.9GHz boost, while the R3 3300X $120 CPU is 4C/8T and runs 3.8GHz base, 4.3GHz boost. Because the 3100 is so easily overclocked on just the multiplier (separate piece incoming on IF + DRAM), the logical jump would be that you could just buy a 3100 and overclock it to save $20. It does not work that way.
People skim articles, so to reiterate on its own line: That’s not how it works.
The 3300X has a significant advantage in its core configuration, but that advantage isn’t evoked in every single test. We’ll look at that today.
Testing Methodology
If you’d like to read our testing methodology for all of this, we’ve published a detailed one-pager GN CPU testing methodology 2020 article over here. If you prefer videos, you can watch that below:
AMD Ryzen 3 3300X Frequency Log - Cinebench
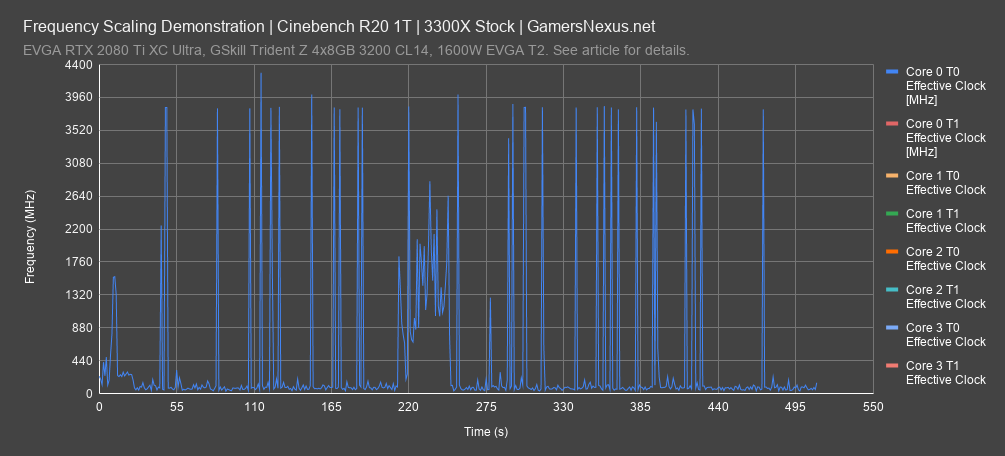

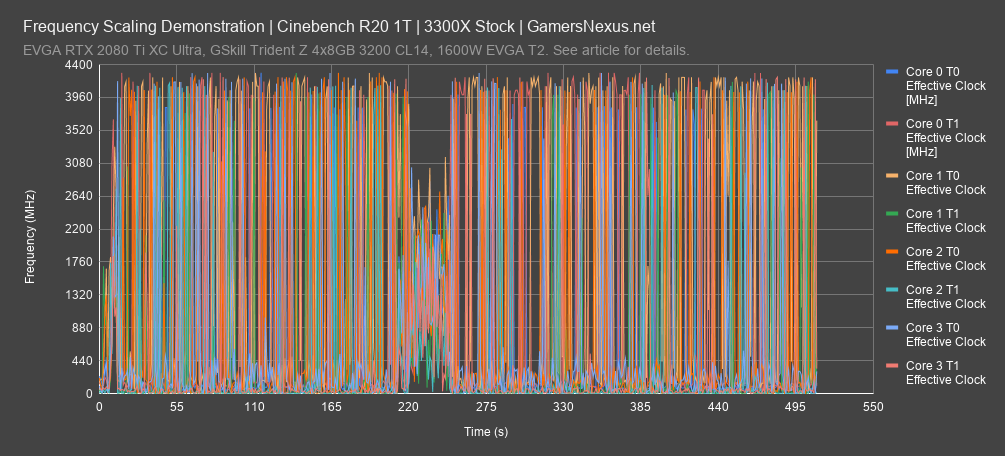
We need to start by looking at how the frequency behaves, both so we understand the product and so we ensure AMD is correctly advertising its frequencies. Starting with a messy chart of Cinebench R20 single-threaded, we can see the boosting behavior is as expected: Single threads are reaching 4.3GHz and taking turns doing so, as it’s a single-threaded workload. The pattern repeats twice and doesn’t exhibit any dips where unexpected. The CPU holds about 4300MHz. You can see the lines of C1, T0 spike to about 4289MHz, occasionally hitting 4300MHz, which we count as accurate to the spec.
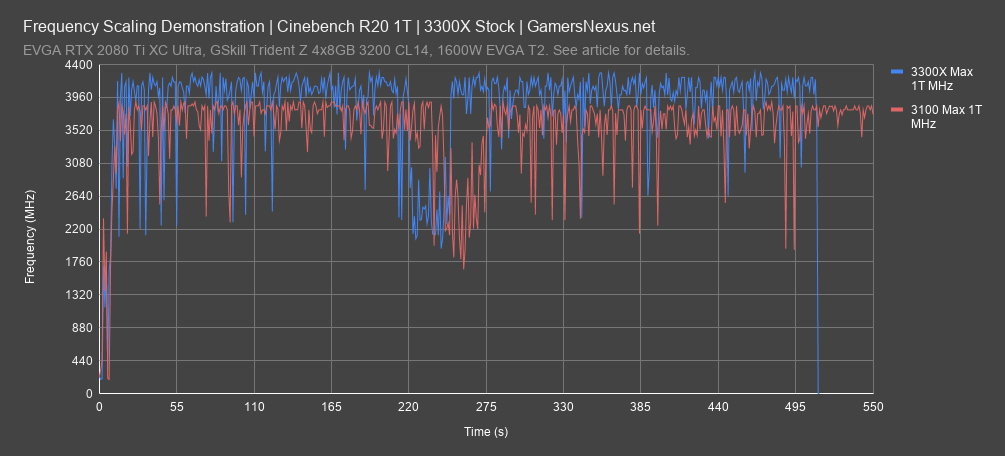
If we plot the maximum single thread frequency any given second against the 3100 instead, we end up with this chart. It’s much more legible. We’re only showing the max single frequency of all given threads now, and the 3300X and 3100 both follow their Boost specification reasonably well. They’re not perfectly flat lines, but they’re often within 10MHz.
AMD Ryzen 3 3300X Frequency Log - Blender
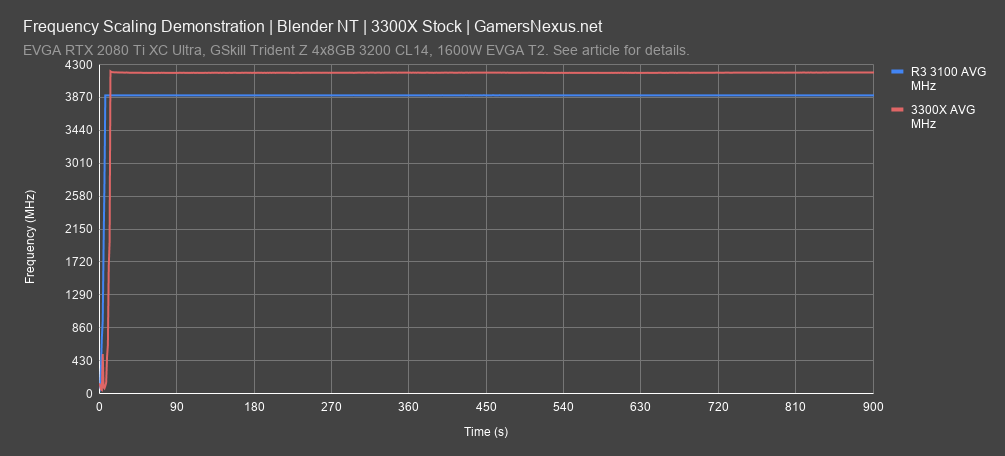
This frequency log shows Blender running for an extended period of time. The 3300X doesn’t hit 4300MHz all-core here, as Precision Boost 2 would typically behave, and ends up around 4217MHz all-core for the Blender sustained workload. The 3100, for reference, does about 3897MHz for the sustained workload, basically at its 3900MHz boost.
Total War: Three Kingdoms Battle (1080p)

We’ll start with Total War: Three Kingdoms and its Battle benchmark. We’ll use this as a vessel to get an early understanding of a wider range of CPUs and we’ll plot frametimes in the next chart. Our next game is the Division 2, which is heavily AMD-favored in current tests, so that one has a lot of interesting data as well.
At 1080p/High, the AMD R3 3300X stock CPU runs at 129FPS AVG, with lows proportionally spaced at 70FPS and 63FPS 1% and 0.1%. The OC pushes it to 129FPS AVG -- so there’s no gain here, and that’s for two reasons: (1) the ceiling isn’t too far, and the ceiling is lower for AMD than it is for Intel due to some overhead, as illustrated by the 3700X and 3950X; (2) the 3300X already runs at 4.3GHz boost, so a 100MHz jump doesn’t change that much in scenarios where boosting is at full clocks. Comparatively, the 3300X stock outperforms the 3100 stock by 24%, which might well be worth the $20 for many people. The 3100 OC vs. 3300X OC is 14% apart, so the 3100 had more overclocking headroom to benefit from. We’ll look at infinity fabric overclocking in an upcoming piece. As for Intel, the 7700K stock CPU runs at exactly the same AVG FPS as the 3300X stock, with frametimes also equivalent -- they’re within run-to-run variance, and neither is superior to the other. The 7700K OC to 5.1GHz gets it a technical advantage across the board. Intel’s 9100F is more competitive against the 3100 in this game, but not overall and becomes less significant in other titles. As for the 1600AF, that’s still AMD’s biggest competition, and it’s a part that AMD makes.
Total War: Three Kingdoms Frametimes
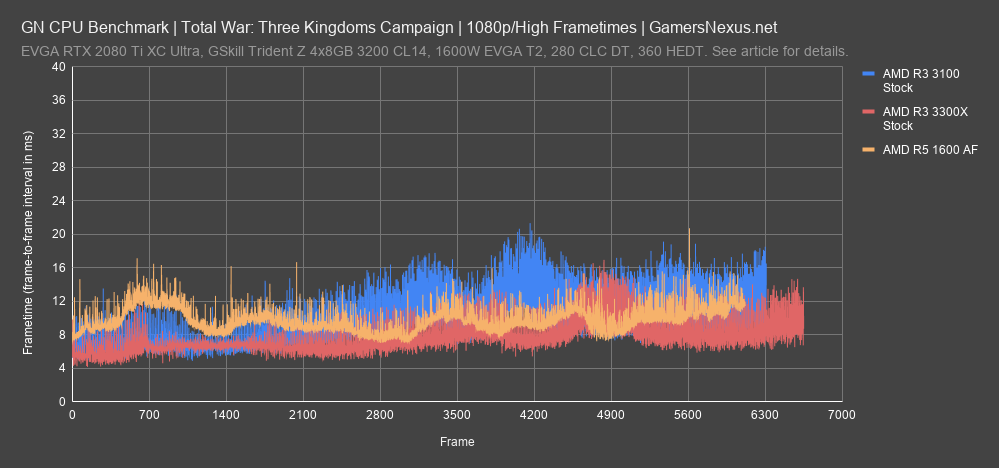
Here’s a frametime plot for Three Kingdoms battle. This is the closest empirical representation of player experience that you can get, as it shows frame-to-frame interval and illustrates the time required to render each frame. Lower is better, and a flat line would be a theoretical “best,” although that never happens without v-sync. The 3300X plots lower in average frametime than the 3100, expectedly, and also produces a higher FPS. The greatest excursion from the previous frame is about 6ms. We see 8-12ms as being noticeable to players. The most interesting item on the plot is the 1600AF. Although this CPU underperforms in total frame throughput and average FPS versus the 3300X, it is better than both in frame consistency. The line tightens up without too many big excursions -- we see two hits for about 8ms -- and so we can postulate that the 1600AF’s additional threads may help smooth-out frame-to-frame interval.
Total War: Three Kingdoms Battle (1440p)
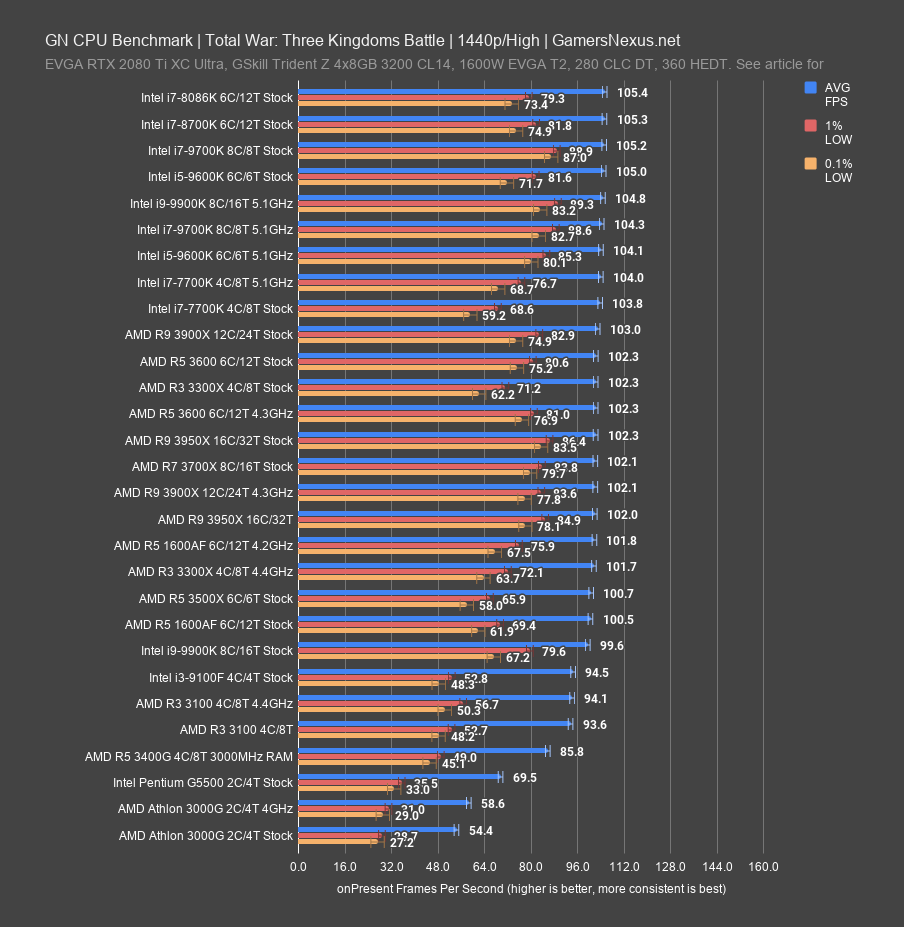
Here’s Battle at 1440p. The chart shrinks, as we’ve explained countless times before, because we’re now GPU-bound at the top-end. Basically everything between the 9900K and 8086K -- top-to-bottom -- is within variance and cannot be distinguished apart due to hitting GPU limitations at varying degrees of impact. You can’t use this chart to say, for instance, that a 9600K stock CPU is better than a 9900K stock CPU, because that isn’t true under any circumstance. To really hammer it in: It’s not better, it’s within variance and error, and so no difference can be established.
The 3100 was under our threshold here, so this chart was still useful for illustrating that. Its frametimes also suffered as compared to the rest of the stack. The 3300X enters the realm of immeasurable difference, showing the realistic side of PC building that if you’re limited on graphics, the CPU only matters so much. The 3300X does benefit from improved frametime consistency though.
Total War: Three Kingdoms Campaign (1080p)
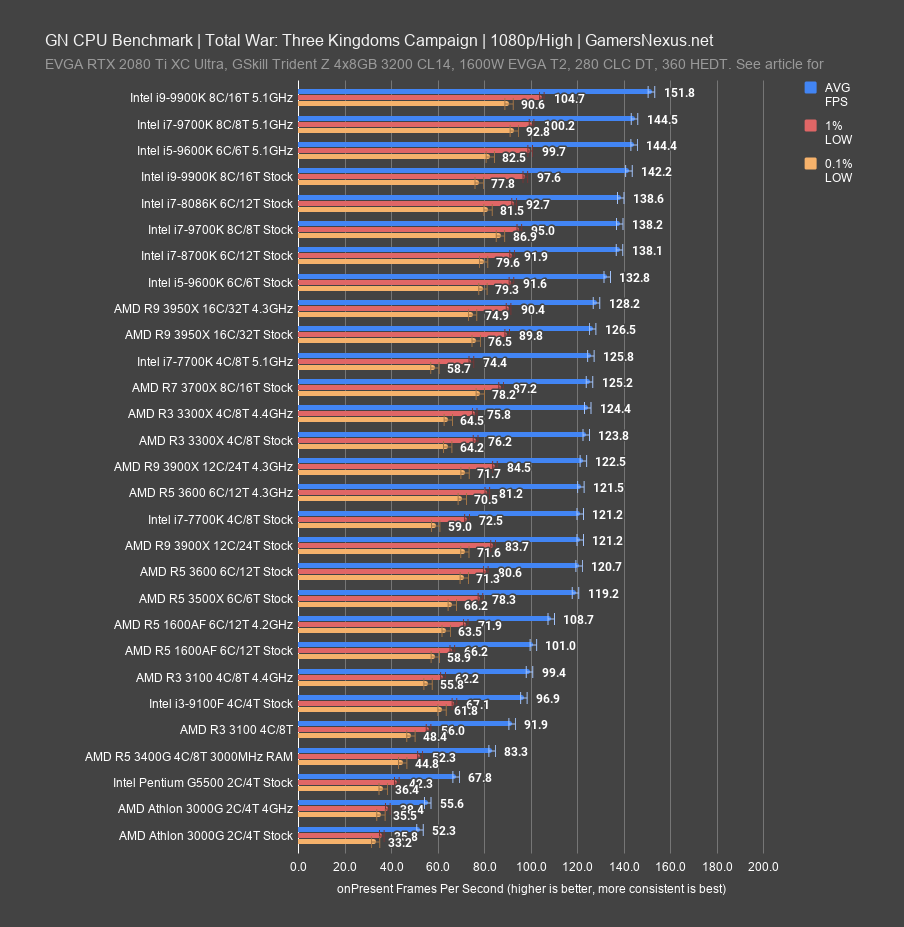
The campaign benchmark is next, then shortly The Division 2. For the campaign benchmark at 1080p, the 3300X stock and OC results are right on top of each other, with no difference outside of standard deviation run-to-run. 100MHz doesn’t change much in a game. The 3300X 124FPS AVG outperforms the 3100 92FPS AVG by 35%, a marked difference that provides significant value for the $20 extra. Overclocking the 3100 closes that gap to 25% OC-to-OC. The 1600 AF, meanwhile, runs ahead of the 3100 but behind the 3300 by reduced margins, stock and overclocked. The 3500X is one of the closest competitors, but also largely unavailable these days -- particularly in the West. As for the Intel competition, the 7700K from 2017 is outperformed by the 3300X in both framerate and, to a measurable but imperceptible degree, 1% and 0.1% lows. The delta is 2.1% in favor of AMD. The 7700K OC to 5.1GHz pushes it past both 3300X entries in framerate, with frametime consistency comparable. Considering the original price of the 7700K, AMD has done well to drag-down the cost of an i7 to what Intel should be selling them for now; actually, Intel sort of will be doing that with its i3 4C/8T launch in short order.
The Division 2
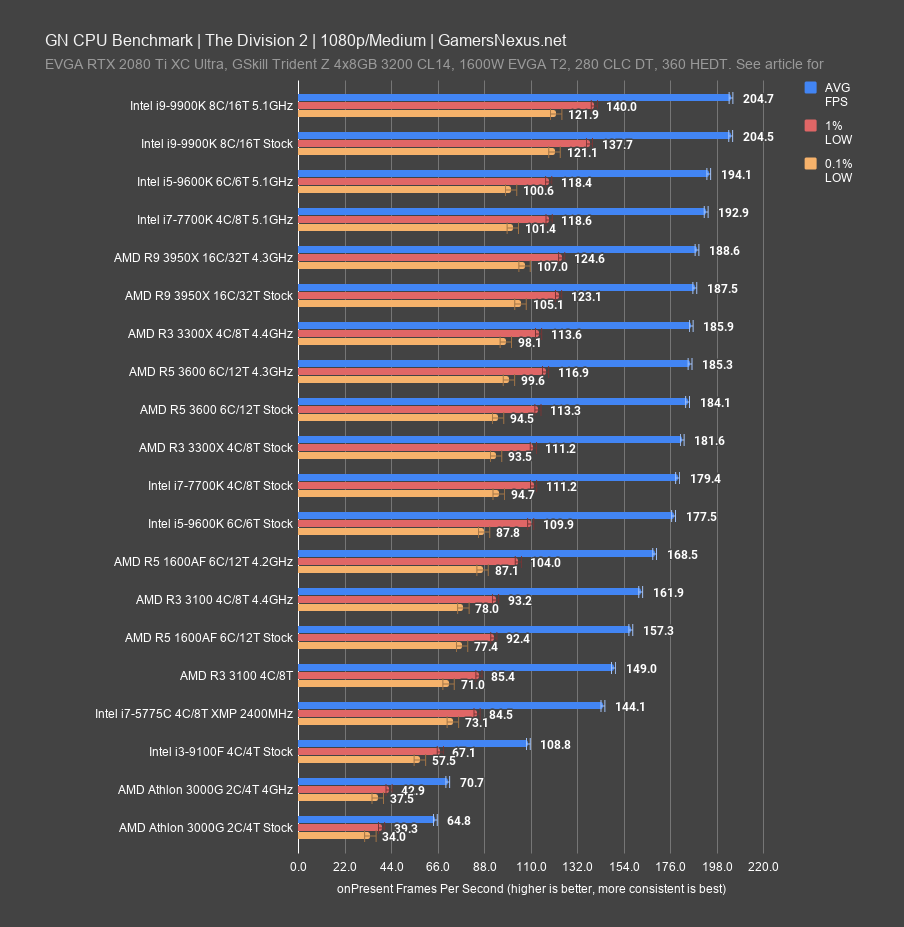
The Division 2 is next, using our freshly updated set of tests on Medium. The chart has fewer entries, but we’re filling it in. This one was really interesting in our budget CPU round-up and in our 3100 review, and it’s because of the comparatively large delta between the 3100, 1600AF, and the 9100F CPUs. The 3100 outpaced the 9100F by 37% stock-to-stock, showing that this title in particular benefits from the extra threads and has performance to gain from AMD’s approach to CPU design. The 3300X continues to gain, this time from higher boosting frequencies stock and from reduced latency, and that puts it at 182FPS AVG vs. the 149FPS AVG of the 3100. That’s a 22% advantage. Overclocking the 3100 and 3300X reduces the gap again to about 15%, similar to other results in this review. The 3600 is a relevant comparison as being somewhat awkwardly outperformed by the cheaper 3300X when overclocked, or being roughly equivalent stock. AMD is running into a ceiling at about 190FPS AVG here, whereas Intel’s ceiling is a little higher at 205FPS AVG due to the difference in GPU processing or driver overhead. The 7700K, for reference, is technically outperformed by the 3300X AVG and is roughly equivalent in frametime consistency. The 7700K OC outperforms both entries.
Red Dead Redemption 2 (Vulkan, 1080p)
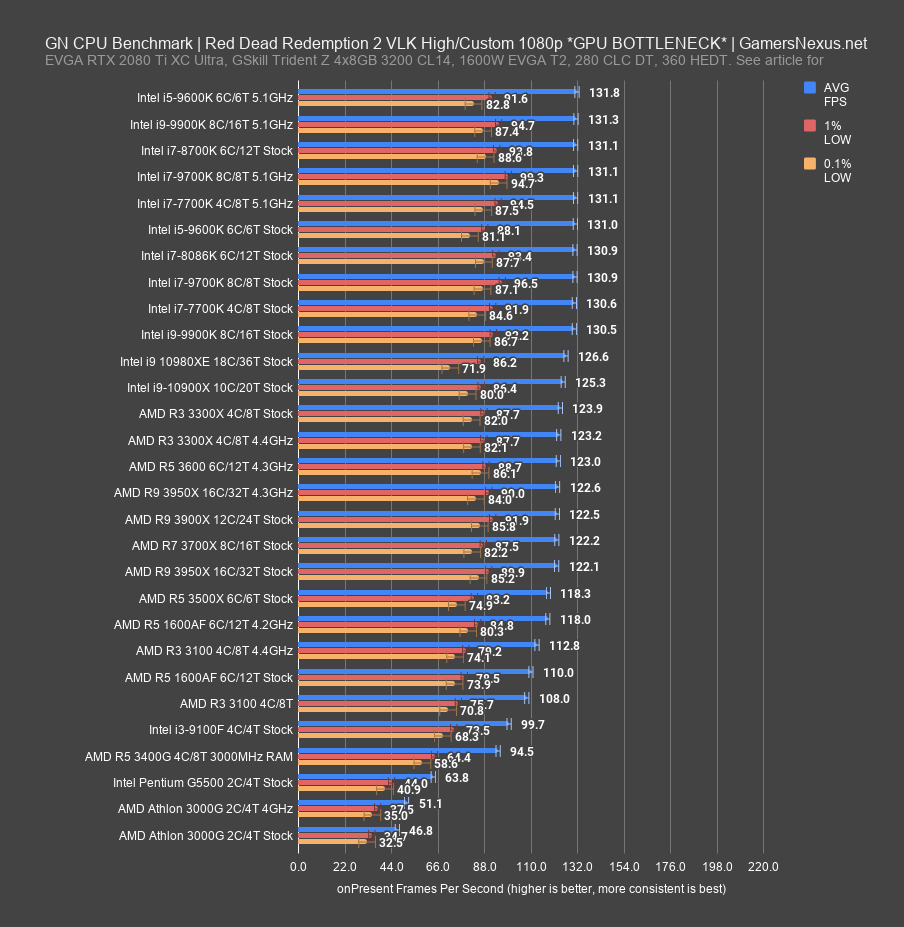
The next one is Red Dead Redemption 2, which, if it were benchmarked against other benchmarks, would be the top pain in the ass to benchmark. We test this one at 1080p, 1440p, with Dx12, and with Vulkan, and with High and Medium settings. The first chart is 1080p/Vulkan and High.
The 3300 stock runs at 123FPS AVG, putting it right at the limit of what this game even allows for AMD framerates. The Intel framerate limit is a bit higher, at 131FPS AVG. We’re GPU-bottlenecked, and to allow CPUs room to breathe, we have to reduce to medium. Even that isn’t great, illustrating the very real struggle between showing a meaningful CPU difference and showing a real-world result. This is the latter: It’s not helpful to compare CPU scaling by percent, because everything above 120FPS AVG is constrained, but it is good to show what happens when you’re GPU-bound, which is most instances in games.
The 3100’s 108FPS result is outmatched by the 3300X by about 15%, but it’d likely be higher if more room were allowed. The 3300X shows no gain and is within test variance of stock and bouncing off the GPU ceiling. The 7700K has a higher ceiling here and so is ahead of both CPUs. Let’s move on to a more useful chart.
Red Dead Redemption 2 (1080p, Medium)
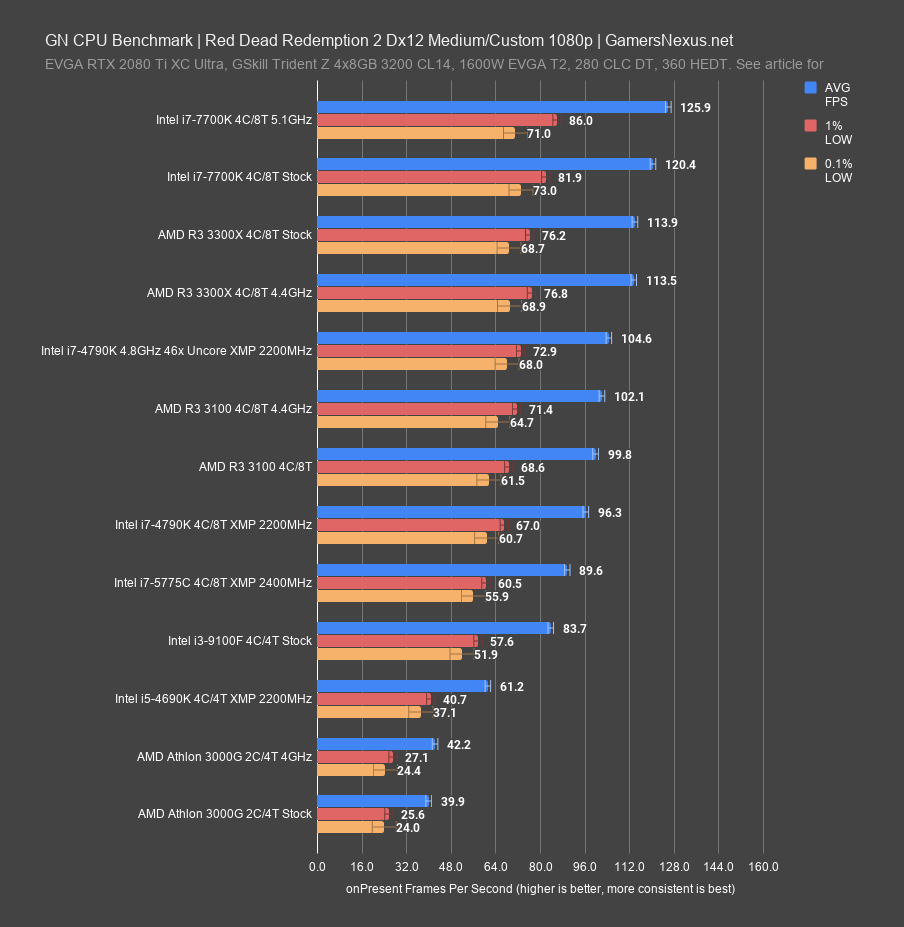
Here’s the medium test with Dx12, a different API, so our performance behavior changes. The 3100 result hasn’t really changed since it’s been CPU bound already, but the 3300X stock result is now 114FPS AVG, with about the same on the 3300X OC. They’re within test variance of each other and should be considered the same. The 7700K establishes a ceiling of 126FPS AVG for Intel, and it appears AMD’s is likely about 114FPS AVG, otherwise we might see some marginal advantage in the OC. The 3300X outperforms the 3100 by about 14%. The 9100F falls far behind at 84FPS AVG and shouldn’t really be considered.
Red Dead Redemption 2 (Dx12, 1080p)
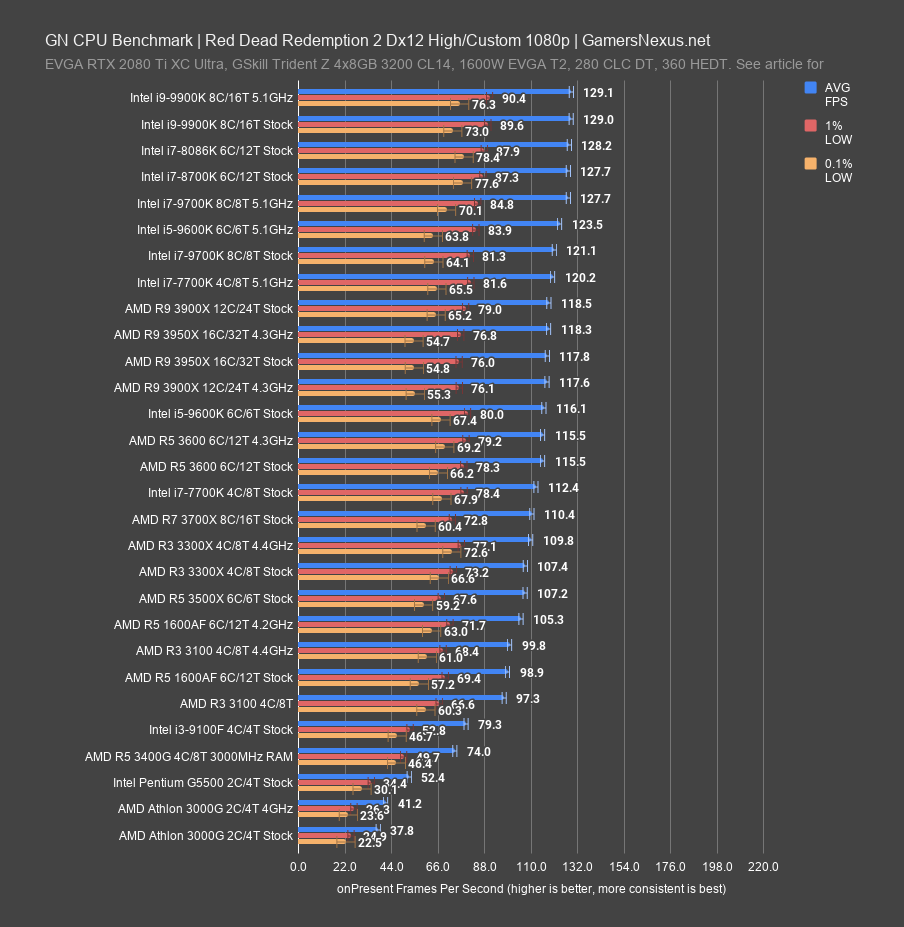
For 1080p and High settings with Dx12, you can see that the gap shrinks from the 14% we just witnessed: The 3300X now has its performance truncated as a result of bouncing off the GPU limit when it’s fully CPU unconstrained. The 3300X stock only leads the 3100 by 7.6% here, at 107FPS to 97FPS AVG stock-to-stock. The OC doesn’t do much for the 3300X. The 1600AF runs between these two sets of results, stock and overclocked, and is still one of the best values if available. As for the 3600, that runs marginally higher in AVG FPS, but is about the same for proportional frametime consistency.
We can skip Red Dead at 1440p as it’ll provide no value: They’re all about the same at that point.
F1 2019 (1080p)
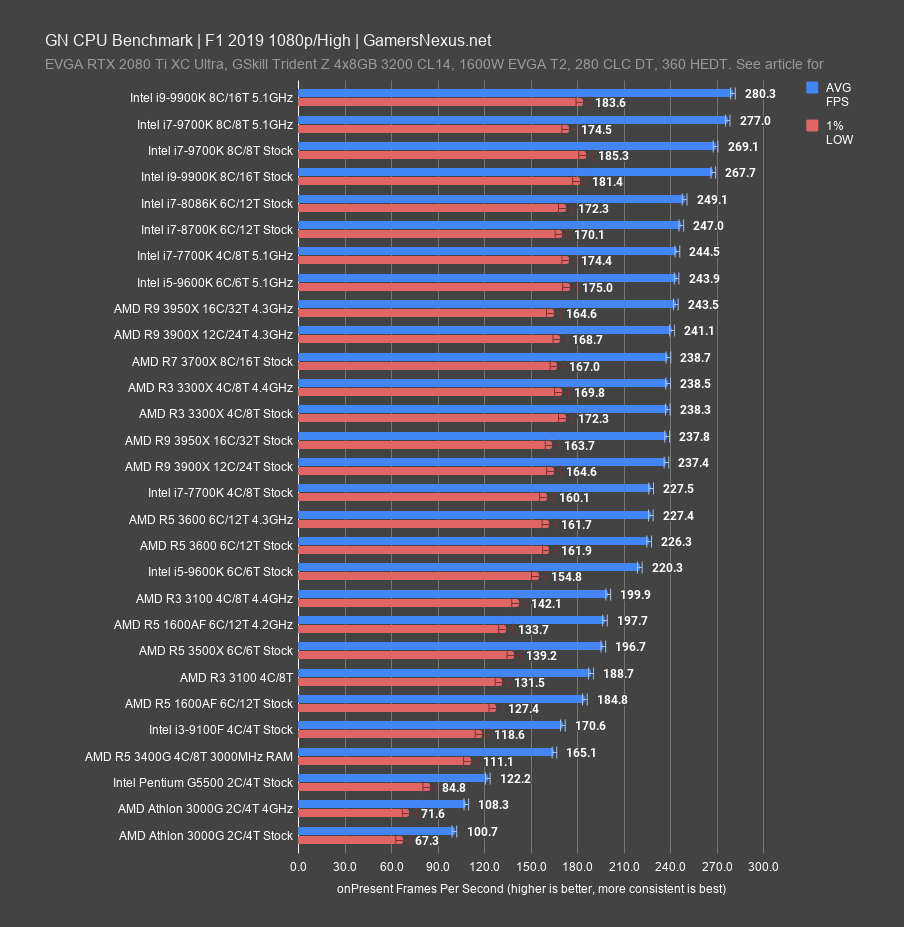
F1 2019 with Dx12 and running at 1080p is next. The 3300X stock CPU gains nothing from the overclock, with both plotting roughly the same in averages at 238FPS. This is around where all the other AMD CPUs top-out too, aside from the 3950X at 4.3GHz, which benefits from a 244FPS AVG. The 7700K stock CPU operates at 228FPS AVG, allowing the 3300X stock a lead of 4.7%. Its OC pushes to 245FPS AVG, establishing that older Intel CPU OC headroom has nothing to prove. The 3100 stock’s 189FPS AVG allowed the 3300X a lead of 26%, similar to Total War, but the interesting point is that the 3100 and 3300X both at 4.4GHz does not equal the same framerate, unlike the 3600 and 3600X would do, and that’s because of the latency. It plays a huge role here: The 3300X 4.4GHz and 3100 4.4GHz results are 40FPS AVG, or 19% apart, in favor of the 3300X. The frametime performance also scales, at 170FPS 1% lows versus 142FPS 1% lows on the 3100. The moral of the story is that you shouldn’t buy the 3100 with the intent to just overclock it equivalent to the 3300X: AMD has caught on, and it can’t be done like the 2600 and X or 3600 and X.
F1 2019 (1440p)
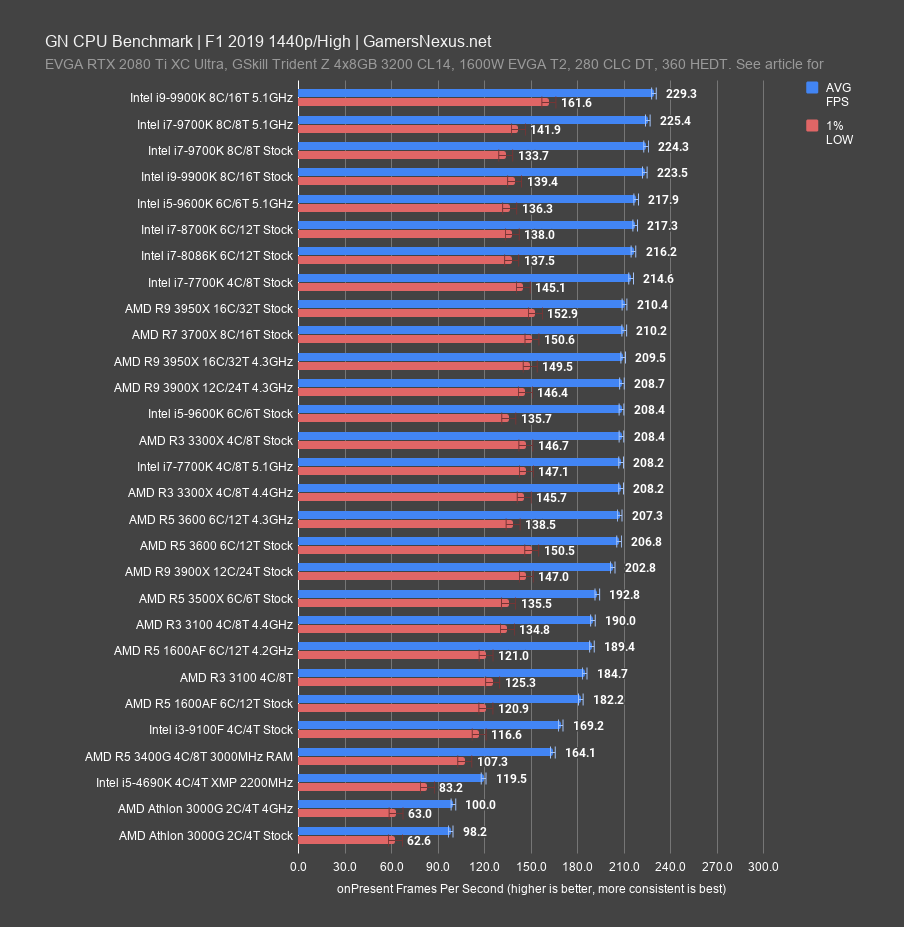
Here’s 1440p with F1. As expected, the results are crushed down to a more limited range: The 3300X stock and OC numbers now show zero difference at all, and the 3100 stock result’s 185FPS AVG allows the 3300X stock a lead of only 13%. The 7700K stock and OC leads both CPUs, and the 1600AF remains a good value solution if ever again available for MSRP of $85.
Shadow of the Tomb Raider (1080p)
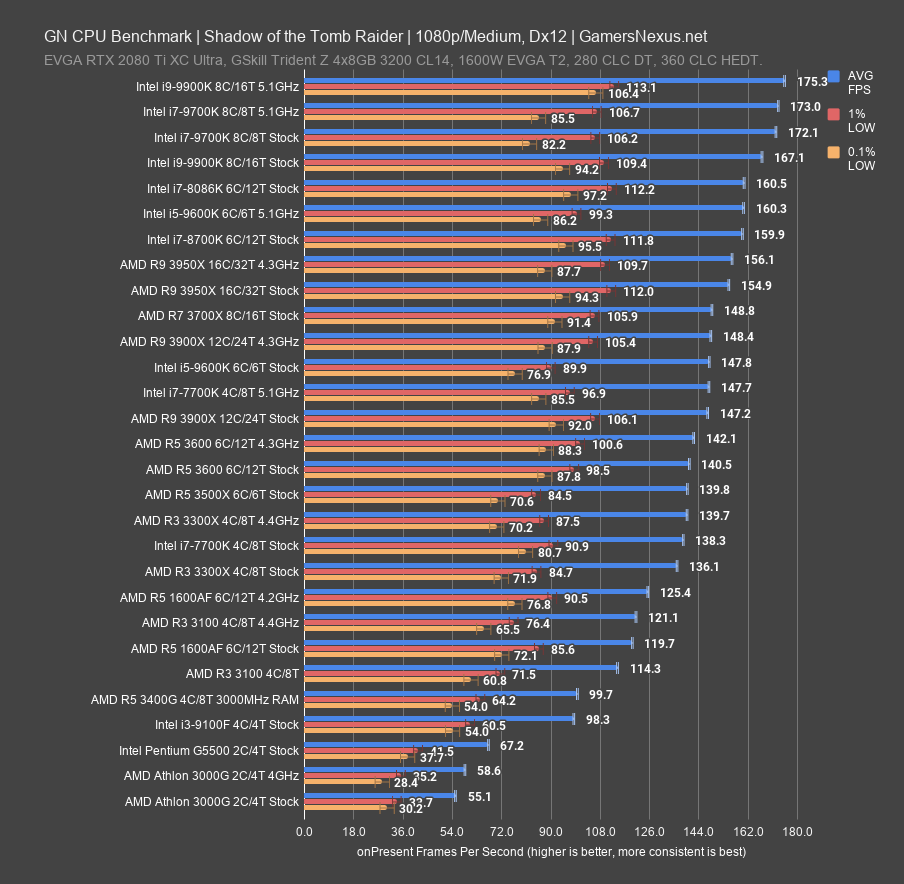
As with many of the game tests, the 3300X didn’t show much improvement in Shadow of the Tomb Raider with an all-core overclock, but the average did rise from 136FPS to 140FPS, bringing it to about the same performance level as the stock R5 3600. Intel’s i3-9100F fell significantly below the Ryzen parts with a 98.3FPS overall average and 0.1% lows dipping down to 54FPS average, while even the stock 1600AF managed 120FPS average. This is one title where we see reasonable scaling with thread count, contributing to the 3600’s advantage. Intel’s stock 7700K falls neatly between the stock and overclocked results for the 3300X, while the 5.1GHz overclock yet again pushes it well beyond the rest of the pack at 148FPS average. The real value competition here is between AMD’s new R3s and the overclocked 1600AF. If not, then this is a title where the more expensive 3300X retains an advantage over the 3100 even when overclocked. Clock-to-clock, the 3100 vs. 3300X result benefits the 3300X by 15%, despite being the same CPU on paper. That’s the latency at play from the die layout change.
Civilization VI
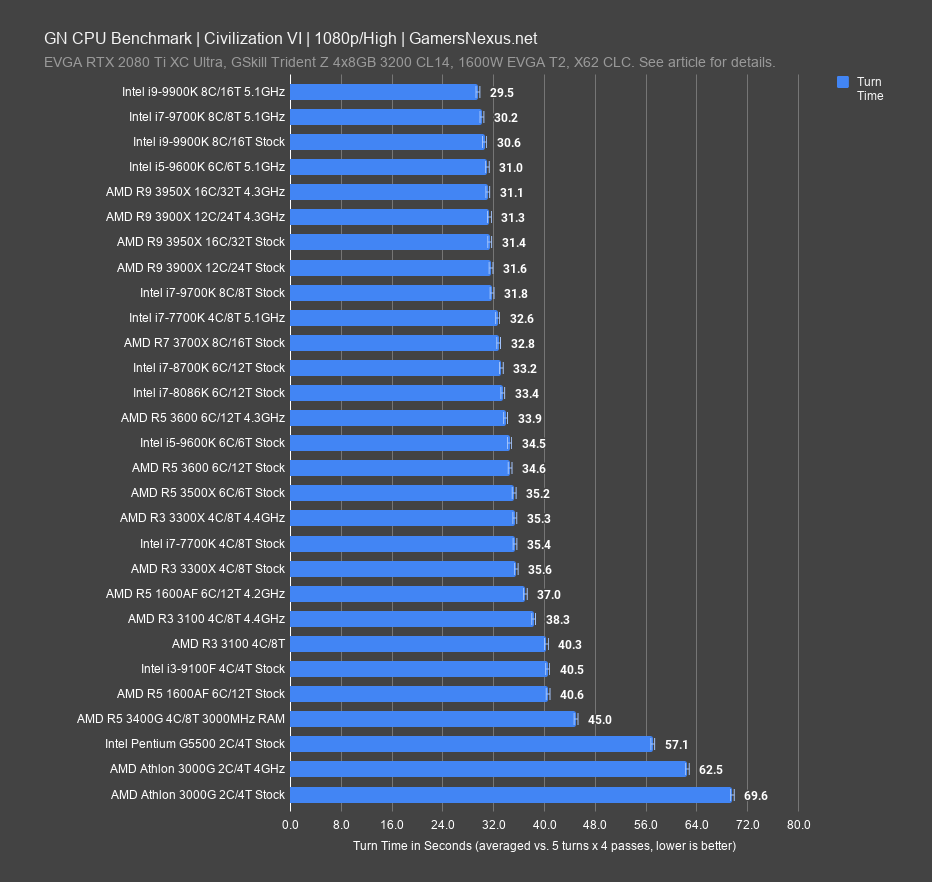
The Civilization VI benchmark averages the completion time of five batches of AI turns, and we run the benchmark four times to get an average of that average. The end result is consistent enough that fractions of a second are significant, so although 35.6 seconds stock for the 3300X versus 35.3 seconds overclocked isn’t particularly impressive, it is a real improvement. The 7700K was fractionally faster stock, but pulled significantly ahead at 5.1GHz, averaging 32.6 seconds per turn. A more realistic comparison to an Intel CPU that can actually be bought new in 2020 is the 9100F, which averaged 40.5 seconds per turn, landing between the stock 1600AF and 3100. Intel’s i3 can’t be overclocked, but AMD’s parts can, and the 1600AF and 3100 both land closer to the 3300X’s numbers when pushed to 4.2 and 4.4GHz all-core respectively--but still a couple seconds slower. Even overclocked to the same frequency, the 3300X wins out over the 3100 here, by a wide enough margin to make the extra $20 worth considering -- it’s an 8% reduction at the same frequency. A few seconds in Civ may not mean much, but that same performance gap may be reflected elsewhere or in other games. The R5 3600 does outperform the 3300X with a 34.6 second average stock and 33.9 second average when overclocked, so for this title AMD’s naming scheme holds up, with the higher-end parts safely outperforming the lower.
GTA V (1080p)
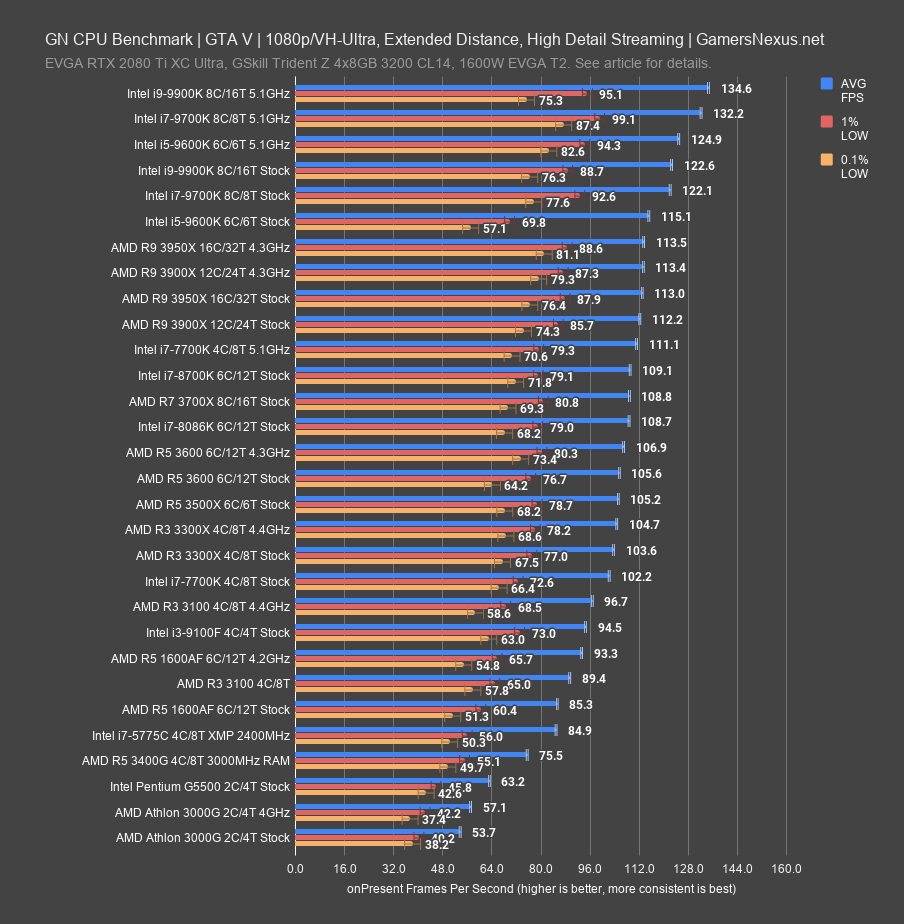
Grand Theft Auto hasn’t responded greatly to thread count increases since the days when we were comparing 4C/4T i5s to 4C/8T i7s. AMD’s brought us back to those days with the 4C/8T 3300X, and at stock it’s just slightly ahead of Intel’s stock i7-7700K at 104 FPS AVG versus 102 FPS AVG with nearly identical 1% and 0.1% lows, while the 4C/4T 9100F lags slightly behind at 95 FPS AVG. The 5.1GHz 7700K result is far and away the best of the CPUs we’re focusing on today, at 111FPS AVG, so clearly the old Intel chips had some more headroom than modern Ryzen--overclocking the 3300X brought only about a 1 FPS increase in the overall average, as the lightly-threaded workload allows the chip to stick close to its 4.3GHz boost clock even without an overclock. The 1600AF can’t quite keep up here, falling victim to lower clock speeds and only hitting 93FPS AVG even when pushed to 4.2GHz all-core, and the 3100 follows a similar pattern with averages a couple FPS higher. Clock-for-clock, the 3300X holds an 8.3% lead over the 3100 at 4.4GHz each. The R5 3600 makes a more respectable showing: it’s as unreactive to overclocking as the 3300X was in this test, but the FPS averages are 106 and 107 stock and OC, with an especially favorable 73FPS 0.1% low when overclocked to 4.3GHz. In the end, all of these averages are fairly close together, and even Intel’s 9100F is in the same FPS ballpark as the other CPUs, making it the best bargain for this aging title, but one that shouldn’t be considered for much of anything else.
PRODUCTION BENCHMARKS
Blender 2.81 – Monkey Heads
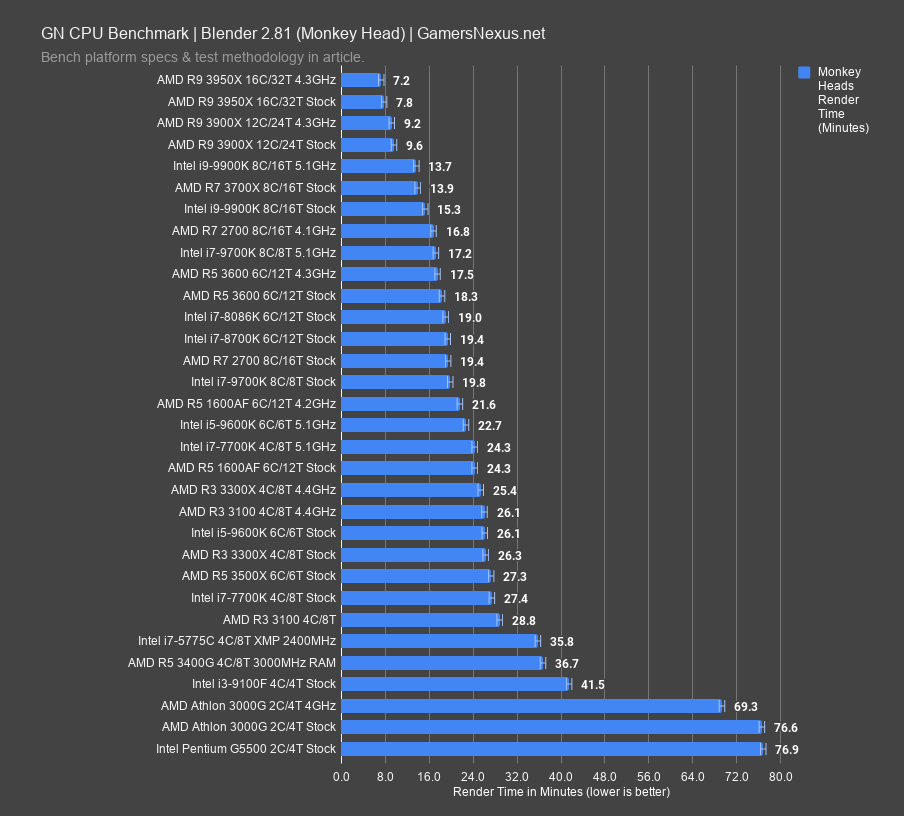
We can finally move on to production and power tests. The first one is Blender 2.81 with our GN monkey head benchmark and our GN logo benchmark, two in-house designed tests that stress the CPUs in different ways to root-out any hierarchical differences in the lineup. Each thread is given one tile to render, so thread count scales significantly -- but not linearly -- in this benchmark.
Starting with the monkey head render, the AMD R3 3300X stock CPU requires about 26 minutes to complete the render, as compared to the 3100 at 28.8 minutes; that’s a render time reduction time reduction of 8.7% stock-to-stock. At the same clocks, the 3100 falls to 26 minutes render time, a reduction versus its stock result of 9.4%. That puts it just behind the same-clock 3300X, with the 3300X reduced by 2.7%. The latency here is less important, cross-CCX communication is less common in this application. Even still, a 2.7% minimum delta is good to know. There may be value yet in the 3100 OC for less latency-sensitive workloads, like some non-gaming applications. Comparatively, the 1600AF is still the far better deal than both of these, kicking their asses at its $85 MSRP, and also kicking their asses in its invisibility cloaking technology, because people buy it out as soon as it’s restocked. The 7700K, for comparison, is outperforming the 3300X when overclocked (with a 24-minute result), but is outperforming stock-to-stock with its 27-minute scoring.
Blender 2.81 – GN Logo
![]()
The GN Logo render takes longer to draw on all the CPUs, but occasionally shuffles the stack. The 3300X requires 33 minutes to complete the render, marking it as functionally equivalent to the 3500X, 9600K, and a bit ahead of the 7700K stock CPU. The improvement versus the stock 3300X is about an 8.4% reduction in time required. The 3100 OC to 3300X OC is a 2.2% reduction in this one. If you want good tile-based rendering performance on a CPU -- or if you’re jointly using the CPU and CUDA, as Blender more easily allows now -- then the 3600 would offer the best value of all, at 23 minutes stock. That’s a $50-$80 jump in price, depending on timing, and may be worth considering for professionals or regular hobbyists.
Adobe Premiere – 1080p
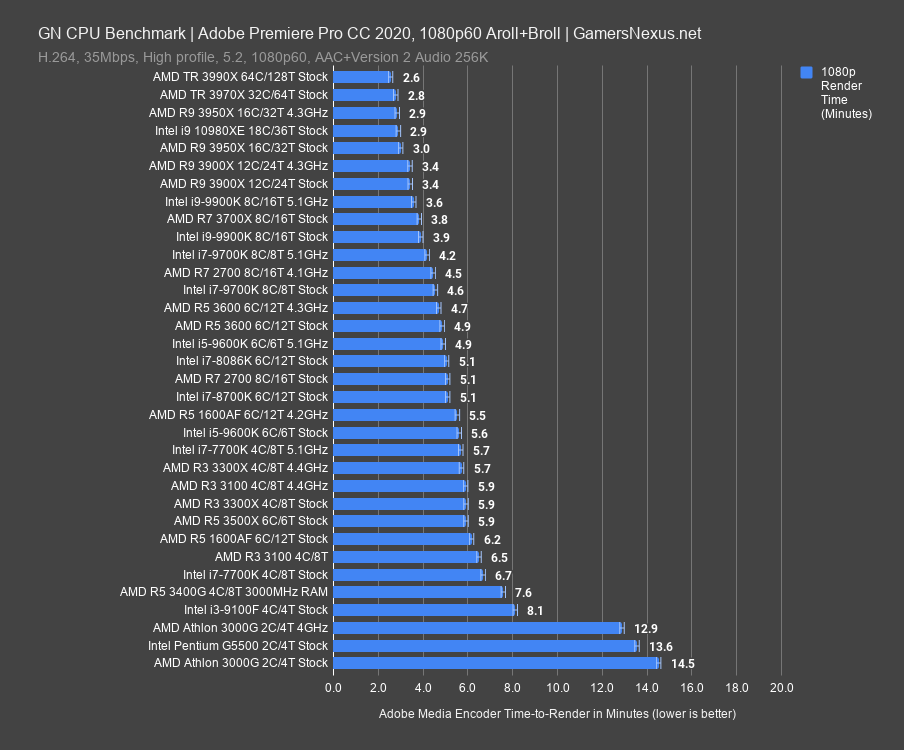
Premiere at 1080p is next. The 3300X stock finishes our 1080p60 show floor video in 5.9 minutes, which is equal to the 3100 4.4GHz OC. Overclocking the 3300X to the same clocks allows it to retain a 3.4% advantage, so again, production applications minimize the gap caused by latency that we saw in gaming. The 7700K OC outperforms all of these, but runs similarly to the 3100 at stock. As for the omnipresent 1600AF, its stock result is between the 3100 and 3300X, while the 3600 stock of 4.9 minutes outperforms the 3300X stock with a 14% time reduction. The 9600K is the closest current competitor, but is also irrelevant at $200, as it has been largely since launch.
Adobe Premiere – 4K
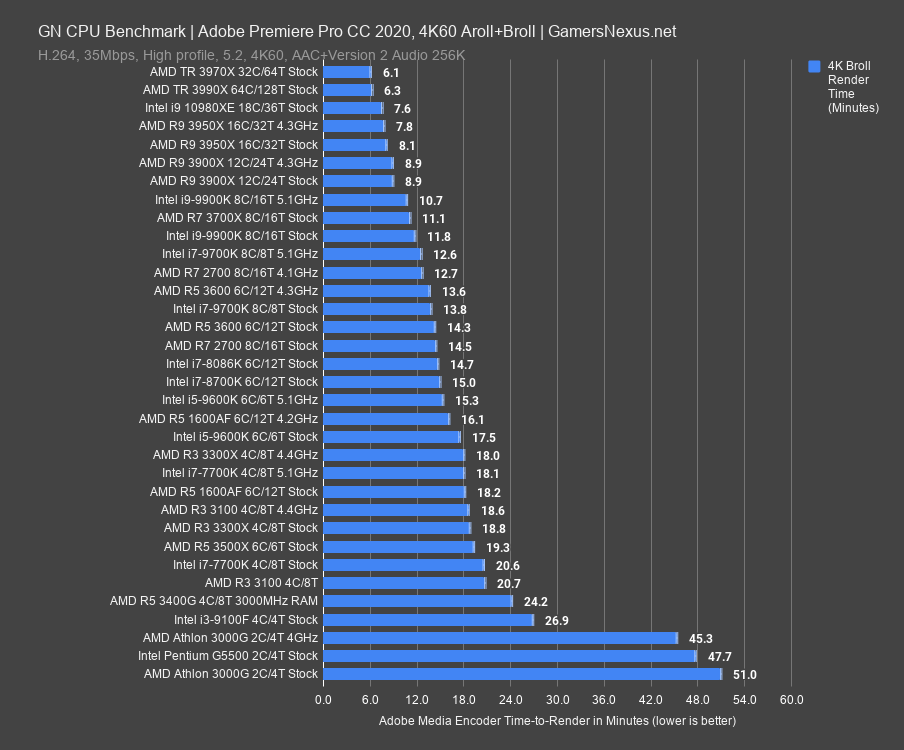
Our Premiere render at 4K60, which is entirely comprised of b-roll as a demo reel, plants the 3300X and 3100 disadvantaged more notably than before. As the workload gets heavier, the gap widens. The 3300X stock CPU needs 18.8 minutes to render -- a bit outpaced by the 3100 OC, but similarly outpacing the 20.6-minute result of the 7700K and 20.7-minute result of the stock 3100. Overclocking both puts the 3300X in a lead of 3.2%. The 3600 again has the best value here.
Photoshop
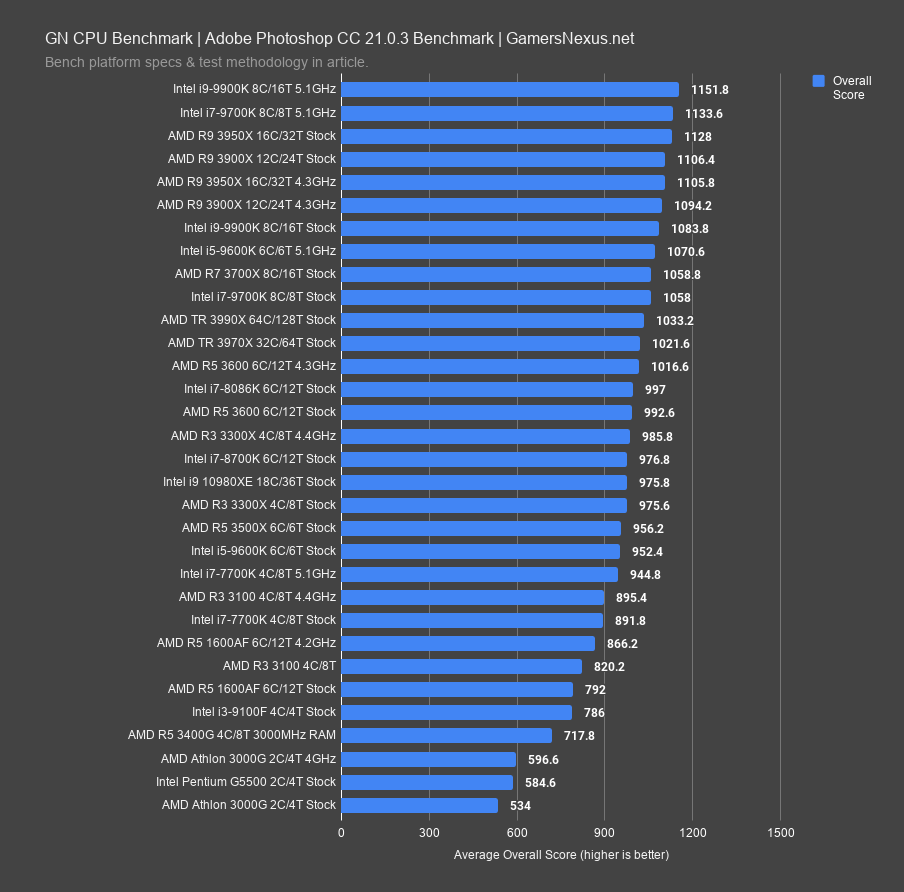
Adobe Photoshop is next, ever the frequency-happy production benchmark that hardly notices thread scaling. This is with heavy user scenarios, so that’d include a lot of transforms, like warps or skews, filters, blend effects and layers, and similar functions. The 3300X stock scores 976 points, which is about equivalent to the 10980XE stock: If you needed an example of why Photoshop doesn’t care about threads, that’s a great one. The 9900K and 9700K, and 9600K, for that matter, disproportionately lead versus their thread counts. That’s the nature of Photoshop. The 3300X OC versus 3100 OC becomes more interesting and presents a 10% advantage from latency and layout. Still, if you’re basically only using Photoshop, you should be instead considering a higher frequency part, and likely from Intel.
7-Zip
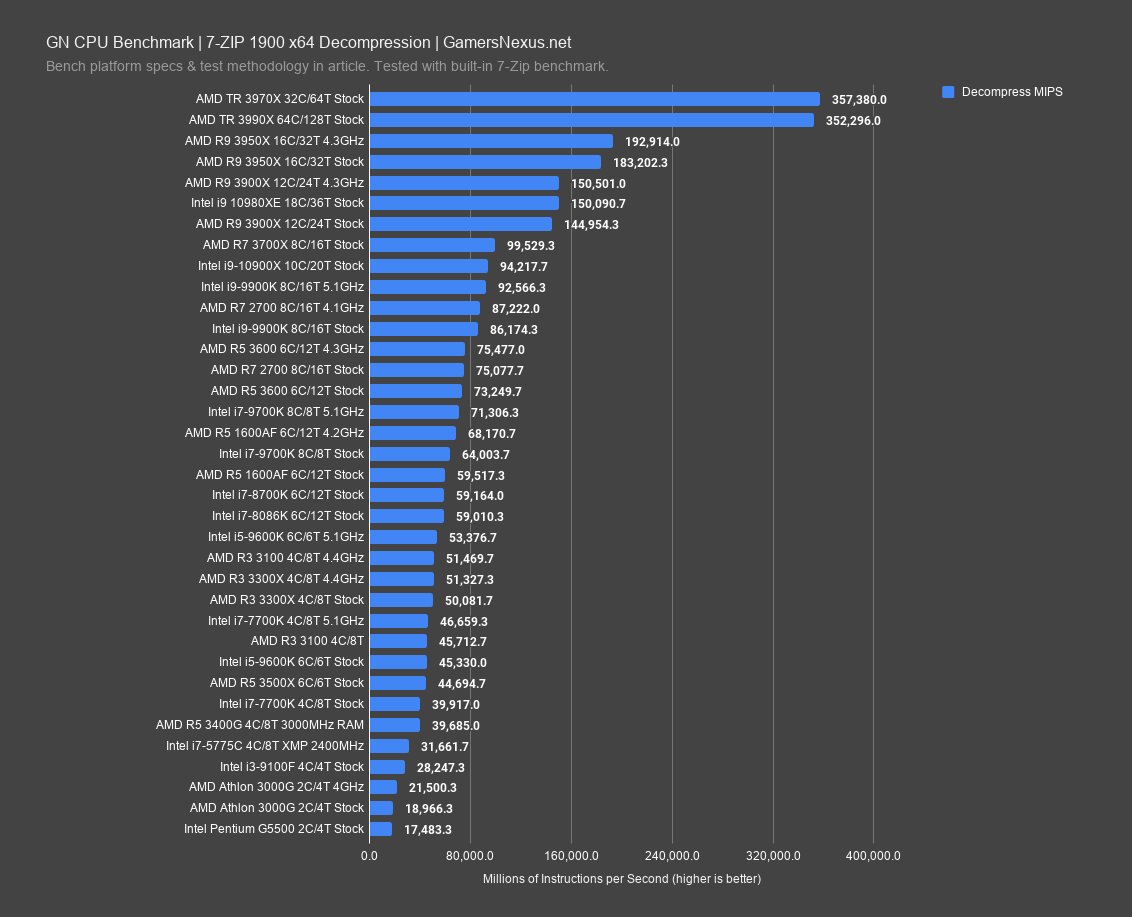
7-zip compression and decompression are up now. The 3300X stock result for decompression is 50,000 MIPS, or millions of instructions per second, which means the 51.3K 3300X 4.4GHz result isn’t meaningfully improved. The gain is about 2.5%. The 3100 OC is within error of the 3300X OC in this test, so we can call them functionally equivalent and note that latency doesn’t seem to matter here. These CPUs all outperform the 7700K, aside from the 3100 stock, which is about equal. The 1600AF has a significant lead at 59K MIPS and is most closely joined by Intel i7 CPUs.
Compression has the 3300X stock about the same as the 3100 OC, and the 3300X OC leading the 3300X OC by about 0.7% -- so there’s again no difference, and it’s within variation and error. The 1600AF roughly ties the 3300X OC when the AF is stock, while an overclock produces minor gains. The 3600 is far more interesting at 56K MIPS, but only if budget allows.
Chromium
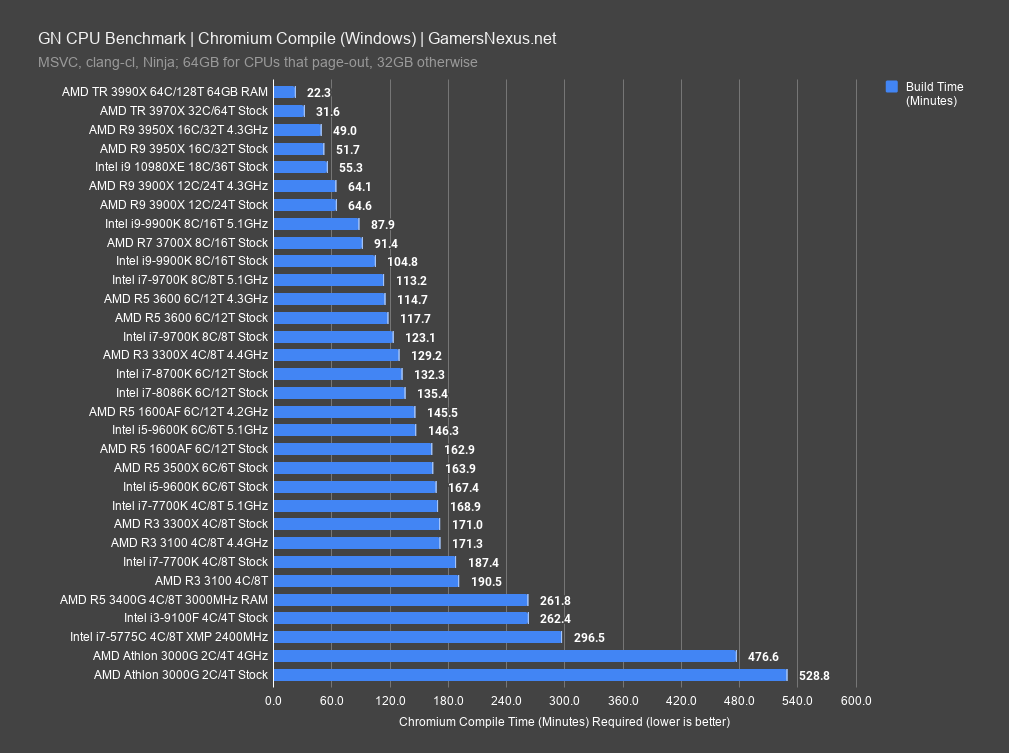
Here’s Chromium, compiled using clang-cl and Ninja on Windows. Code compiles are wildly variable dependent upon environment, OS, and the actual codebase itself, so please remember that this doesn’t extrapolate against all code everywhere, just like one game doesn’t extrapolate across all games. We’d basically need a code compile section similar in length to gaming to fully understand it. As a guide, the Chromium compile requires 129 minutes on the overclocked 3300X, putting it just ahead of the 8700K and far ahead of both 7700K references. The reduction in time required with a 4.4GHz OC is about 24% against the stock 3300X, while the 3100 OC falls drastically behind with its own 4.4GHz result. Latency really matters here, benefiting the 3300X by 24.6% time reduced. We also see that frequency benefits the 3300X, as its 4.4GHz 8-thread result outperforms the 1600AF 12-thread 4.2GHz result by 11%. This marks Chromium compile as the most interesting test of the production suite, since the latency really seems to show itself.
Power Testing
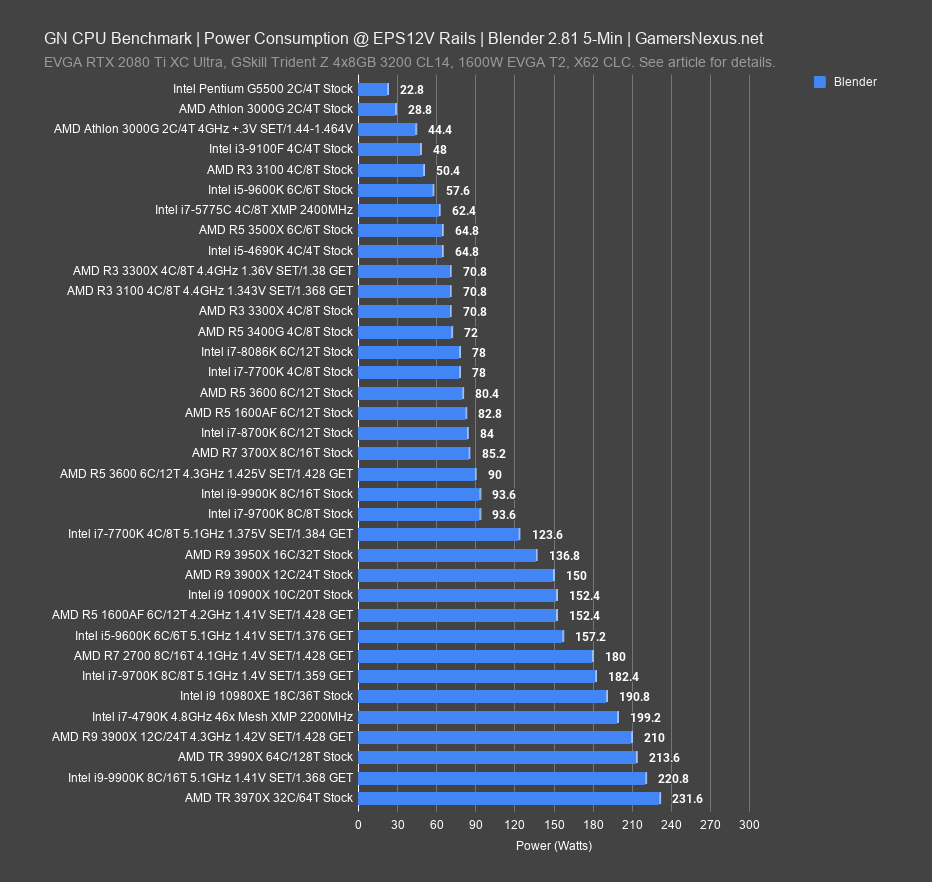
Power testing is among the last for the 3300X. We measure at the EPS12V cables instead of at the wall, so this is actual CPU power, not total system power, which is much more accurate and only misses out on VRM efficiency losses. Using Blender after 5 minutes, so after turbo duration expiry, the 3100 stock draws 50W, 3300X stock draws 71W, and the overclocks draw about 71W for both. Note that our overclock on the 3300X used a manual voltage tune that got it lower than the motherboard was often running when stock, so we were able to push higher performance at less power as a result. The 3100 increased by 20W over stock. The 7700K consumed about 78W for this test, with the 1600AF at about 83W.
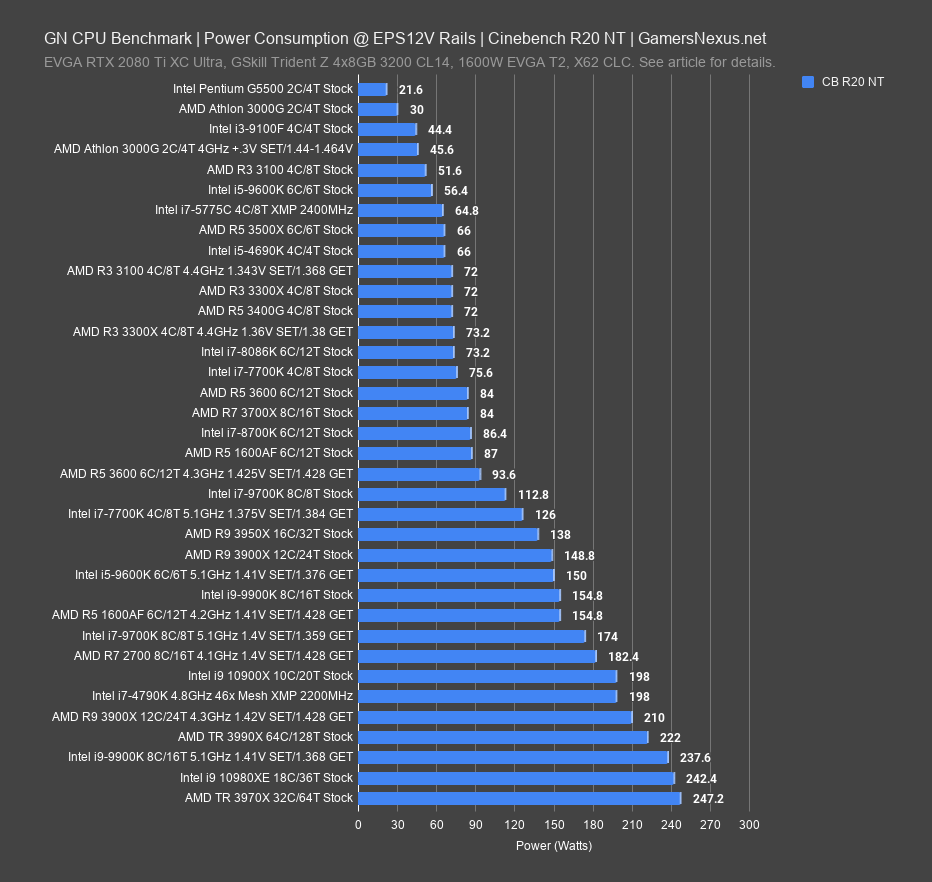
This power test shows Cinebench R20 multithreaded, which doesn’t last that long and expires within turbo limits for these Intel CPUs. The only real change here is in the Intel parts: For the shorter test, you’ll notice that the 9900K runs at 155W rather than 93W, the latter of which is, to Intel’s credit, actually close to its TDP number. The 9700K moves from the 90s to 113W. That’s because they’re within the PL1 and PL2 windows now and within Tau, so the power consumption is higher. No real change on the R3 parts.
AMD R3 3300X Stock vs. OC vs. 3100 Thermals
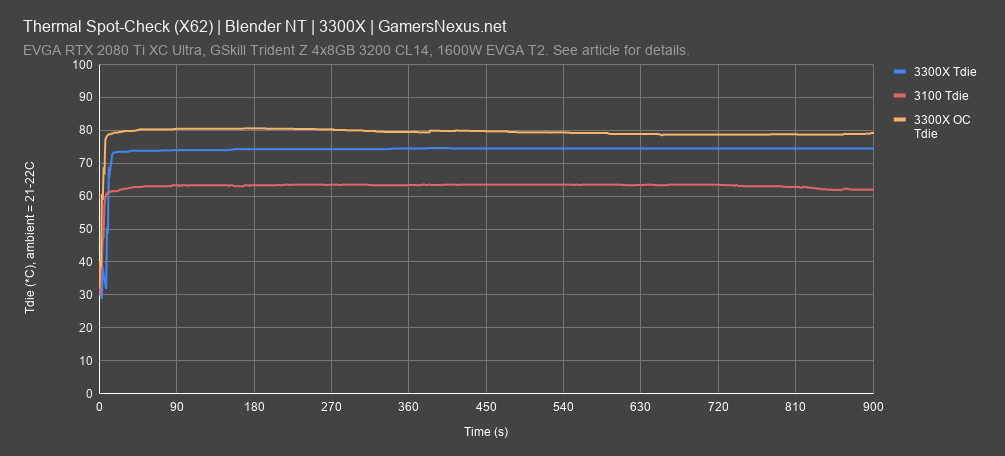
For a quick thermal reference, we plotted the stock thermal performance with auto voltage on the X570 Master. This is using an NZXT Kraken X62 standardized cooler at max pump and fan speeds on each CPU, running Blender until steady state is held. We have a full CPU cooler test bench if you’d like additional information on thermal performance, but we’ve simplified it for this coverage. The AMD R3 3300X quickly ramps and hits about 74 degrees Tdie. That’s not our usual delta over ambient, just the measured temperature. Ambient was within 21-22 degrees Celsius at time of test. For about 20W more than the 3100, these numbers make sense: The R3 3100 plots at about 64 degrees Celsius. The 280mm cooler helps with maintaining those higher boost clocks with Precision Boost 2, and that’s also why we use it in all testing except HEDT.
Plotting the 3300X OC, we ended up at about 79 degrees Celsius. This was with as low a voltage as we could tune -- 1.343V core SET, see GET in the power chart, but to go to 4.5GHz would have required an exponential voltage increase that would not be sustainable for daily operation.
Conclusion
The AMD Ryzen 3 3300X does actually offer a significant advantage over the R3 3100 in gaming and some production applications, like code compile, when both are at the same frequency. As stated earlier, this is contrary to typical AMD findings whereupon an X-SKU (3600X) and non-X SKU (3600) part can be made equally, nullifying any value of the $50 letter suffix if willing to overclock. That's because the CCX layout, stated amply by now, and the latency hit incurred from the 2+2 3100 configuration.
In this regard, we actually suspect that the R3 3100 will be a short-lived CPU, or one which is minimally somewhat buried by other options. The 3300X is good and competitive, and until the Intel 10 series, AMD is only competing with its own rarely available R5 1600 AF and, to a much lesser degree, its 3600. The 3600 is a worthy upgrade for people who are going to leverage the extra threads in non-gaming applications, but we really are at a point where it's safe to say that an R3 is enough for gaming. The 3300X holds it together well for a $120 part. This isn't our go-to, but for people with a stricter budget, we are confident in its recommendation. The 3100 is hard to buy given the "it's only $20 more" mentality that PC builders often have, but if the 3300X really is out of budget, the 3100 isn't horrible -- it's just disappointing in the face of the 1600 AF, which is objectively better almost universally and technically cheaper at $85. It's also a unicorn, has an invisibility cloak, and is never available, so you're relying on luck to be able to get one. AMD is still making and selling the 1600 AF to retailers, but they are beeing scooped-up by scalpers and sold at ridiculous prices. That leaves us with the 3300X and 3100.
It's weird. It's like reviewing the 7700K again, except the price and the company are both flipped upside down. We don't really have any Intel parts worth comparing to, so you're looking at AMD up-and-down the product stack until hitting the 9700K and 9900K. We'll see what the 10-series does.
Editorial, Testing: Steve Burke
Editorial, Testing: Patrick Lathan
Video: Keegan Gallick, Andrew Coleman