We’re reviewing the NVIDIA RTX 3080 FE today, where new testing methods for pressure analysis, acoustics, and game benchmarks are all in place. We also have a separate upcoming piece involving Schlieren photography of the RTX 3080 FE card, but we can show a short clip of that here as a preview. More on that soon. These cards are so complex -- especially thermally -- that the hardest part was figuring out how to segment the content in a way that’s usable and also possible to complete. Today, our focus is on rasterized games, hybrid rendered games, and path-traced games, alongside basic thermals, acoustics, pressure, power, and coldplate flatness. We have a separate piece going up today for a tear-down of the RTX 3080 (but a quick note that we finished all testing prior to the tear-down, as always). We’ll have more on PCIe generation results, but rest assured that our benchmarks use the best-performing bench, and more thermals.
Note: This is a transcript from our video review of the NVIDIA RTX 3080 Founders Edition card. You can watch that here (or embedded below). We also have a tear-down video coming up.
If you would like to learn about our new GPU testing methodology, we have a video on the channel here.
We’re not going to write much of an overview of the specs here because, frankly, I’m at 60 hours worked in 3 days, and this is the last part of the job before it’s all done. If you’d like the specs and the brochure, we would recommend our original news writeup, which is published in written form here. The RTX 3080 is a $700 card, and the Founders Edition with its flow-through cooler launch today. Partner models -- those by EVGA, ASUS, Gigabyte, et al. -- launch tomorrow (September 17) at 9AM Eastern. We will be reviewing the Founders Edition card here, but we know there are a lot more requests for specific tests with this video card. We’ll be following-up on those throughout the week. It may be helpful to check our recent architecture video for additional information on the Ampere GPUs at a lower level.
We’d like to quickly address one point before proceeding: A lot of commenters have expressed concern about the 10GB framebuffer on the RTX 3080, remarking that 10 is lower than 11, and therefore somehow worse than the 1080 Ti or 2080 Ti. A few reminders: First, when you use software (like GPU-Z -- which is great software and which we highly recommend), it will give you the “allocated VRAM,” but not necessarily the engaged or utilized VRAM. If you plug in a 12GB FB card and play a game, that game might tell you that it’s “using” 11GB,” and could cause you to suspect that this is close to capacity. In reality, it’s requesting that memory, but not actually utilizing it. Further still, memory capacity is very rarely the issue for gaming -- it’s more often that you’re running into memory bandwidth issues first, or maybe even some other part, like ROPs limitations.
See the methodology video above for information on how we conduct this testing and with which platforms we run it. We apologize for any typos -- it’s been a long week.
Contact Pressure Testing
We’re going to start the review with thermals, acoustics, and the cooler, since that’s a huge point for this Founders Edition design. The tear-down will be done in a separate video, filmed prior to this review, and will go live later today. Let’s start with a look at the pressure map for the cooler.
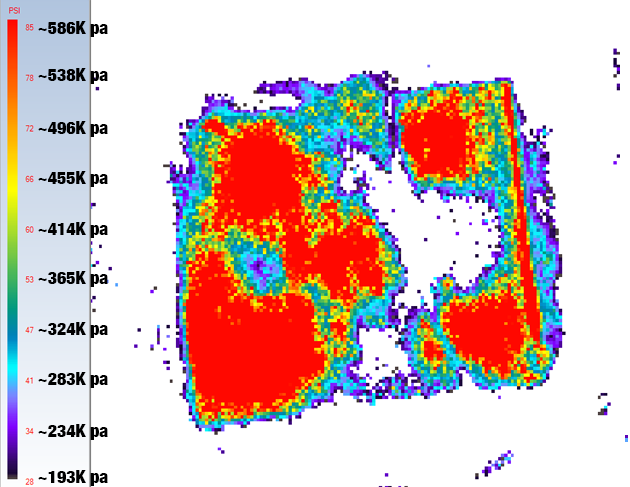
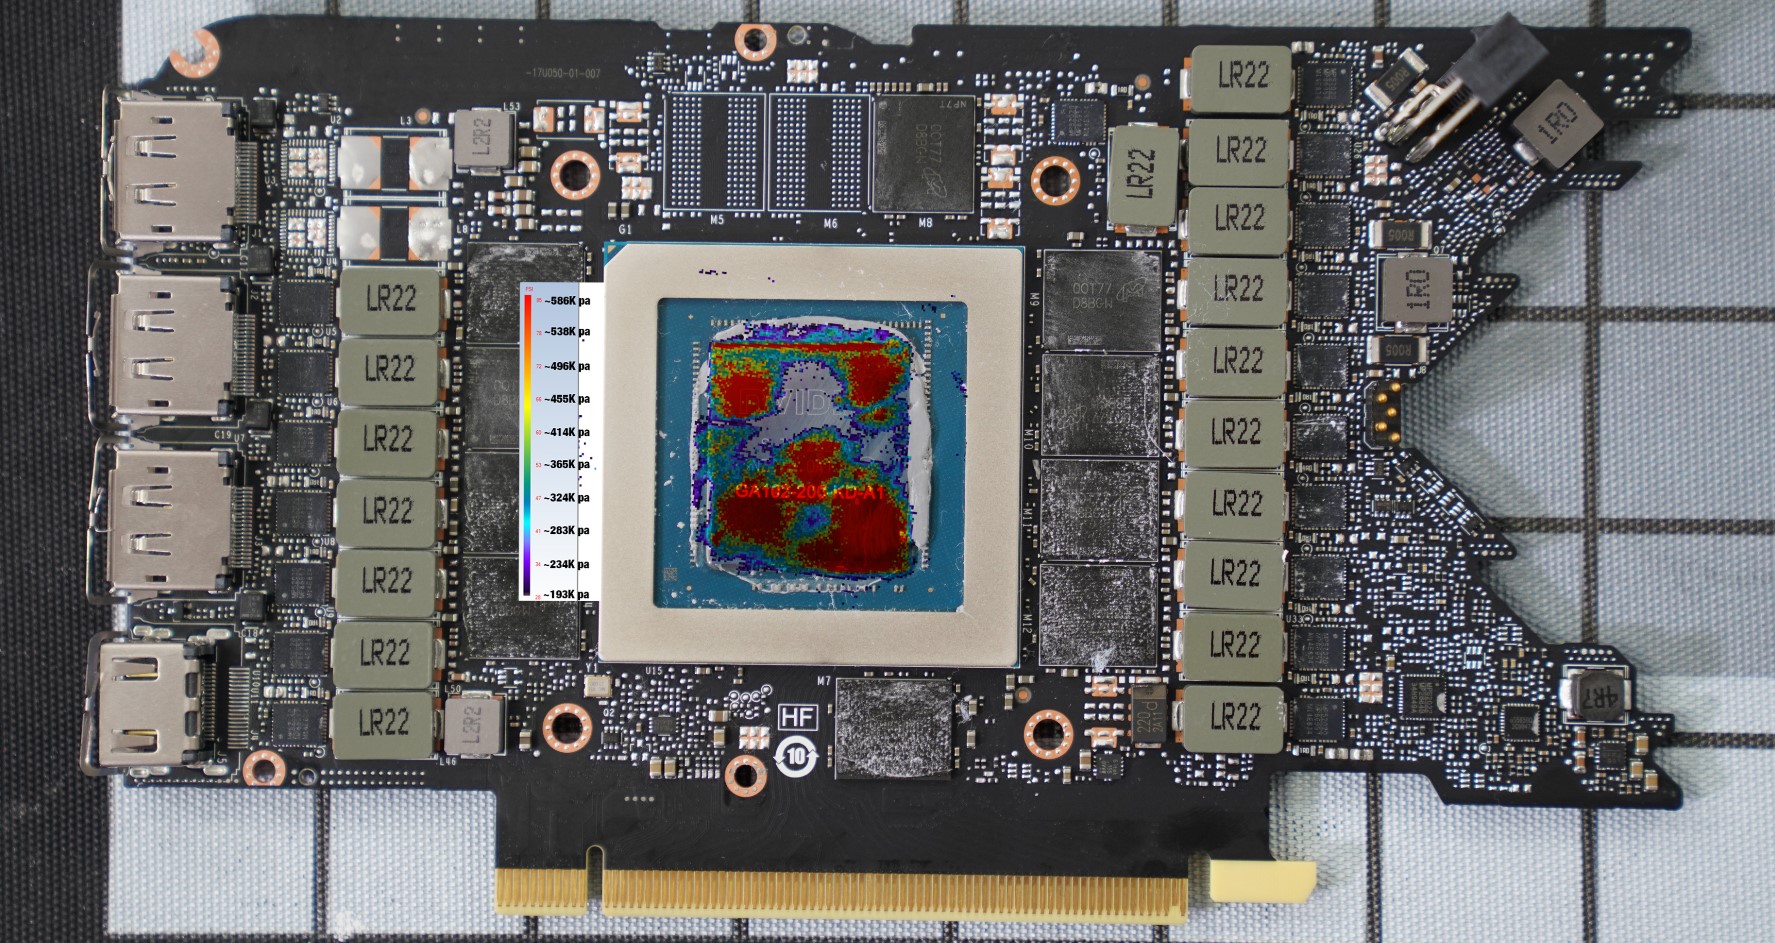
A flat and flush coldplate is key to good thermal performance; it doesn’t matter how good a cooler is if you can’t get it to mount flush with the silicon it’s cooling. We tried a few different pressure ranges for testing, but ultimately settled on this image as the best representation of cooler contact. We took 4 total pressure images and they were almost completely consistent each time. NVIDIA provided us a mounting pressure spec of 2.0 to 2.5 inch-pounds of torque, which we verified with a torque driver prior to disassembly, so we stuck to that same torque during reassembly for pressure testing. In this image, you can see that there are three key areas of improvement, but this is still better than we’ve seen for any other reference design we’ve tested from either NVIDIA or AMD. The three areas are circular in shape, which we can illustrate here. Typically, the vapor chamber columns apply more pressure to the silicon than the areas devoid of columns, but it depends on how the vapor chamber was formed. It’s possible that the columns are crimped slightly inwards, but we’d need a higher sample size to know. We actually made a vapor chamber at Cooler Master’s factory before, and part of the approach involves a sintered powder for conduction and a column of copper to give it strength and improved performance. You can see that in this clip, where a tool is used to align the vapor chamber underside with holes for the columns, which are poured in and shuffled into place. NVIDIA’s FE contact plate has room for improvement, but remains one of the better solutions we’ve seen. Vapor chambers are harder to get flat than traditional coldplates and heatpipes.
Coldplate Flatness
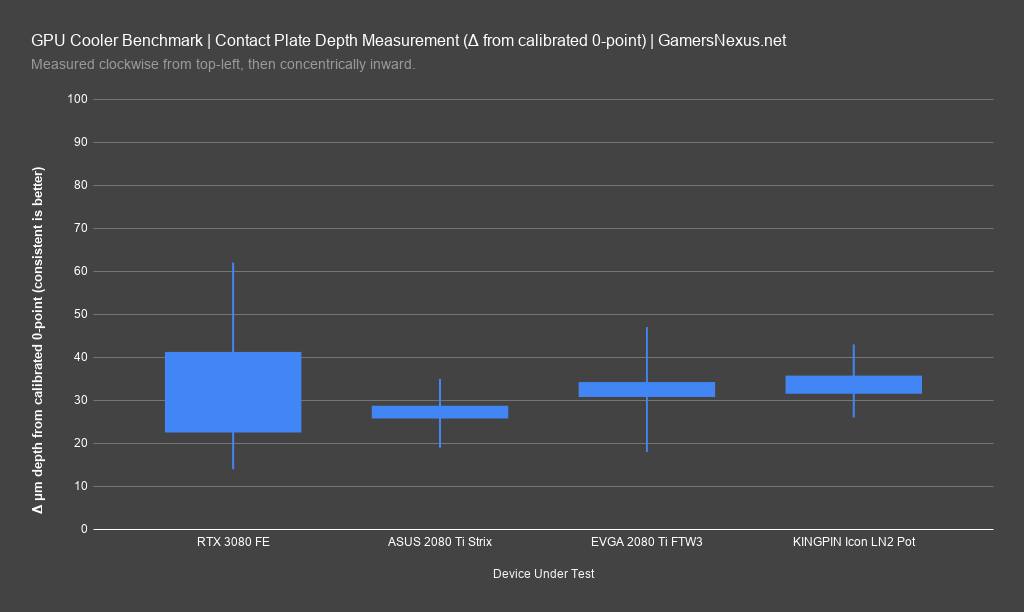
As a reminder, the pressure test isn’t a heightmap, but purely a pressure map. We have a different test for height and flatness. This chart uses a specialized depth testing tool that measures from a known 0-point to the coldplate. We spot-tested about 40 locations on the contact area of the plate for depth in microns. Ideally, this would be highly consistent for best contact. The RTX 3080 FE had a minimum depth measurement of 14 microns and a maximum of 62, with its median at 41 microns. The results aren’t terrible -- we’ve seen a lot worse in CPU coolers -- but we really need to test some other RTX 30 cards for better perspective. Thus far, the results are worse for the vapor chamber than for coldplate and heatpipe solutions, but that’s expected. That doesn’t mean it’s a worse cooler necessarily, because there’s a tradeoff for flatness with the vapor chamber that isn’t easy to account for. The Strix 2080 Ti and FTW3 2080 Ti are significantly more consistent in coldplate flatness, with medians at about 29 microns and 34 microns, respectively. The range is also reduced, improving die-wide consistency for thermals. The KINGPIN Icon LN2 pot was also lying around, so we tested that. It’s similar in median flatness to the FTW3, fittingly so, but is more consistent in its range than the FTW3 or FE cards.
RTX 3080 Frequency-Thermal Response
Let’s look at frequency, then thermals, then noise. Games will be after that.
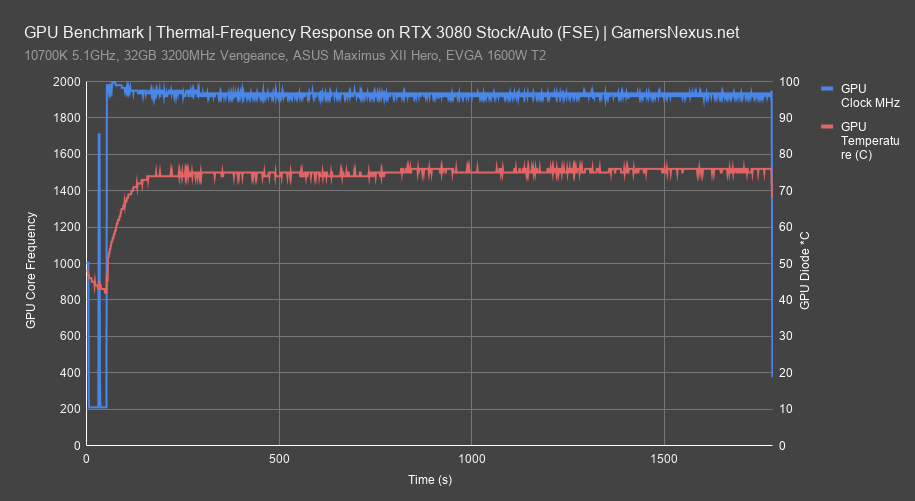
For frequency logging, we observed an initial peak frequency of 1980MHz, with GPU Boost scaling that down quickly to 1950MHz, and then about 1930MHz over the course of the test. Like previous NVIDIA GPUs, every 5-10 degrees lower will grant you a frequency bump in the range of 10-25MHz, depending on where you are on the scale. Remember that “temperature” isn’t just some Firestrike score: It is entirely predicated on fan speed, which itself is contingent upon VBIOS thermal targets for the core. In other words, the fans only spin at a given speed to maintain a simple temperature target in firmware programming. Here, it seems that NVIDIA has configured the FE card to stay in the range of 75 degrees Celsius. Our ambient temperature for testing was 21 degrees. We need RPM and acoustics for a full picture.
RTX 3080 Fan RPM-Thermal Response
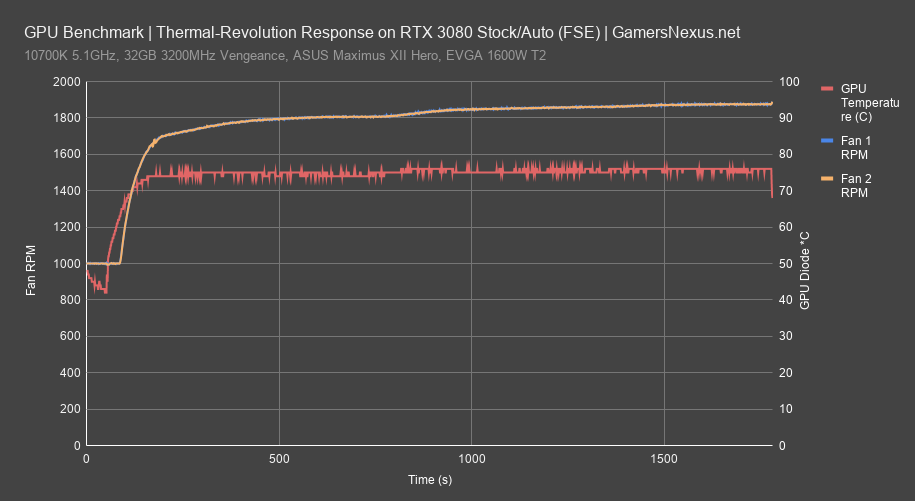
Here’s the same workload, but with fan RPM plotted against thermals. At around the 800-second mark, you can see a slight 1-2-degree blip in GPU thermals that is quickly negated. That’s because the fan speed ramps here, and with relatively low hysteresis in the VBIOS, the fans respond quickly. They end up settling at around 1900RPM to maintain 75 degrees in this scenario, but that will change with any user-defined temperature targets or extraneous considerations, like poor ventilation if you don’t follow our case buying advice. In this test, the fans are about the same speed, but we noticed some other scenarios where they ramp asynchronously in order to minimize harmonics caused at certain RPM ranges.
Noise Level vs. Fan Ramp & Temperature
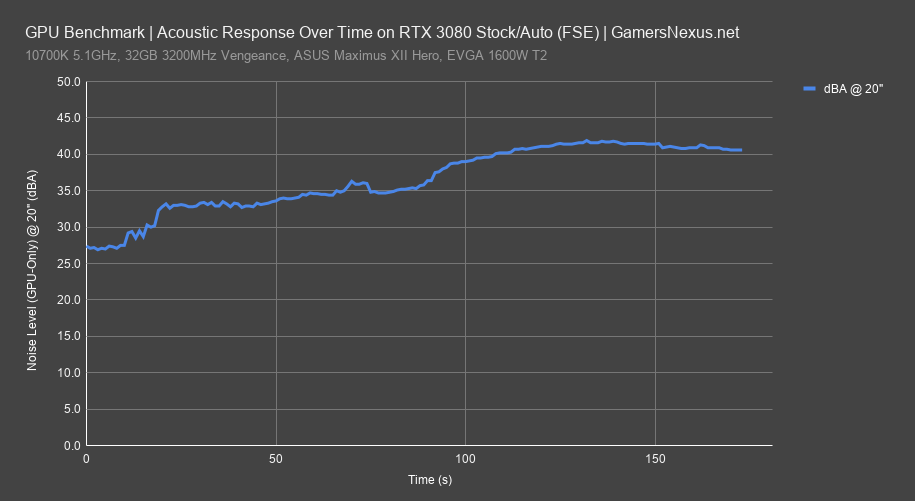
Here’s some obscenely cool data that we’ve started collecting -- you probably won’t see this stuff many other places. This looks at the decibel level for card volume under a ramping workload to 100% GPU load -- similar to what a game would do. In this scenario, you can see our noise floor is around 26-27dB when no load is present, then the card ramps to about the 32-33dBA range at initial load. Once the GPU temperature starts getting above 60 degrees Celsius, we see a more rapid ramp -- this is present at around the 70-second mark, where it ramps and then backs off temporarily, then ramps again. Typically, we find that a change in noise of about 3dBA is the most noticeable to the user, while anything within +/-3dBA from the current reading is imperceptible to people who aren’t focusing on strictly noise. The end ramp is around 41.8dBA, in this instance. We’ll get a number for RPM in a second. The hysteresis appears relatively low on this FE VBIOS, so the ramp is overall gradual except for the very beginning.
Noise Levels vs. Fan Curve
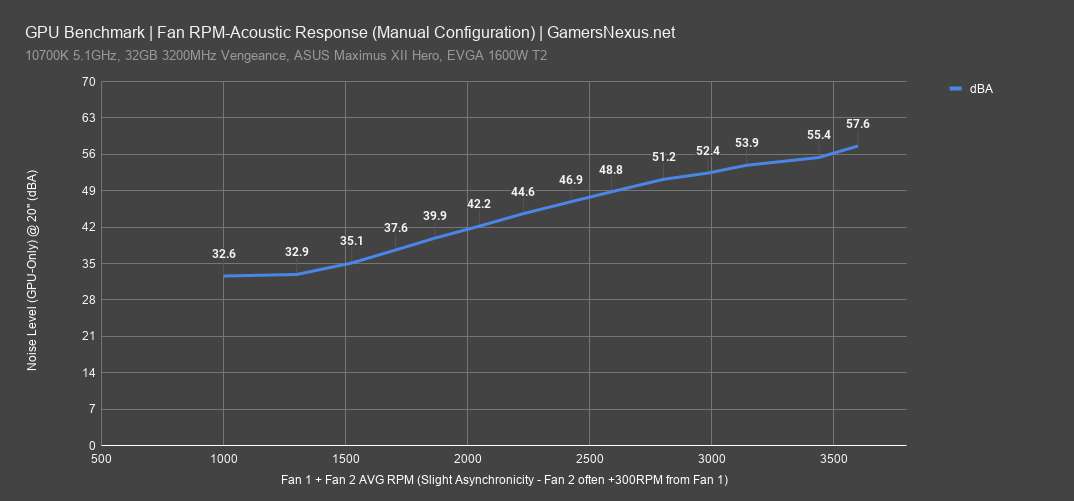
Here’s the noise level at given points along the fan speeds. The fan RPM bottoms-out at about 1000 on each fan. Due to slight asynchronicity of the fans to mitigate harmonics, we’ve averaged the two fans against the horizontal axis. The noise starts at around 32.6dBA in our test environment and at this distance, with 40dBA around 1880RPM for our testing. That’s the number we’ll use for noise-normalized thermal comparisons versus partner model 3080s; without this number, you don’t get a useful depiction of cooler efficacy. At 100% speed -- which was only ever encountered when manually configured -- we hit 57.6dBA.
Separate content piece on thermals vs. RAM temperature & CPU temperature (check back for that)
Games
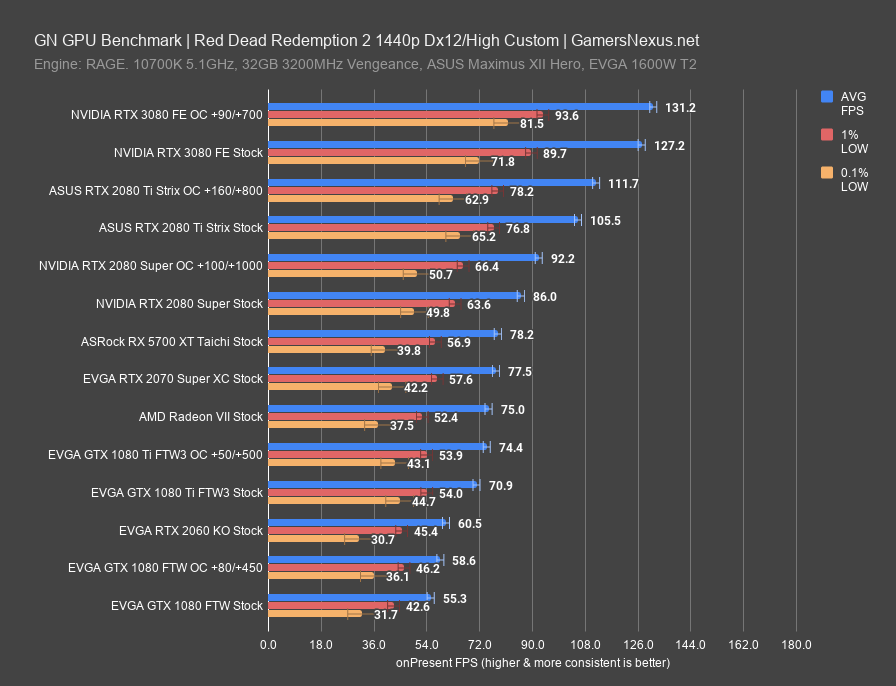
Red Dead Redemption 2 (Dx12) - 4K
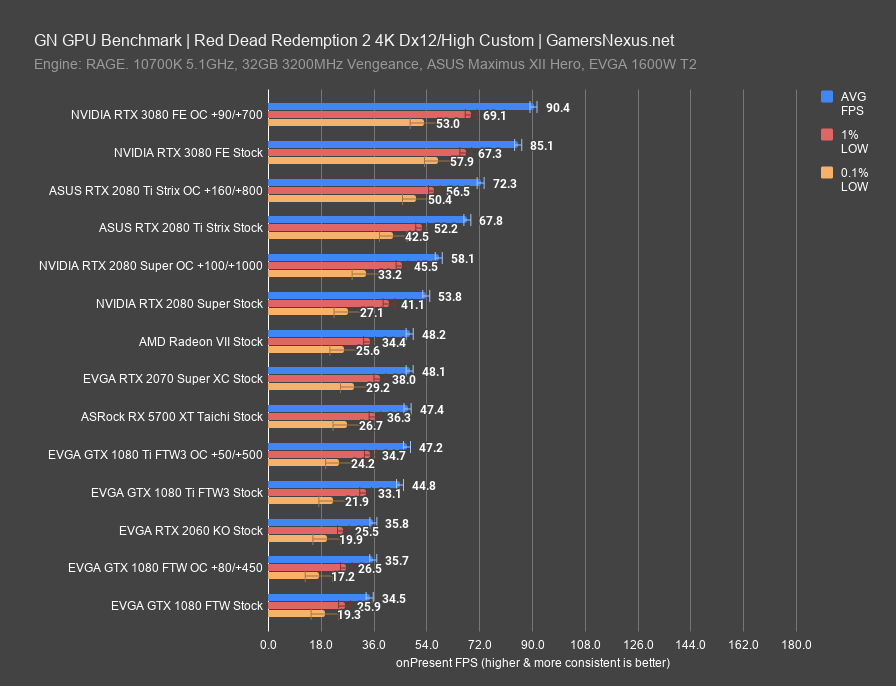
We’ll start off with Red Dead Redemption 2 at Dx12. Scaling in Vulkan is similar. At 4K and with custom high settings, the RTX 3080 FE establishes an 85FPS AVG baseline, with low at 67FPS 1% and 58FPS 0.1%. Overclocking didn’t get us much as we were power limited with the default NVIDIA VBIOS, but this is where partner cards will shine. We gained about 6% from the overclock. The 3080 FE leads the 2080 Ti Strix stock card’s 67.8FPS AVG result by 25.5%, it leads the 2080 Super stock’s 54FPS AVG by 58%, the 2070 Super by about 77%, and it’s about 90% ahead of the 1080 Ti. As for the 5700 XT, which is the only real AMD part currently sold that’s anywhere close, that’s at 47FPS AVG and about half the performance of the 3080 FE.
Red Dead Redemption 2 (Dx12) - 1440p
Here’s 1440p. Tested at 4K, the 3080 held a lead over the 2080 Ti of 25.5%, but that lead drops to 20.6% here. The 3080’s 127FPS AVG allowed the overclock a gain of just 3.1% here, halved from before. The clocks don’t help as much at this lower resolution. Leadership versus the 1080 Ti FTW3 stock is 80% here, down from 90% at 4K. Versus the 2080 Super, the 3080 stock leads by 48% (as opposed to 58% previously). Things are trending down at lower resolutions, so keep that in mind if you’re not running 4K. The 5700 XT runs 78FPS AVG, allowing the 3080 a lead of 63% -- but it’s not like the 5700 XT competes at the same price class as the 3080. AMD just hasn’t given us anything else to show.
Red Dead Redemption 2 (Dx12) - 1080p
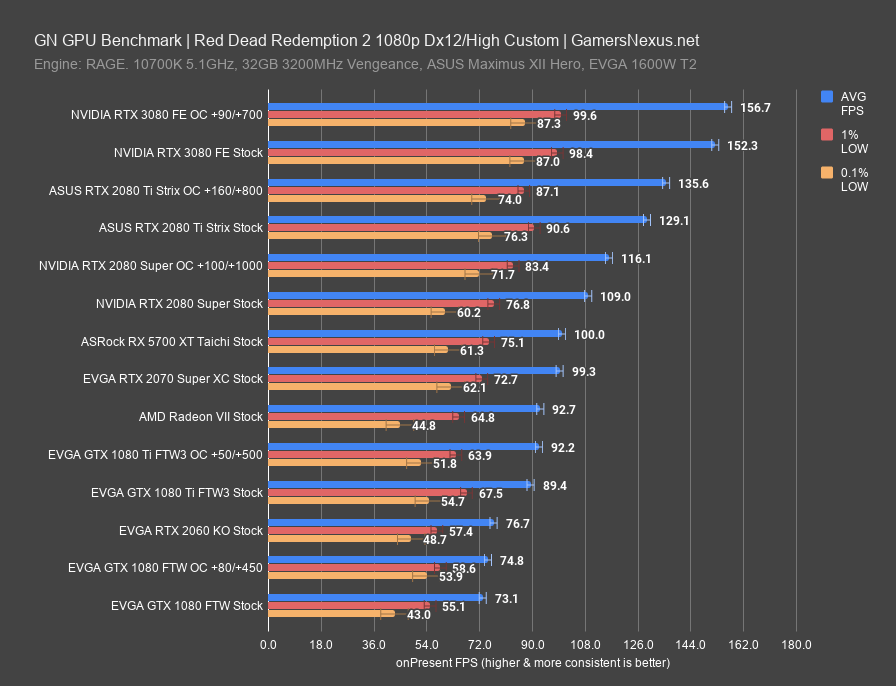
At 1080p, the 3080 ran 152FPS AVG, with some room to scale shown by the OC at 157FPS AVG. That’s not a worthwhile OC, but it does show we’re not fully capped when stock. This game is largely GPU-bound. The 3080 leads the 2080 Ti by 18% here, down from 25% at 4K; it leads the 1080 Ti by 71%, down from 90% at 4K.
RDR2 - Vulkan vs. Dx12
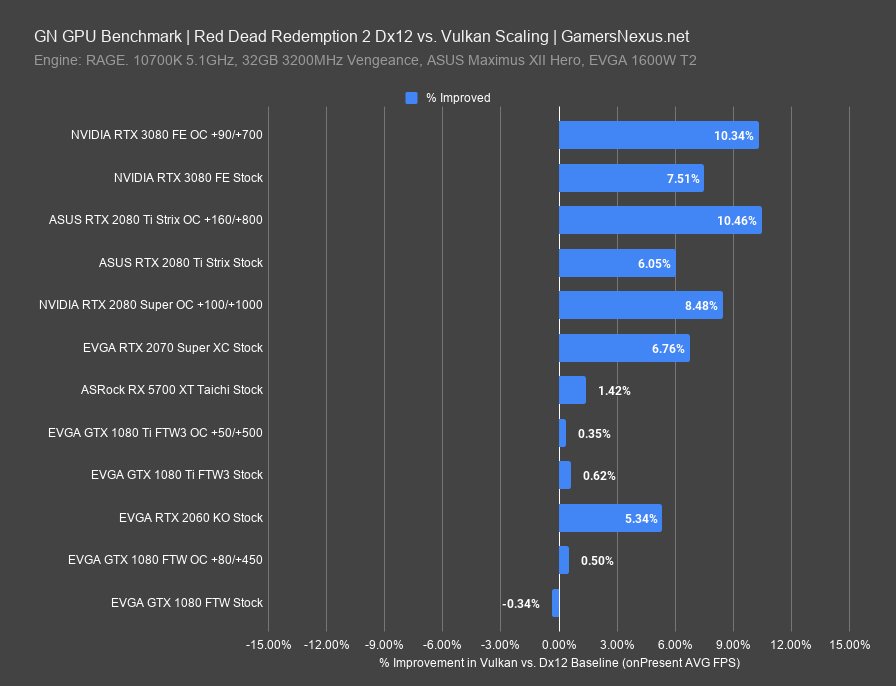
Very quickly, here’s a Vulkan vs. DX12 chart for Red Dead 2. This is showing percent improvement with Vulkan versus DirectX 12. If you see a negative number, that means Dx12 ran better than Vulkan on that device. These percentages are purely self-referential for each card and have no relation to the other cards. The 3080 FE stock had an 8% improvement against itself with Dx12, or 10% when overclocked. The 2080 Ti saw almost the same type of scaling. Vulkan appears more sensitive to clock increases in this game. Interestingly, the Pascal generation -- we can highlight the 1080 Ti and 1080 non-Ti entries -- and the 5700 XT both show no real change between the two.
Rainbow Six Siege - 4K
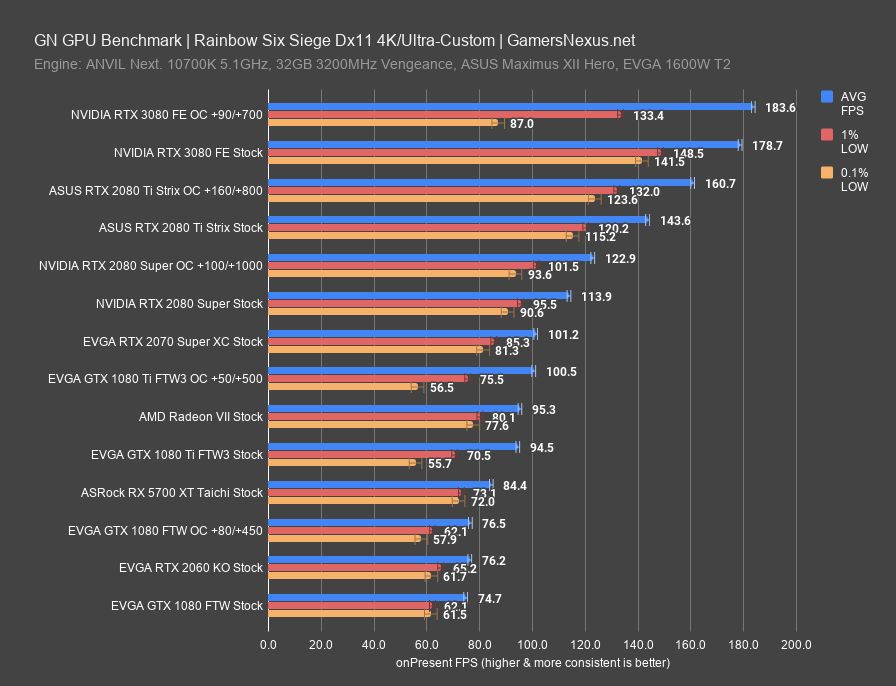
Rainbow Six Siege is new to our bench and is next, run with Dx11. At 4K and with ultra settings, the RTX 3080 ran at 179FPS AVG, or 2.7% higher with an overclock. The 2080 Ti Strix ran 144FPS stock, with a much bigger 12% gain from an overclock. OC-to-OC, the 3080 leads by 14%, or 24% stock. The lead against the 114FPS AVG 2080 Super is 58%, or again about 90% versus the 1080 Ti, at 94FPS AVG here. The 5700XT is around the same spot, and that’s for one of the highest pre-overclocked models you can get. Frametimes scale evenly with averages in this game. Let’s look at the source of that huge 0.1% low for the overclock.
Rainbow Six Siege - 4K Frametime Plot
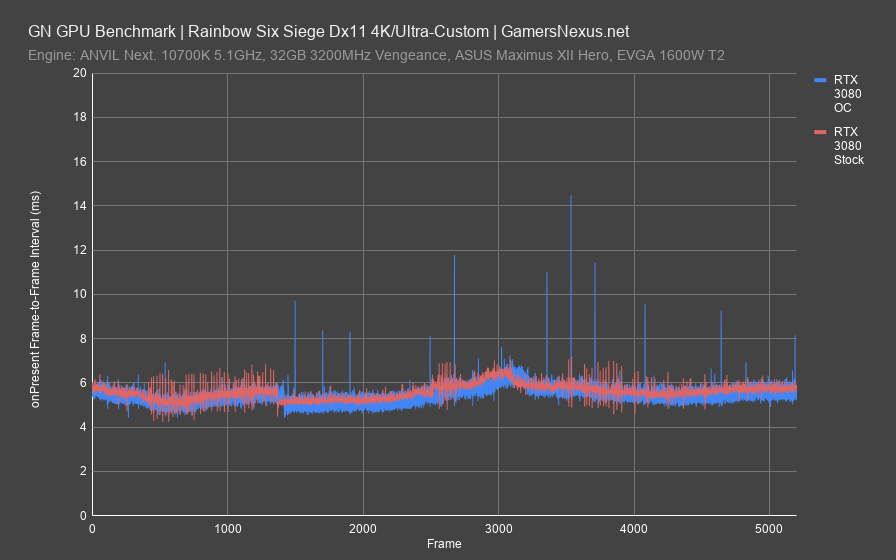
Here’s the frametime plot. As always, lower is better, but more consistent is best. With the OC line, you’ll see significant excursions from the mean several times throughout the test, and that’s because the overclock wasn’t as stable as it appeared in some other game benchmarks. Like most overclocks, this isn’t universally a good OC. The stock result is much flatter -- with matching bounces in the first 1500 frames -- and is overall the better experience. Overclocking on our 3080 FE wasn’t great, but maybe higher power limit partner models will be better.
Rainbow Six Siege - 1440p
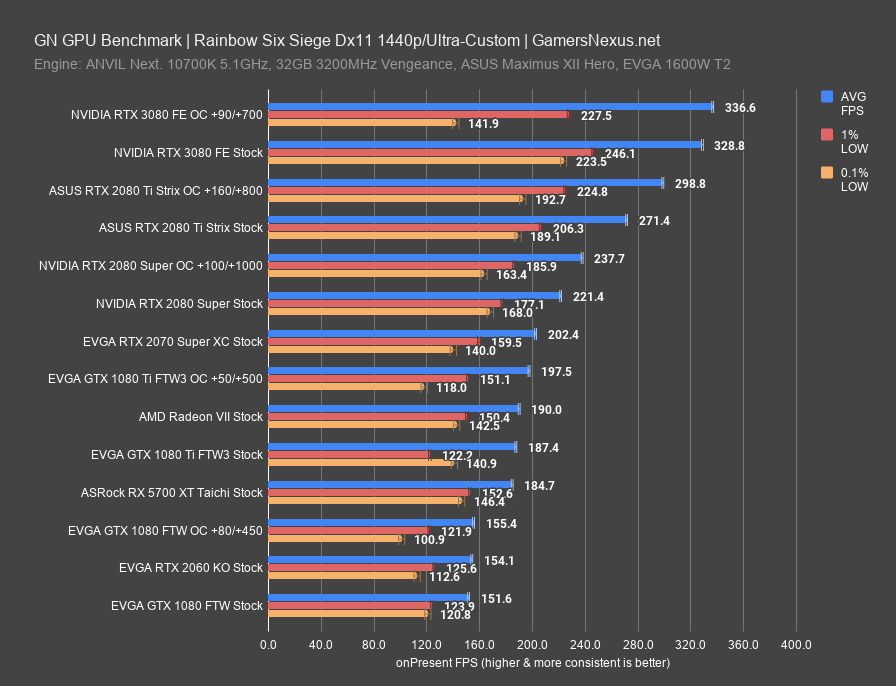
1440p had the 3080 at 329FPS AVG, the 2080 Ti at 271, the 1080 Ti at 187, and the 5700 XT at 185. That establishes a reduced 21% lead over the 2080 Ti and 76% over the 1080 Ti, down from 90%.
Rainbow Six Siege - 1080p
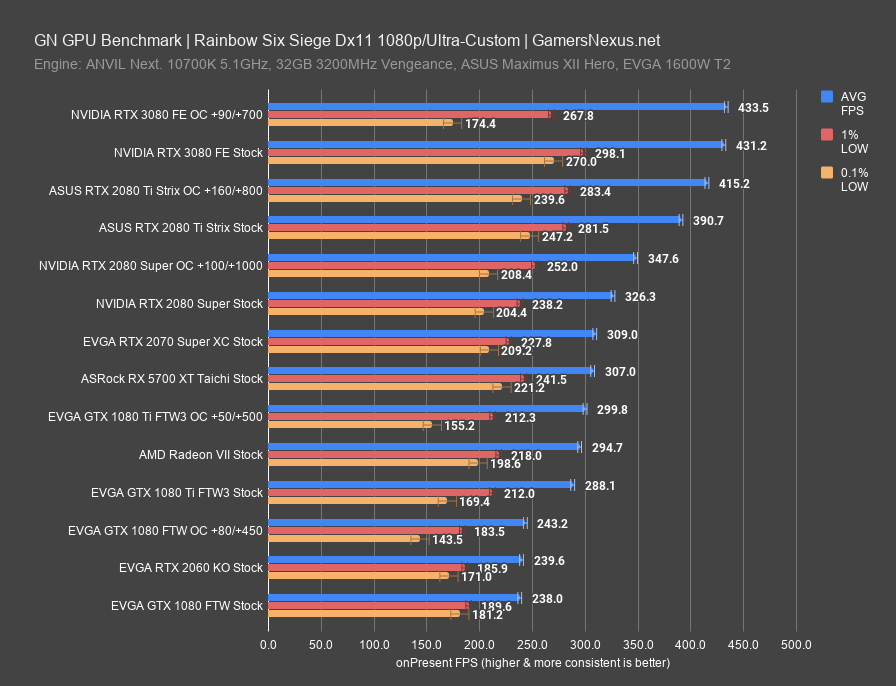
Briefly, here’s 1080p. The 3080 OC is still unstable, shown here in 0.1% lows, and therefore not a good OC for this game. The stock result runs 431FPS AVG, 10% over the 2080 Ti and 50% over the 1080 Ti FTW3. That said, we’re also hitting CPU limits at some point, since we’re only at 1080p. The 5700XT offers similar performance to the 2070 Super, and the Radeon VII gets left behind by AMD’s 5700 from 4 months later.
Shadow of the Tomb Raider
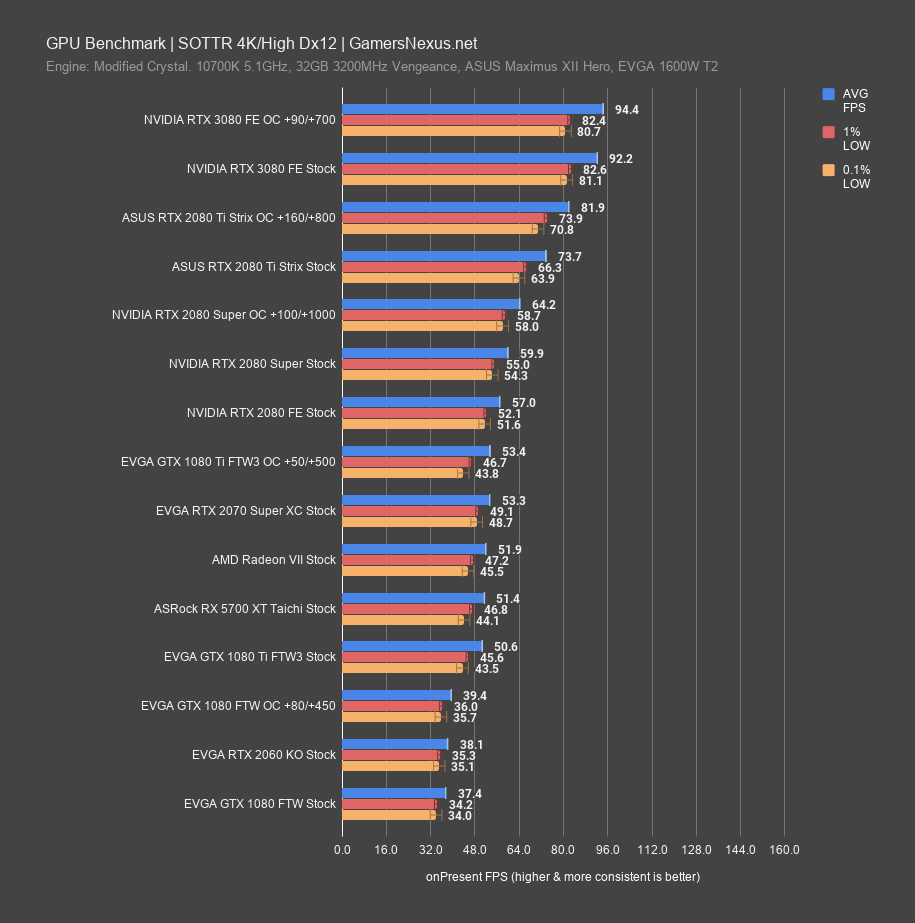
Shadow of the Tomb Raider at 4K has the RTX 3080 FE at 92FPS AVG, with an overclock proving stable but pointless. The lead over the 2080 Ti OC is minimal, at 13%, and so panic-selling 2080 Tis for $500 is probably not the best idea. The lead over stock is 25%, consistent with previous results. At this point, we’ve established an obvious trend: We’re 25% over the 2080 Ti, 73% over the 2080 Super stock and similar for the 5700XT, and 82% over the 1080 Ti. We won’t discuss each game in as much detail now that we have a trend.
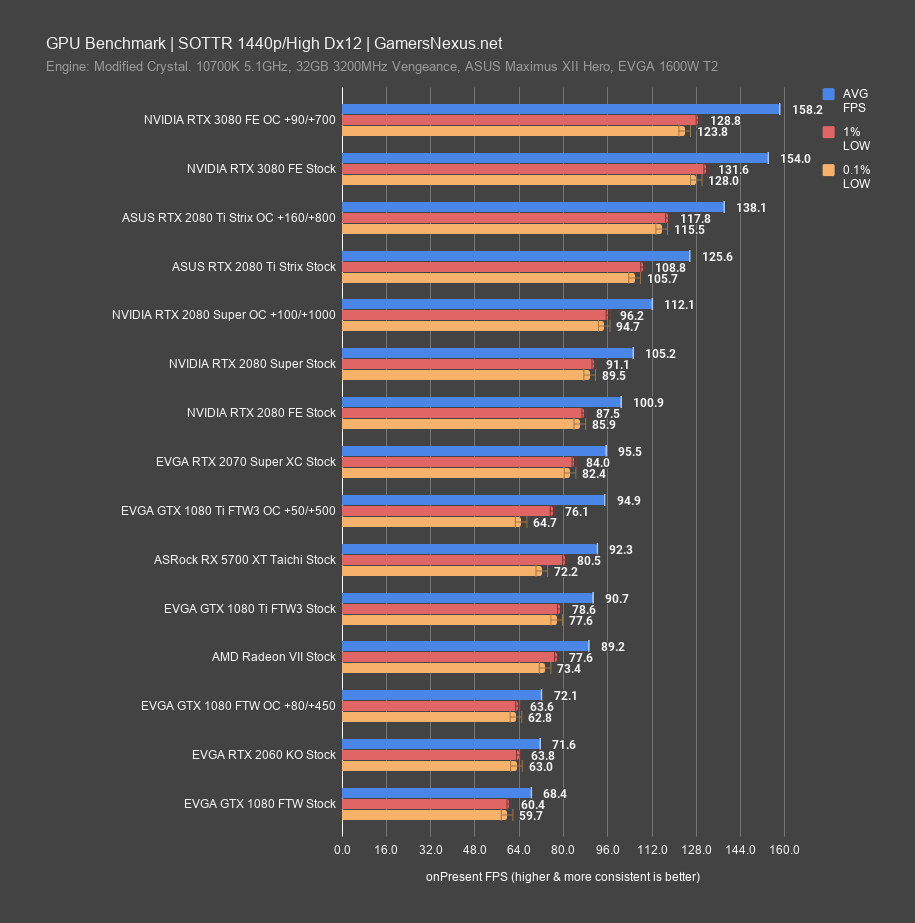
At 1440p, the 3080 runs 23% faster than the 2080 Ti, 70% higher FPS than the 1080 Ti and 5700 XT, and 47% ahead of the 2080 Super. Next chart.
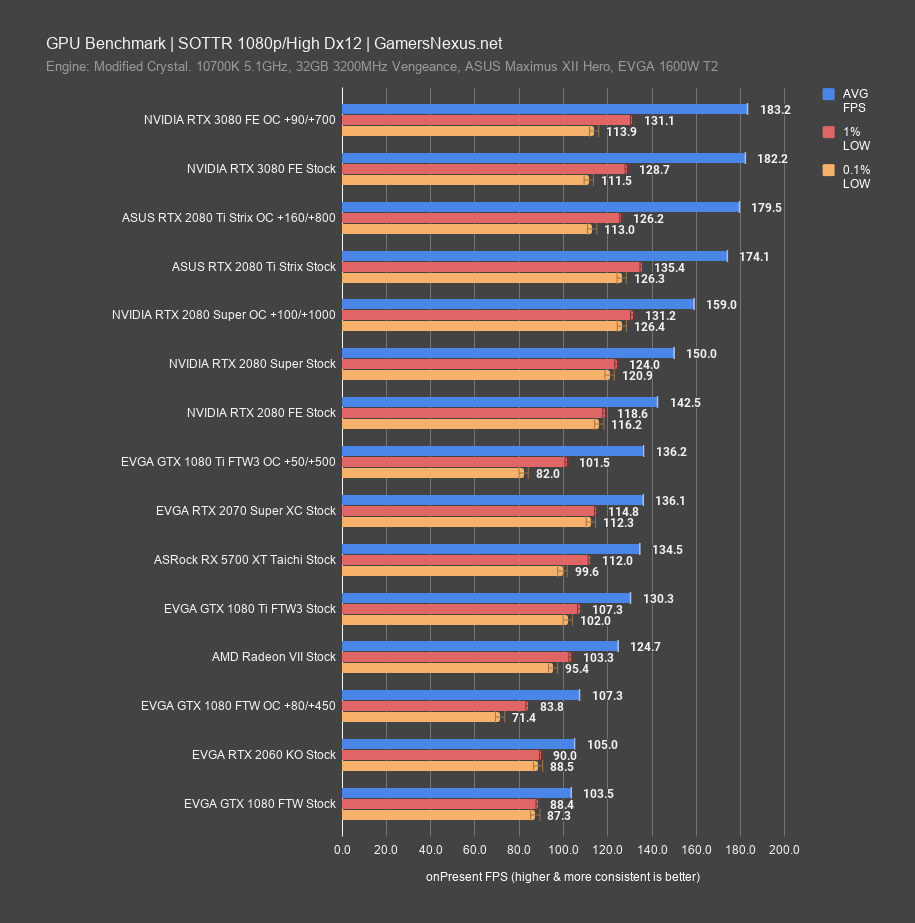
1080p is CPU-bound. This is clear for a few reasons -- like identical performance between the OC 2080 Ti and the 3080 -- but also because of the dropped lows on the cards bouncing off of the CPU bind. The chart is useless for comparison here, aside from maybe showing that you shouldn’t buy past the capabilities of your CPU or your intended resolution.
Microsoft Flight Sim - 4K/High
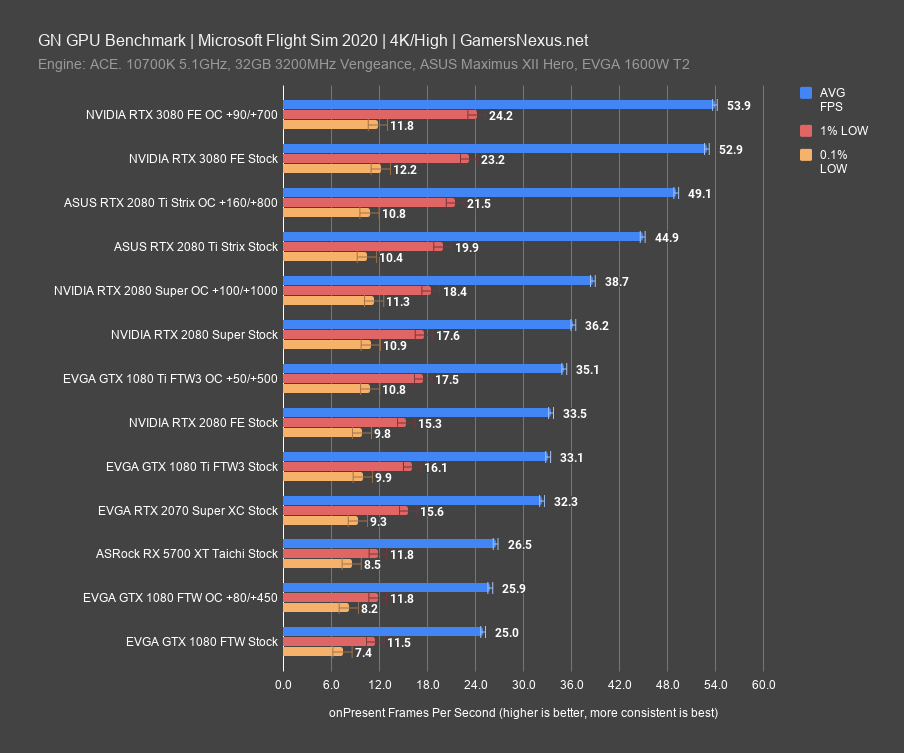
We’ll keep this one short. In our GPU methodology piece, we showed how Flight Sim isn’t scaling very well for GPU reviews using our current settings, and that’s because we become bound by a single thread hard at 1080p and 1440p. At 4K, we’re not CPU-bound. Yet, anyway. The 3080 leads the 2080 Ti by about 20% here, it leads the 2080 Super by about 46%, and the 1080 Ti by 60%. The 5700XT is close to the original GTX 1080 FTW, both of which are doubled.
F1 2019
This is where we would show F1 2019, but the game currently hates the RTX 3080 and we had constant crashing issues or failures to launch. For this reason, it’s been removed and gets a DNF score. It may work with F1 2020 -- we haven’t tested that. We are told that F1 2019 will work with launch drivers.
Horizon Zero Dawn
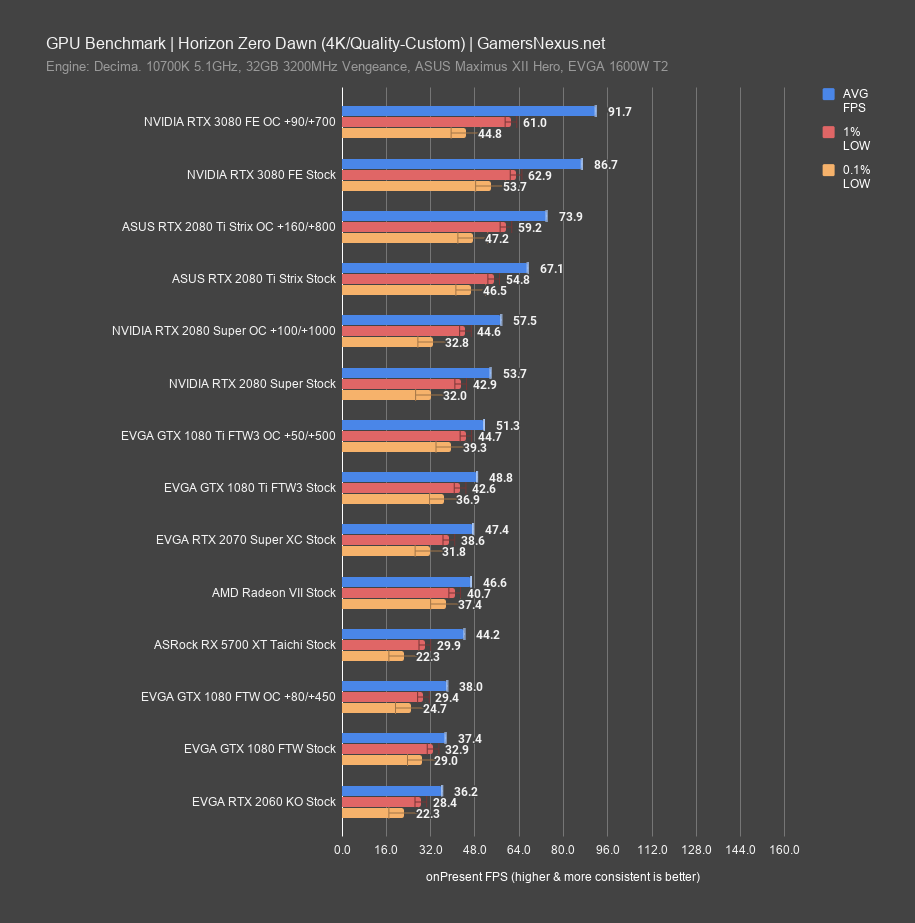
Here’s Horizon Zero Dawn at 4K. This one has the RTX 3080 OC scaling 6% over the baseline 87FPS AVG result, but again dropping some of the frametime consistency. The 2080 Ti OC’s 74FPS AVG result illustrates that you can get close-ish to 3080 performance with a little bit of work, while baseline allows the 3080 a more impressive 30% lead than in previous tests. The 2080 Super is led by 61%, the 1080 Ti is led by 78% here, less than in some other titles.
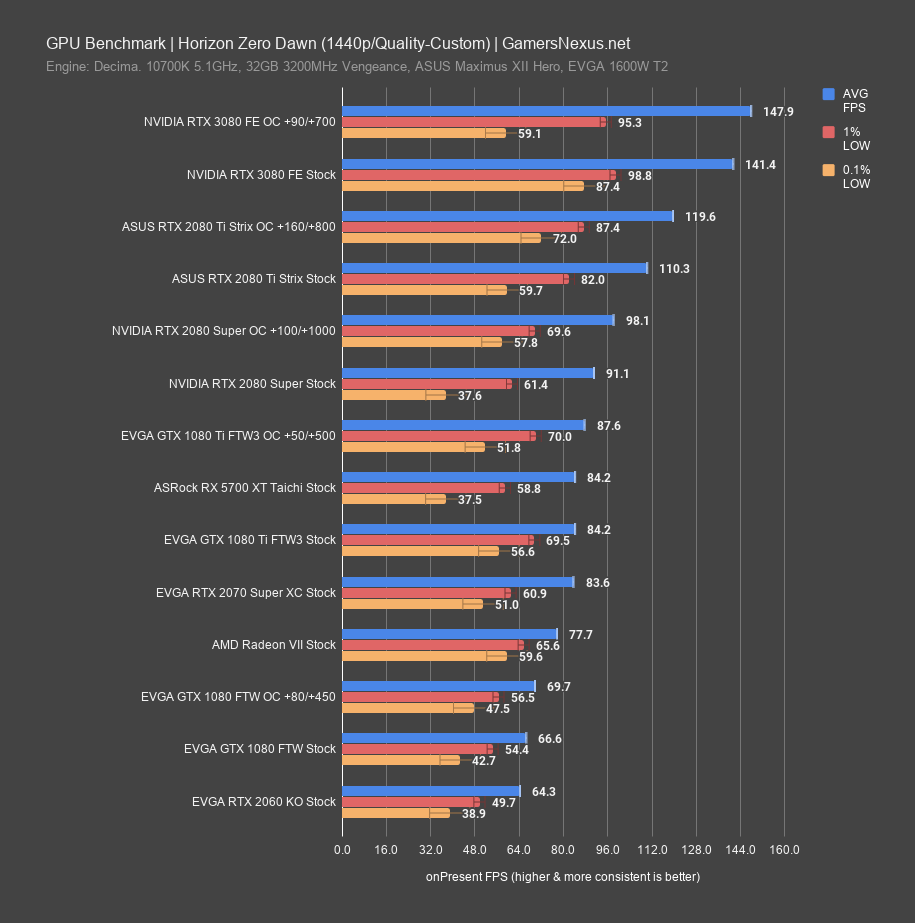
At 1440p, the 3080 OC lead is reduced to 4.6%, the 2080 Ti lead remains about 28%, and the 1080 Ti lead is reduced to 68%.
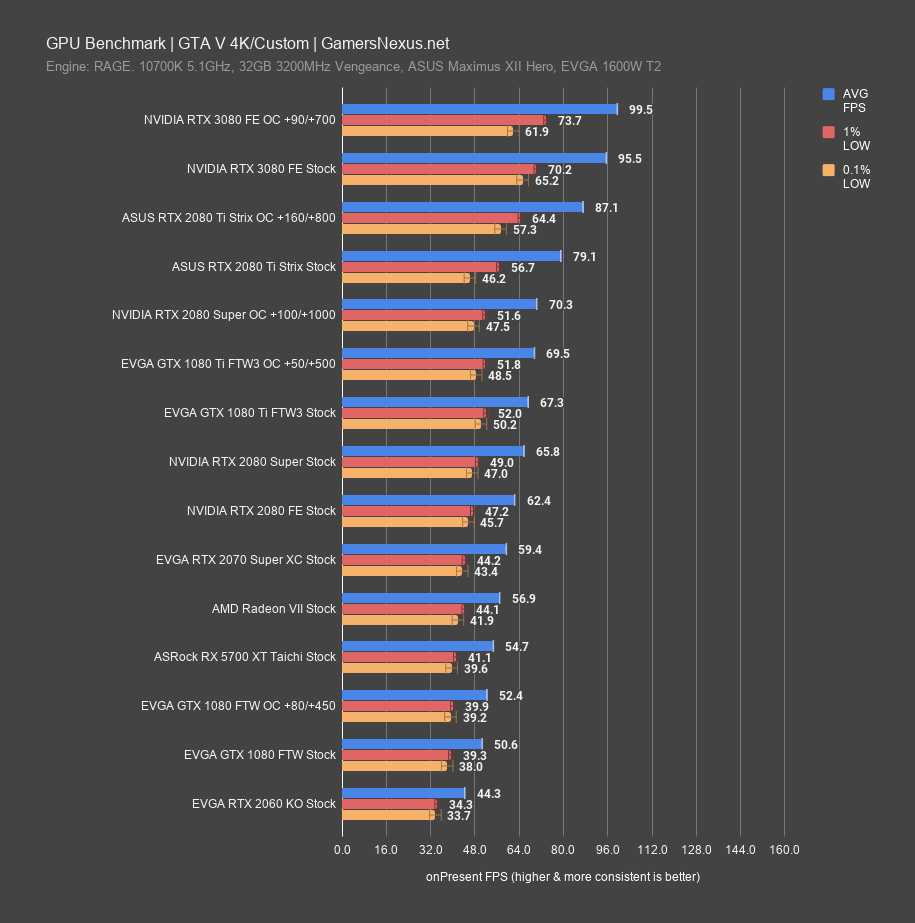
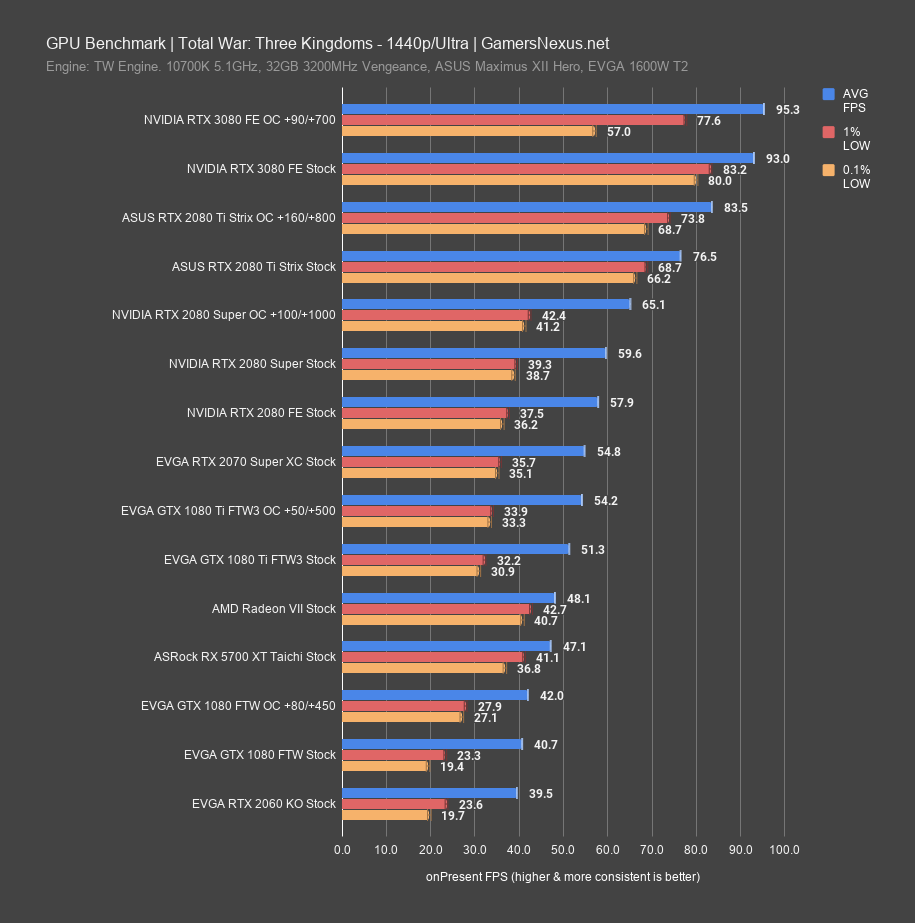
We’re going to quickly flash the next few games through. Pause if you care about any of them, but the percent scaling is similar. At this point, it’s a waste of everyone’s time to talk through the remaining 5 rasterized games at 3 resolutions each that we tested because we’ve established a predictable pattern. The hierarchy remains the same across the stack, plus or minus a few percentage points. We’d rather spend the air time on more interesting tests, like the thermals earlier in this review.
RTX Games
We’ll quickly go through some RTX results now, mostly useful for those of you who purchased 20-series cards and actually care to use RTX features. We aren’t putting as much focus on this right now, as it’s still not a primary usage mode for the cards, but this should be enough comparative information for you.
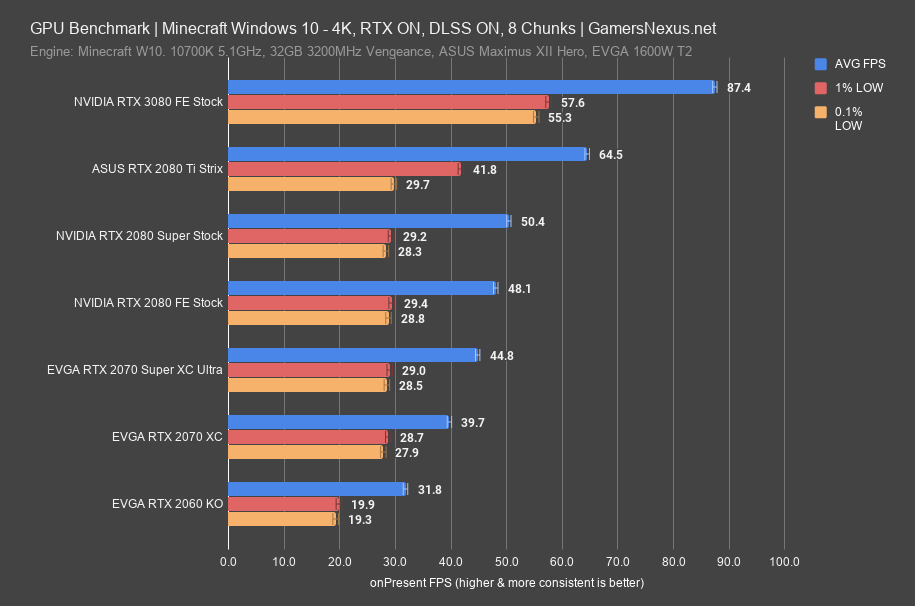
We’ll start with Minecraft RTX. The 3080 ran 87FPS AVG, leading the 2080 Tis’ 65FPS AVG by 36%. That’s a larger gap than we saw in the rasterization-only games, up from 25-30% previously. The lows are also significantly improved, disproportionately leaning positive on the 3080. The 2080 Super stock is led by 75% here, with the 2080 FE led by 82%. A few lower-end cards are also present. DLSS is on for all cards for this game, since Minecraft benefits from being visually predictable enough that DLSS doesn’t detract from the experience.
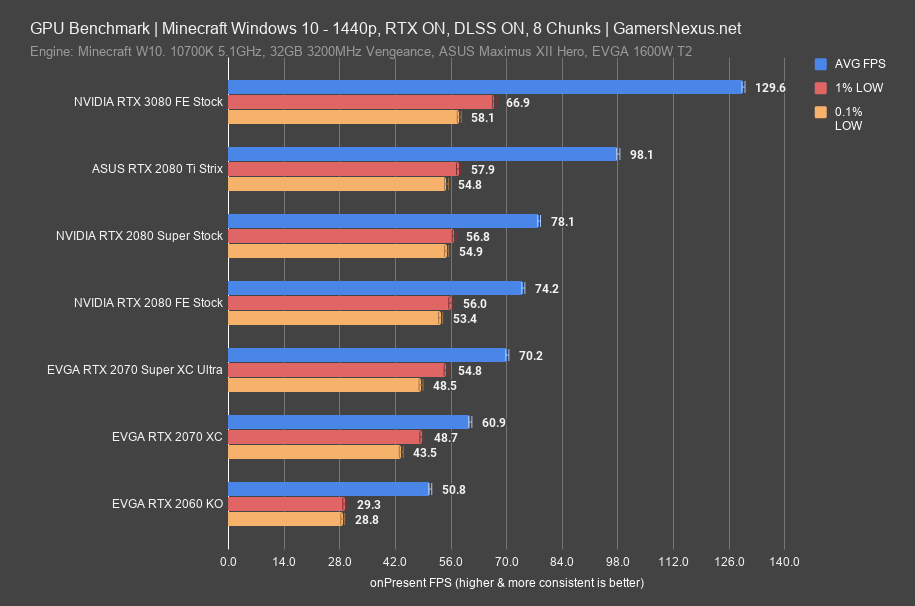
At 1440p, the 3080 runs 130FPS AVG, leading the 2080 Ti Strix by 32%, still above previous averages. The 2080 Super and 2080 FE are near one another, led by a split difference of 71%.
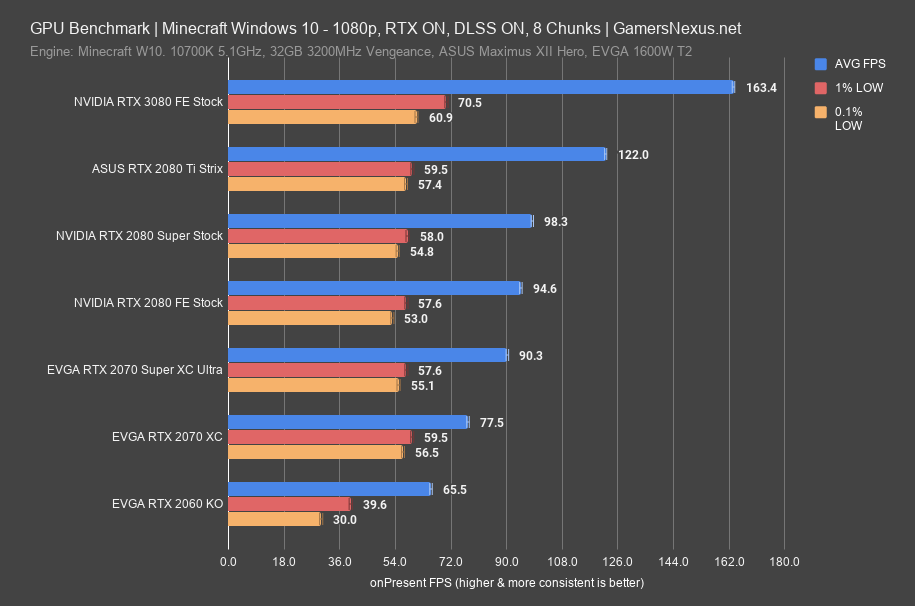
At 1080p, the 3080 FE gains to 163FPS AVG -- sadly, the highest we’ve seen in Minecraft RTX -- while still leading the 2080 Ti by 34%. The 2080 Super is led by 67%, so there’s stagnation in the gains versus the Ti and Super.
Control - 4K DLSS On
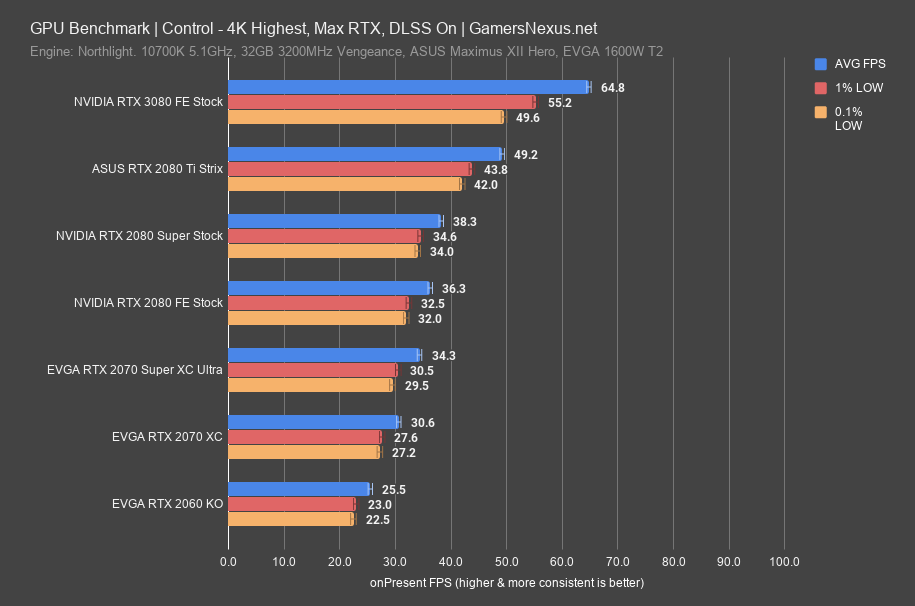
Control is next, tested with max RTX and DLSS on, but also briefly with DLSS off for comparison. At 4K and with DLSS on, the 3080 runs at 65FPS AVG, with lows consistently behind. The RTX 2080 Ti runs 49FPS AVG, allowing the 3080 a 32% lead. The 2080 Super and below are all under 40FPS AVG.
Control - 4K DLSS Off
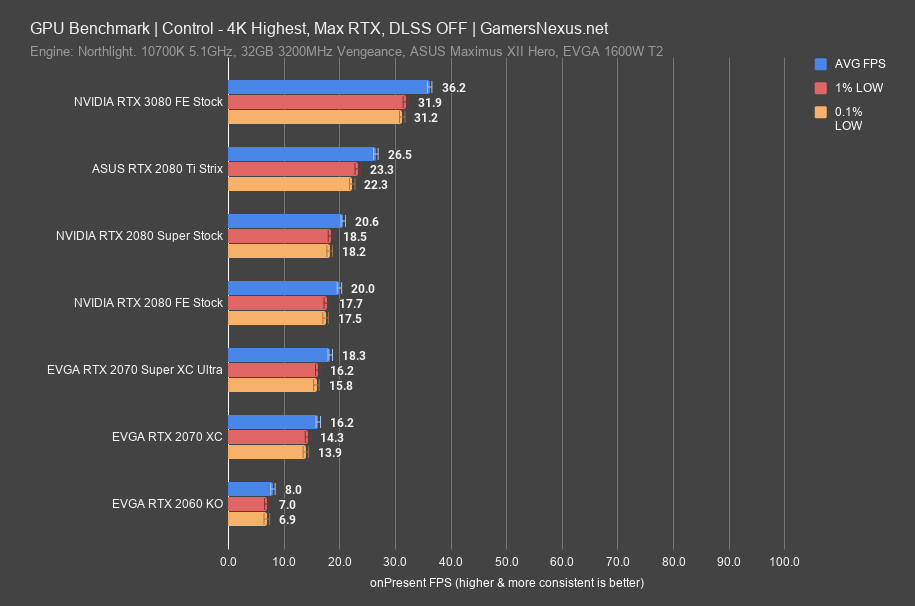
For perspective, here it is with DLSS off. The game becomes mostly unplayable at true, actual 4K with DLSS off. We’re only really flashing this through to provide perspective.
Control - 1440p DLSS On
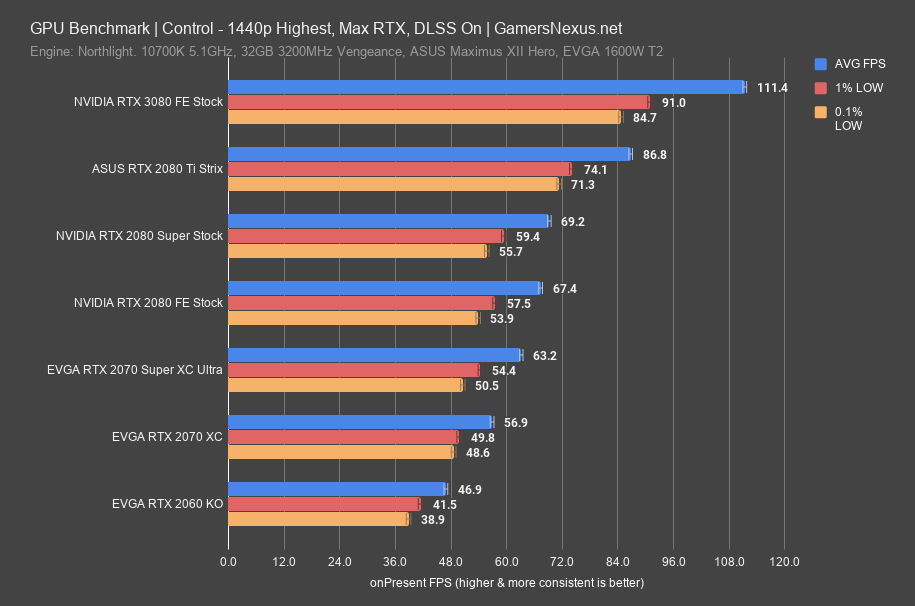
At 1440p, the 3080 runs 111FPS AVG, 28% ahead of the 2080 Ti Strix and about 63% ahead of the 2080 Super and FE.
Quake - 4K
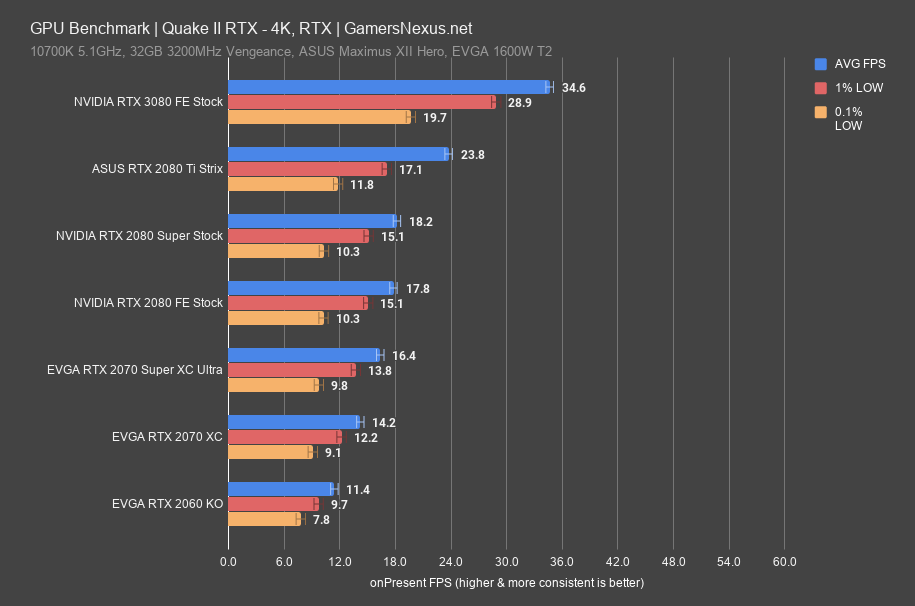
Quake II is next. It’s not quite there at 4K, but the interesting part is that the 3080 leads even harder than it did previously: It’s now at 45% higher average framerate than the 2080 Ti, or 90% ahead of the 2080 Super card, which is insane. This game is path-traced, so the difference in RT generations becomes apparent.
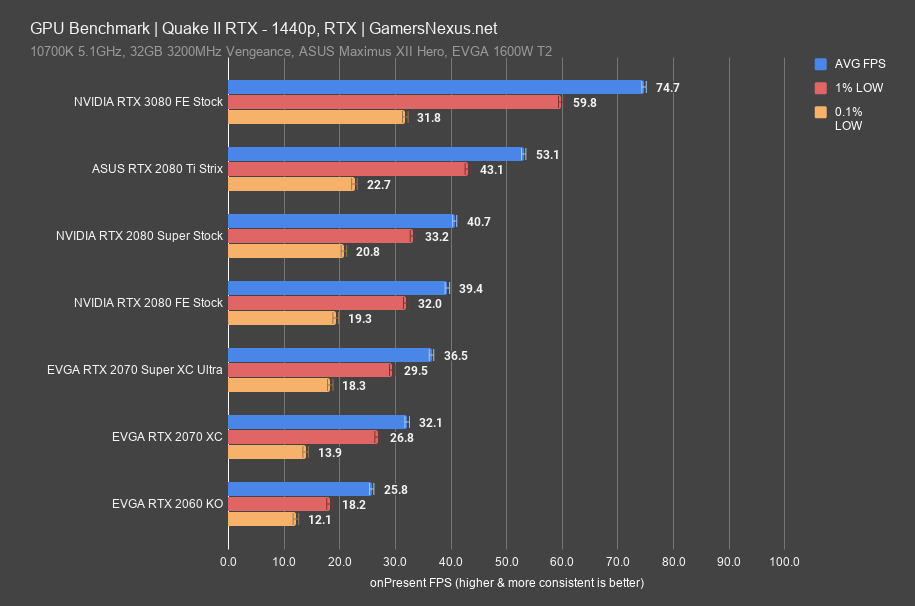
1440p sees a reduction in lead, because we’re stepping away from the memory bandwidth advantages afforded to the 3080.
We’re going to stop here for games. We also have Tomb Raider and 1080p results, but there’s too much other stuff to talk about.
Power Testing
Power testing is next. For over a year now, our power testing methodology has involved taking both PCIe cable draw and PCIe slot draw measurement with custom tools we built. This is not total system power and is instead total card power.
FurMark
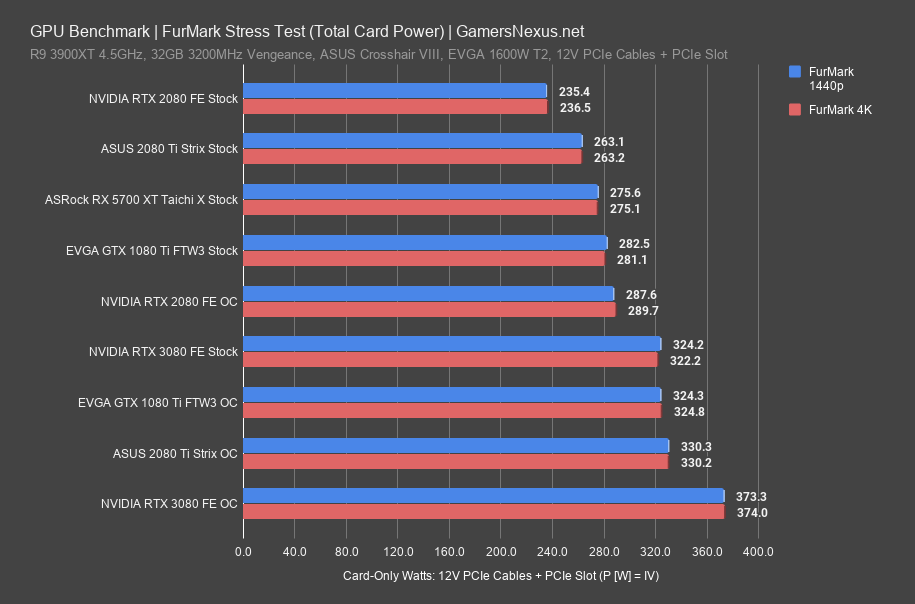
Starting with FurMark power virus tests, the RTX 3080 stock GPU consumed 323W total card draw, ahead of the 2080 OC by about 30-40W. The efficiency is way up here, despite power consumption also being up; for instance, the 1080 Ti consumed 325W when overclocked, and yet the 3080 stock card was routinely in the 70-90% uplift range versus this card. The 2080 Ti pulled 264W stock and 330W overclocked, for comparison, with the 2080 FE stock at 235W. With that 330W OC number, the 3080 was often still 10-15% ahead of the 2080 Ti OC while being a few watts lower, proving its efficiency improvements. To get the actual 2x perf/watt number marketed, you’d have to power limit them artificially to about 240W, so that scale converges towards the mean as power increases on the 3080.
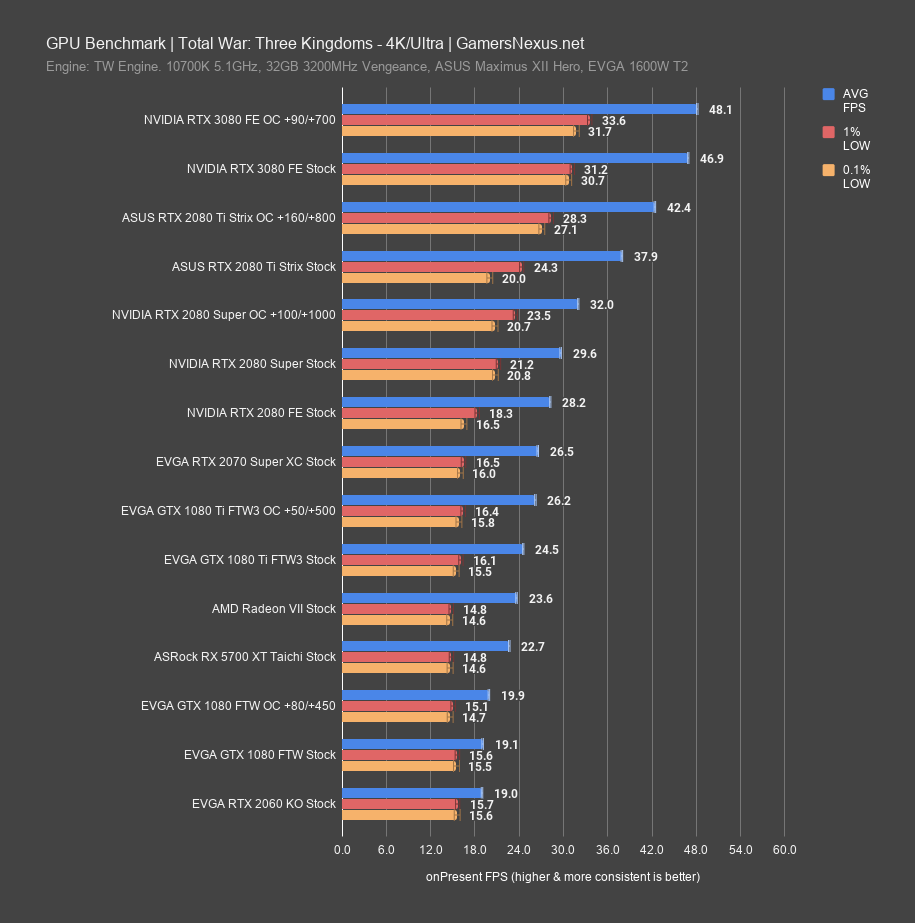
Total War: Three Kingdoms
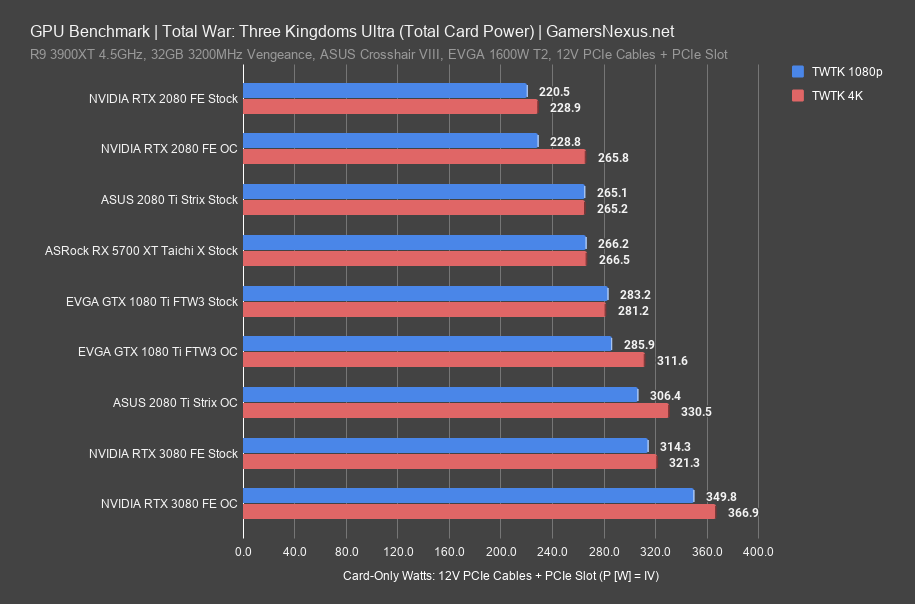
Three Kingdoms at Ultra is next, where these high-end cards struggle to even hit 60FPS at 4K. The 3080 FE OC draws 367W here, proving exceptionally inefficient as compared to its stock setting, particularly thanks to a lack in gains. The 3080 stock pulled 314-320W, with the 2080 Ti Strix overclock at 306-331W, depending on workload. That’s a lot of power to allow a 13% lead to the 3080 stock. The 1080 Ti stock card was closer to 283, illustrating how much more is being done per watt with this generation. The other two games we tested reflect these results, so we’ll skip them.
OC Stepping
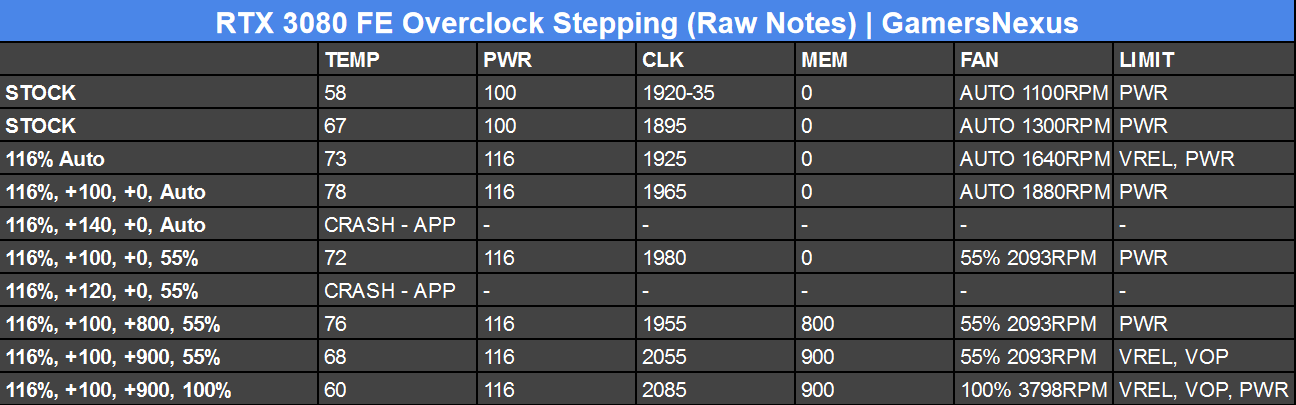
Finally, here’s an overclock stepping chart from our process of overclocking the 3080 FE card. This is all rough notetaking with the intention of quickly establishing a stable clock. We most commonly ran into power limits, so shunt resistor mods may help here. We also observed a regression in performance with the 100MHz core offset and 900MHz memory offset, falling below stock. You always must validate performance before committing to an OC. Our final setting was 90MHz core and 700MHz memory. Along the way, we observed a frequency regression of about 20-30MHz from a 10-degree increase in temperature, no other changes other than auto fan changes, and we also observed a maximum frequency of 2085MHz when at 60 degrees Celsius; unfortunately, this wasn’t stable for long-term use, and also required a 100% fan speed.
Conclusion
Sorry, it's too much to neatly pack into a few sentences and without any sleep to go. If you'd like a clean conclusion, check 26:11 in our review video. Otherwise, you'll just have to look at the data in this article!
Editorial, Testing, Test Lead: Steve Burke
Testing: Patrick Lathan, Mike Gaglione
Video: Keegan Gallick, Andrew Coleman