The test results are in from our post-review DIY project, which started here. Our goal was a simple one: As a bit of a decompression project after our 9000-word analysis of nVidia's GeForce GTX 1080 Founders Edition, we decided to tear-down the GTX 1080, look underneath, and throw a liquid block onto the exposed die. The “Founders Edition” of the GTX 1080 is effectively a reference model, and as such, it'll quickly be outranked by AIB partner cards with regard to cooling and OC potential. The GTX 1080 overclocks reasonably well – we were hitting ~2025-2050MHz with the FE model – but it still feels limited. That limitation is a mix of power limit and thermal throttling.
Our testing discovered that thermal throttles occur at precisely 82C. Each time the card hits 82C absolute, the clock-rate dips and produces a marginal impact to frametimes and framerate. We also encountered clock-rate stability issues over long burn-in periods, and would have had to further step-down the OC to accommodate the 82C threshold. Even when configuring the VRM blower fan to 100% speed, limitations were encountered – but it did perform better, just with the noise levels of a server fan (~60dB, in our tests). That's not really acceptable for a real-world use case. Liquid will bring down noise levels, help sustain higher clock-rates at those noise levels, and keep thermals well under control.
The video (Part 3) is below. This article will cover the results of our DIY liquid-cooled GTX 1080 'Hybrid' vs. the Founders Edition card, including temperatures, VRM fan RPM, overclocking, stability, and FPS. Our clocks vs. time charts are the most interesting.
Building a GTX 1080 Hybrid Pt 3: Performance Results
Final Assembly Photos
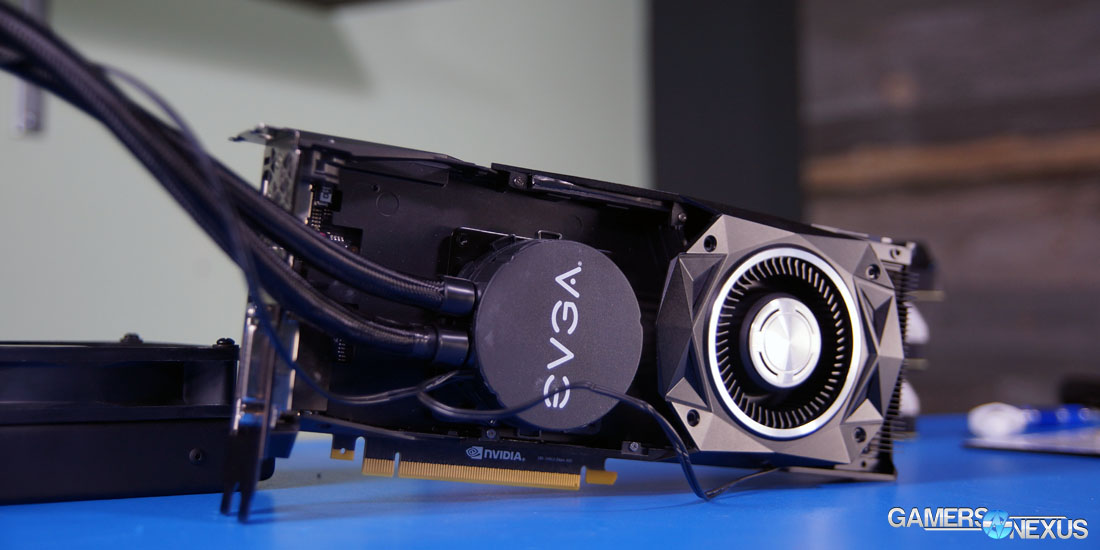
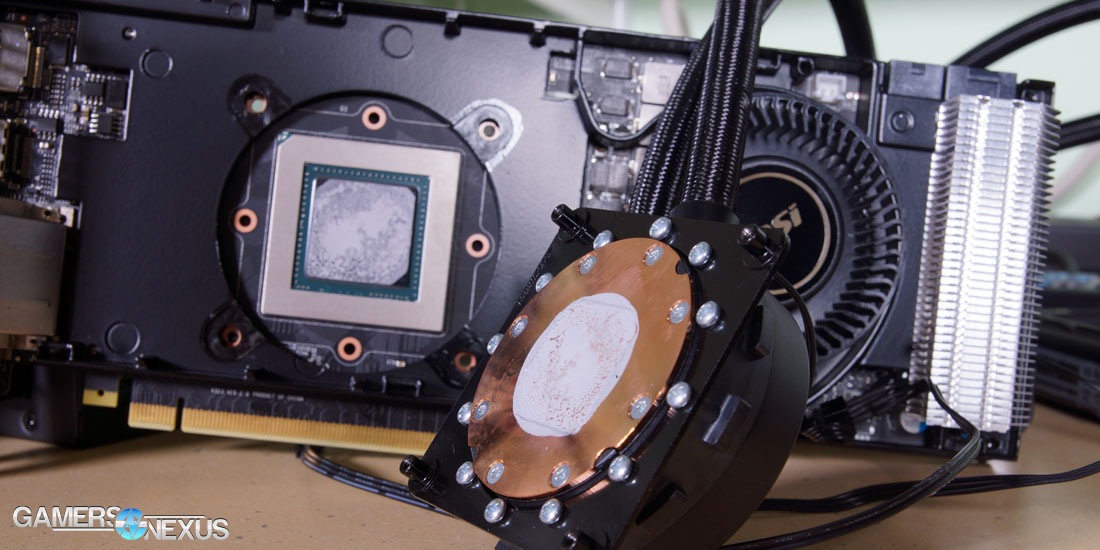
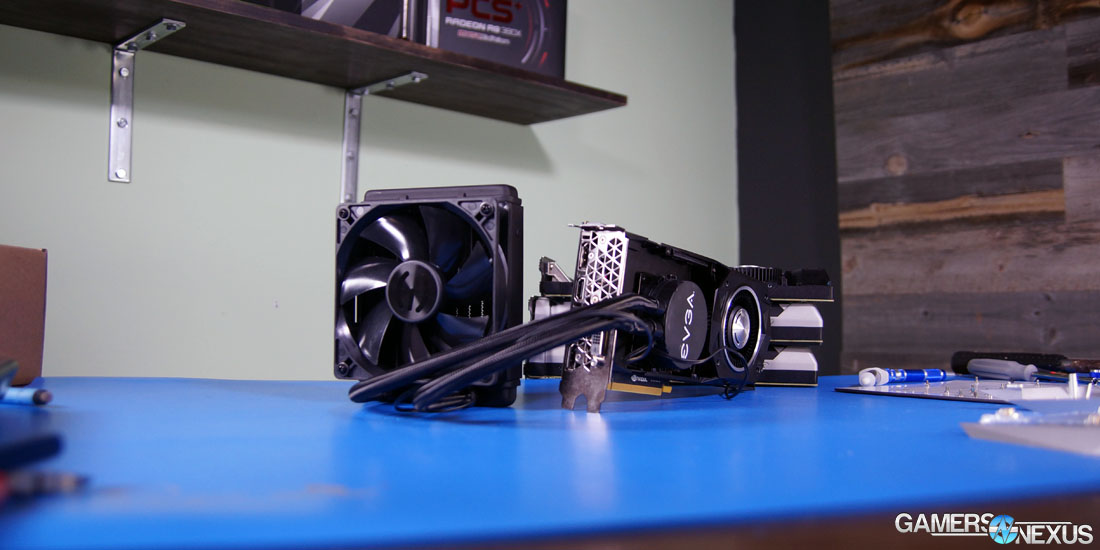
Here's what the card looked like when fully assembled:
We took some shortcuts. It's not in our interest to make this thing pretty – we're strictly going for performance. It was a “side project” of sorts, and as we don't have the mod focus of folks like BS Mods, we're just looking at the quickest way to get the best results.
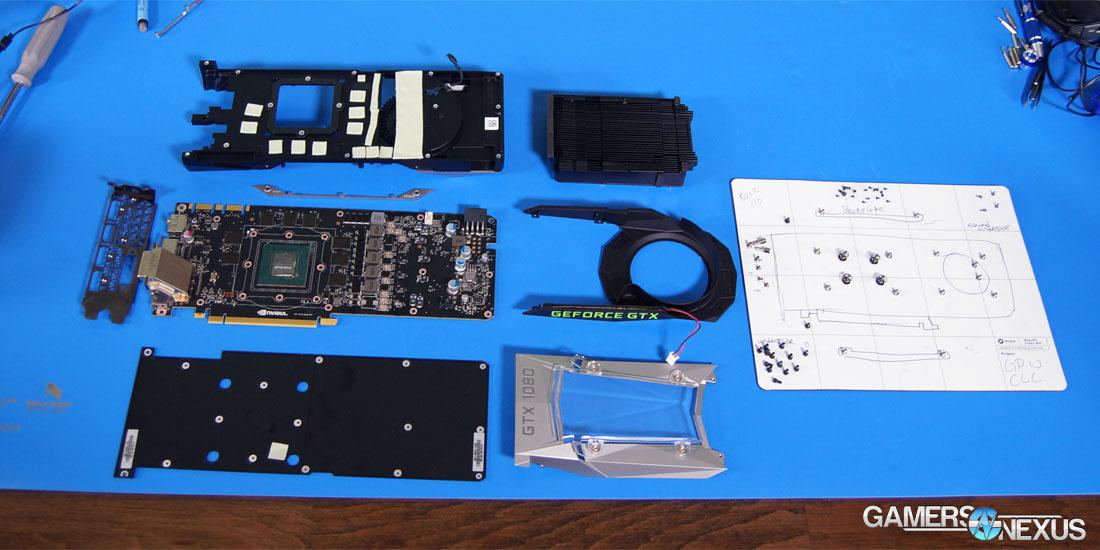
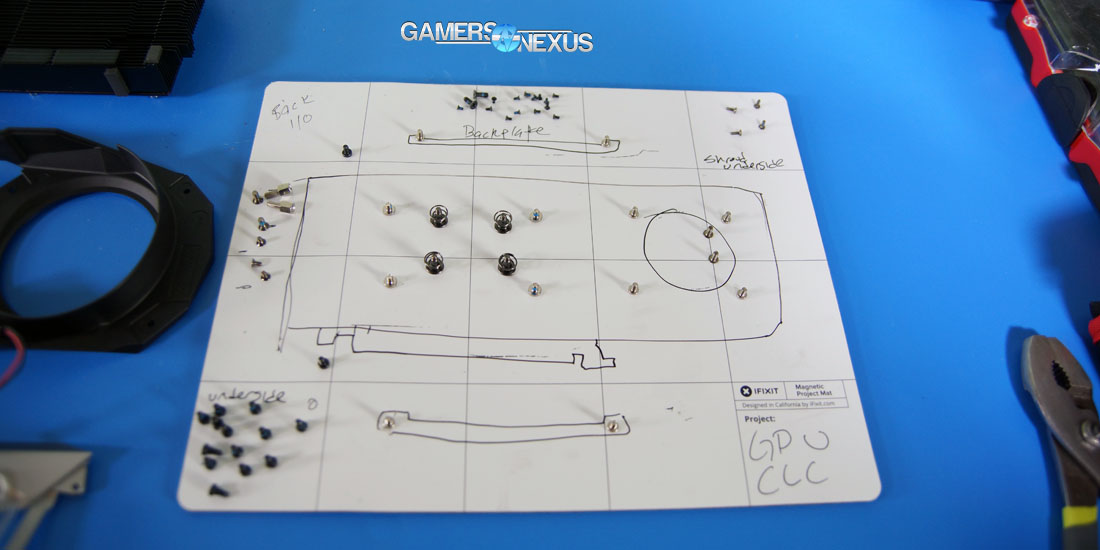
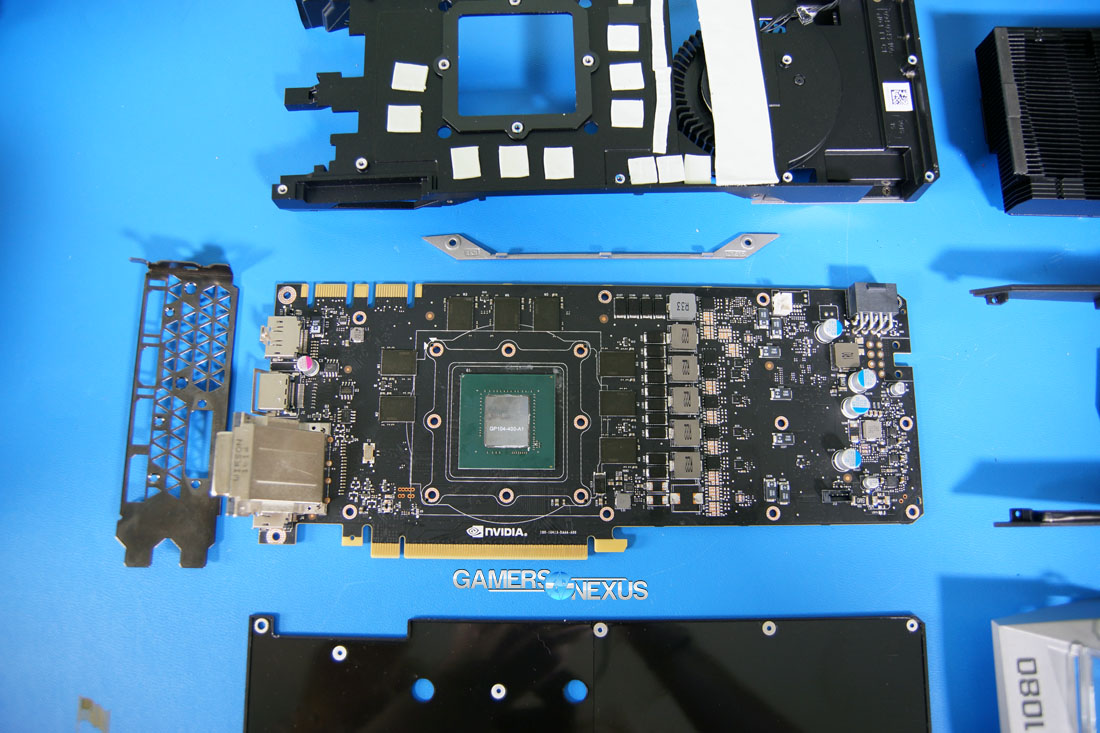
Disassembly was already covered here. We'd advise against doing this – there's inherent risk, it's not particularly trivial, and the GTX 980 Ti Hybrid's bracket is not compatible with the GTX 1080's base plate. The tessellation prohibits screw alignment, so we ran the card more “bare” and focused, again, on function over cosmetics. Honestly, it didn't look that bad all assembled; the GTX 1080 looks good in all black.
Previous Clock vs. Thermals Tests
Here's an excerpt from our review, which provides the main premise for this assembly (other than “because it's fun”).
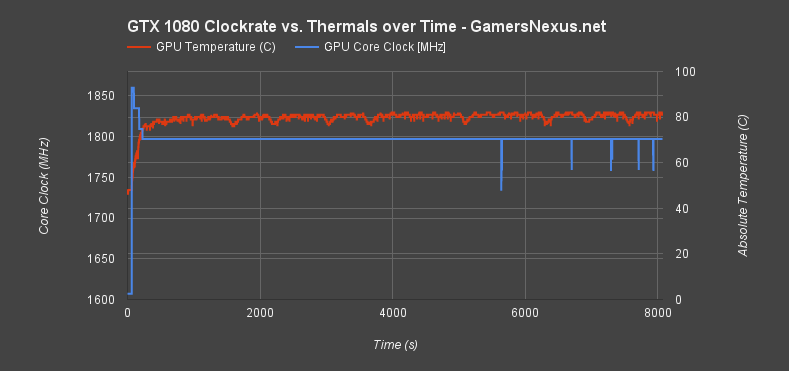
"This test was conducted over a 2-hour period (~8000 seconds). Rather than Kombustor, we used a real-world game to analyze performance and throttles in gaming scenarios. DiRT Rally was used at its maxed-out settings (4K, 8-tap MSAA, advanced blending, Ultra settings) to torture the card. To further amplify the thermal torture and create somewhat of a worst-case scenario, we also disabled all three front intake fans. This left the GPU entirely to its own devices – mostly the VRM blower fan and alloy heatsink / vapor chambers – to cool itself.
This data is absolute temperature, not the delta. We changed our data presentation for this chart to more clearly illustrate the point of throttling, without the necessity of simple math to add in ambient. This is an absolute temperature.
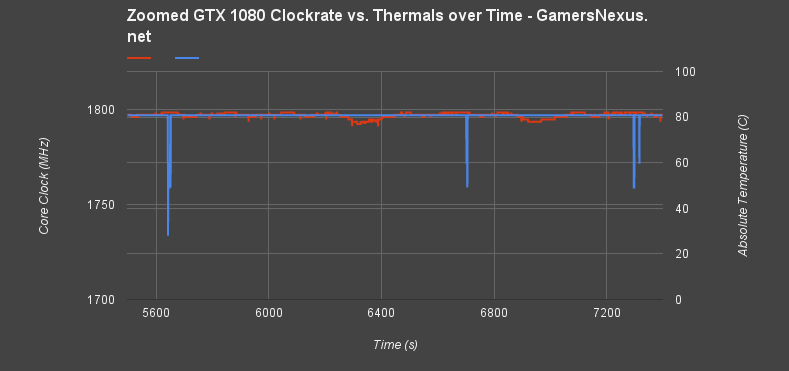
The frequency is fairly stable here, but shows dips in frequency which grow in consistency as the test continues. Let's zoom in on that data; the scale is a little wide to properly see what's going on. Here's a blown-up version of those spikes, truncating the data from ~5500s to ~7500s:
Frequency fluctuations show a range of approximately ~60MHz each time the GPU diode hits ~82C absolute. This can trigger a slight latency increase or framerate fluctuation at the exact moment of frequency fluctuation, but is basically imperceptible.
Here's a look at the most exaggerated spike:
| Time (s) | Core MHz | Abs. T. (C) |
| 5636 | 1797 | 82 |
| 5637 | 1797 | 82 |
| 5638 | 1797 | 82 |
| 5639 | 1797 | 82 |
| 5640 | 1797 | 82 |
| 5641 | 1797 | 82 |
| 5642 | 1733.5 | 82 |
| 5643 | 1759 | 82 |
| 5644 | 1771.5 | 82 |
| 5645 | 1759 | 82 |
| 5646 | 1759 | 82 |
| 5647 | 1759 | 82 |
| 5648 | 1771.5 | 82 |
| 5649 | 1771.5 | 82 |
| 5650 | 1797 | 82 |
A few hits later, the temperature falls pursuant to this frequency throttle (which is the point of the momentarily throttle):
| Time (s) | Core MHz | Abs. T. (C) |
| 5677 | 1797 | 81 |
| 5678 | 1797 | 81 |
| 5679 | 1797 | 82 |
| 5680 | 1797 | 81 |
| 5681 | 1797 | 81 |
| 5682 | 1797 | 81 |
| 5683 | 1797 | 81 |
| 5684 | 1797 | 81 |
| 5685 | 1797 | 81 |
| 5686 | 1797 | 81 |
| 5687 | 1797 | 81 |
| 5688 | 1797 | 81 |
| 5689 | 1797 | 81 |
| 5690 | 1797 | 81 |
| 5691 | 1797 | 81 |
| 5692 | 1797 | 81 |
| 5693 | 1797 | 81 |
| 5694 | 1797 | 81 |
| 5695 | 1797 | 81 |
| 5696 | 1797 | 81 |
| 5697 | 1797 | 79 |
With the frequency restored and the game continuing to crunch numbers and graphics, temperatures eventually return to 82C and drop again.
This dance occurs five times in a span of 42 minutes. To this end, the metric is important to measure, but can be ignored as an end user. You will not perceive these hits, and the frequency throttle is so minimal as to be imperceptible on framerate in the greater scheme of a 2-hour play session."
Test Methodology
We tested using our GPU test bench, detailed in the table below. Our thanks to supporting hardware vendors for supplying some of the test components.
The latest AMD drivers (16.15.2 Doom-ready) were used for testing. NVidia's unreleased 368.14 drivers were used for game (FPS) testing, with 386.12 (no performance change – just unlocked for the beta Precision build) being used for overclocking. Game settings were manually controlled for the DUT. All games were run at presets defined in their respective charts. We disable brand-supported technologies in games, like The Witcher 3's HairWorks and HBAO. All other game settings are defined in respective game benchmarks, which we publish separately from GPU reviews. Our test courses, in the event manual testing is executed, are also uploaded within that content. This allows others to replicate our results by studying our bench courses.
Windows 10-64 build 10586 was used for testing.
Each game was tested for 30 seconds in an identical scenario, then repeated three times for parity.
Average FPS, 1% low, and 0.1% low times are measured. We do not measure maximum or minimum FPS results as we consider these numbers to be pure outliers. Instead, we take an average of the lowest 1% of results (1% low) to show real-world, noticeable dips; we then take an average of the lowest 0.1% of results for severe spikes.
| GN Test Bench 2015 | Name | Courtesy Of | Cost |
| Video Card | This is what we're testing! | - | - |
| CPU | Intel i7-5930K CPU | iBUYPOWER | $580 |
| Memory | Corsair Dominator 32GB 3200MHz | Corsair | $210 |
| Motherboard | EVGA X99 Classified | GamersNexus | $365 |
| Power Supply | NZXT 1200W HALE90 V2 | NZXT | $300 |
| SSD | HyperX Savage SSD | Kingston Tech. | $130 |
| Case | Top Deck Tech Station | GamersNexus | $250 |
| CPU Cooler | NZXT Kraken X41 CLC | NZXT | $110 |
Thermal Test Methodology
We strongly believe that our thermal testing methodology is the best on this side of the tech-media industry. We've validated our testing methodology with thermal chambers and have proven near-perfect accuracy of results.
Conducting thermal tests requires careful measurement of temperatures in the surrounding environment. We control for ambient by constantly measuring temperatures with K-Type thermocouples and infrared readers. We then produce charts using a Delta T(emperature) over Ambient value. This value subtracts the thermo-logged ambient value from the measured diode temperatures, producing a delta report of thermals. AIDA64 is used for logging thermals of silicon components, including the GPU diode. We additionally log core utilization and frequencies to ensure all components are firing as expected. Voltage levels are measured in addition to fan speeds, frequencies, and thermals. GPU-Z is deployed for redundancy and validation against AIDA64.
All open bench fans are configured to their maximum speed and connected straight to the PSU. This ensures minimal variance when testing, as automatically controlled fan speeds will reduce reliability of benchmarking. The CPU fan is set to use a custom fan curve that was devised in-house after a series of testing. We use a custom-built open air bench that mounts the CPU radiator out of the way of the airflow channels influencing the GPU, so the CPU heat is dumped where it will have no measurable impact on GPU temperatures.
We use an AMPROBE multi-diode thermocouple reader to log ambient actively. This ambient measurement is used to monitor fluctuations and is subtracted from absolute GPU diode readings to produce a delta value. For these tests, we configured the thermocouple reader's logging interval to 1s, matching the logging interval of GPU-Z and AIDA64. Data is calculated using a custom, in-house spreadsheet and software solution.
Endurance tests are conducted for new architectures or devices of particular interest, like the GTX 1080, R9 Fury X, or GTX 980 Ti Hybrid from EVGA. These endurance tests report temperature versus frequency (sometimes versus FPS), providing a look at how cards interact in real-world gaming scenarios over extended periods of time. Because benchmarks do not inherently burn-in a card for a reasonable play period, we use this test method as a net to isolate and discover issues of thermal throttling or frequency tolerance to temperature.
Our test starts with a two-minute idle period to gauge non-gaming performance. A script automatically triggers the beginning of a GPU-intensive benchmark running MSI Kombustor – Titan Lakes for 1080s. Because we use an in-house script, we are able to perfectly execute and align our tests between passes.
Additional endurance tests were conducted over a period of one hour. These tests use DiRT Rally rather than MSI Kombustor. In this regard, they are real-world gaming endurance tests. We ran Ultra settings at 4K and maxed AA for a highly intensive workload.
DIY GTX 1080 'Hybrid' Averaged Peak Thermals
For sake of ease, we're calling our GTX 1080 'Hybrid' the “GTX 1080 GN Hybrid” in some of these charts – just to reduce confusion and ensure everyone knows that our amalgam is not, in fact, an official product.
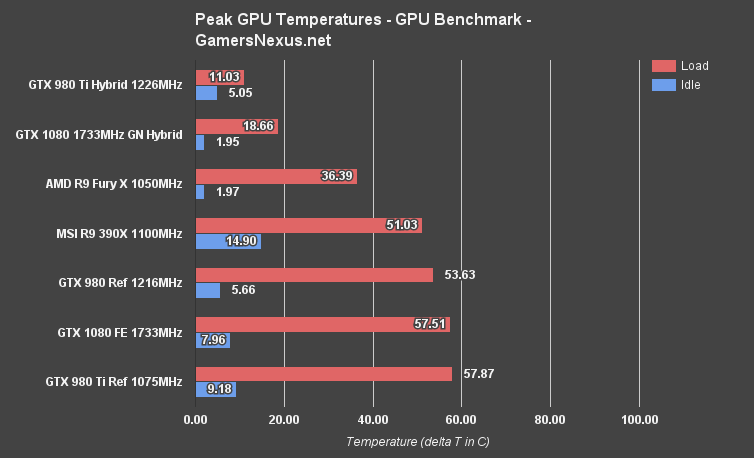
Here's the averaged peak thermals for the devices under test:
The difference is massive and apparent. The GTX 1080 GN Hybrid operates at 18.66C delta T over ambient averaged peak temperature (stock clock). We've not yet made changes to the voltage, MemCLK, or base CLK. Idle sits at 1.95C – impressively low.
The 1080 FE, meanwhile, runs at 57.51C under air and has an idle temperature of 7.96C.
DIY GTX 1080 'Hybrid' Thermals Over Time
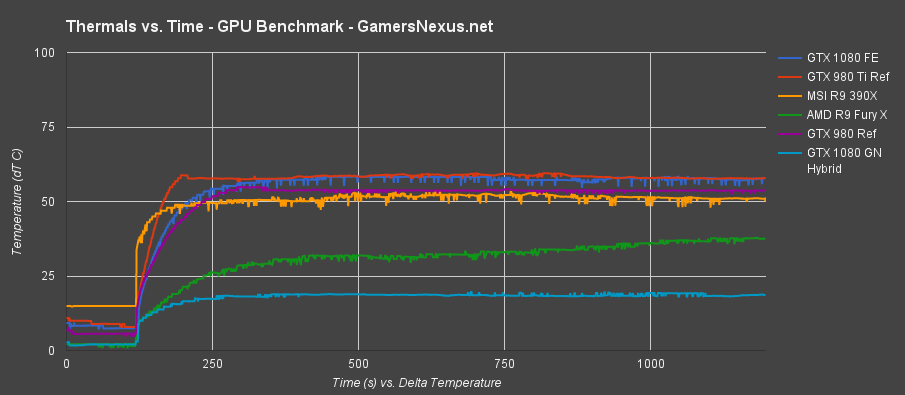
Presenting the data a different way for easier visualization, this chart shows thermals vs. time for the cards on bench:
These values, as above, are Delta T over Ambient values. The GTX 1080 GN Hybrid sustains a stable temperature (sub-20C dT) and outperforms AMD's liquid-cooled Fury X – but that's for a few reasons, one being that the Fury X uses liquid to cool more than just the GPU (so the liquid runs hotter, but other components run cooler). We talk about that here.
GTX 1080 Overclocked Clock-Rate vs. Time & Clock Stability
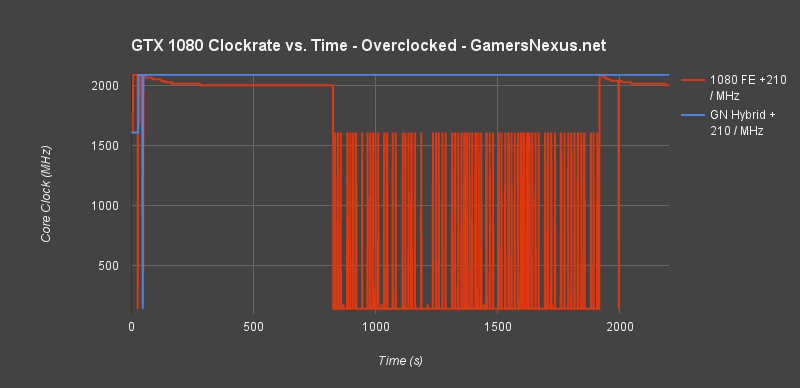
This chart shows the clock-rate versus time. The GTX 1080 chokes on its thermals (and power), and begins spiraling once it's racked-up heat over the period of an hour-long test. 82C is the threshold for a clock-rate reduction on the GP104 GPU, as we show above.
You can see that the clock remains stable for a good 10+ minutes, but starts dying after that. The clock-rate recovers about 15 minutes later. These dips cause screen severe frame dropping or complete screen blackouts, in the worst cases.
With this more stable clock-rate, we're able to actually push our OC even higher on the GN Hybrid card than on the FE card, something we'll talk about in a second. First, though, let's look at fan RPMs.
GN's GTX 1080 Hybrid vs. Founders Edition VRM Fan Speed & Noise
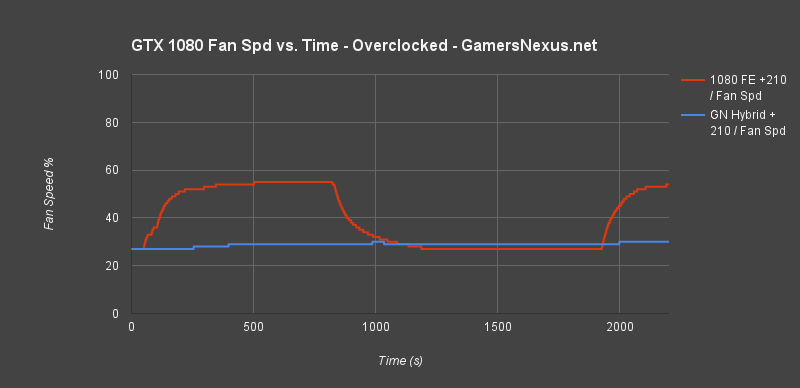
Because the CLC keeps the 1080 below 20C delta T, or in the ~40s absolute, our VRM fan stays at or below 30% for the entirety of a 1-hour burn-in test. The GTX 1080 FE fluctuates between 27% and ~57-60%. Of course, the Hybrid 120mm fan runs and creates its own noise, but it's not as loud or pitchy as the FE fan.
(Bottom chart is same as above -- just repeated for easier comparison)
The above is a VRM fan RPM vs. time chart. You'll notice that the fan RPM dips hard in the middle of the endurance test – that's because the data is from the same clock-rate stability test as the above chart (derived from a +210MHz offset sustained OC). The dip in fan RPM occurs around when the clock falls off a cliff and struggles to recover, shortly after the initial throttle and clock dive.
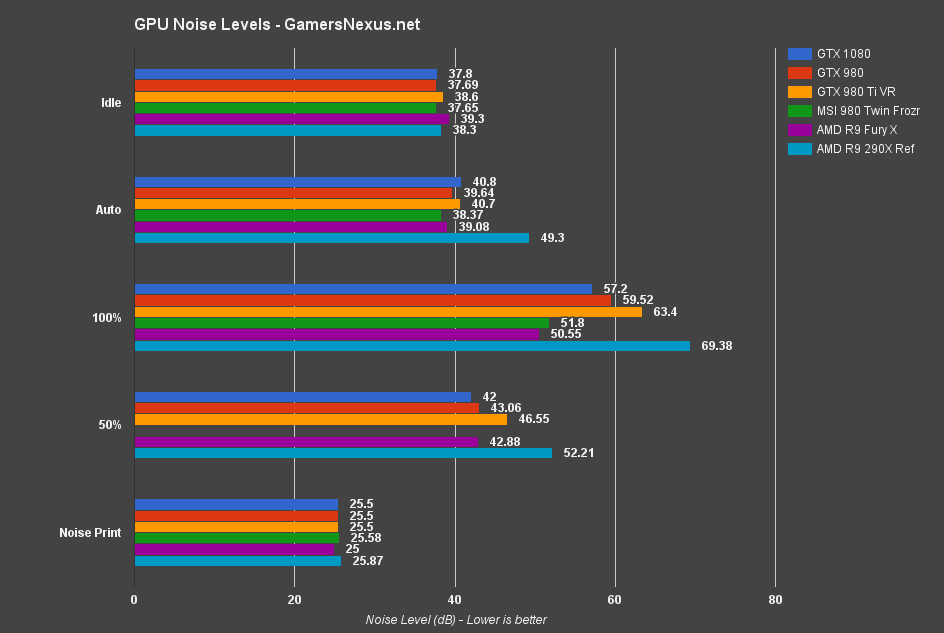
Now, running at ~100% RPM would resolve some stability issues and reduce overall thermals – but that's really not a good solution. Here's our initial dB chart from the review (methodology in the review):
As above, nVidia's FE version of the GTX 1080 plots at about ~57.2dB under 100% load (noise floor: 25.5dB). The GTX 1080 GN Hybrid sustains still lower thermals, and manages to do so with a slower fan revolution and dB output of ~43.6dB (marginally louder than the Fury X's ~50% fan speed).
Why Does the Hybrid Cooler Work So Well?
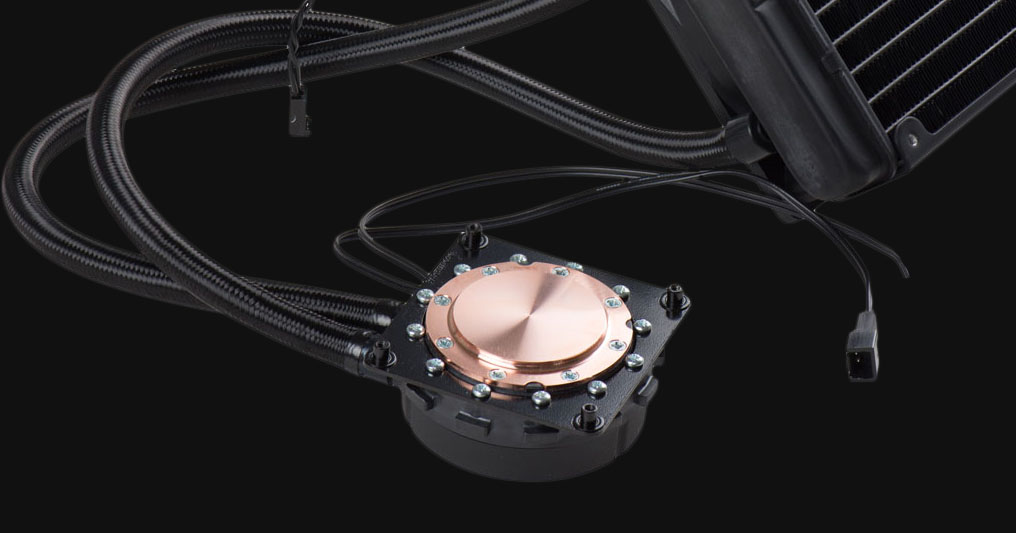
Unlike a CPU CLC, GPU CLCs which are made specifically for cooling the differently shaped GPU silicon (which is also directly exposed to the coldplate, rather than through an Intel or AMD IHS) will have copper extrusions and a modified shape. The copper extrusion is something we explain in our GTX 980 Ti Sea Hawk review.
Here's an excerpt:
“Both cards use an Asetek-supplied liquid cooler, with the Sea Hawk using a Corsair-branded H55. The H55 is built for CPU cooling, but can be adapted to GPU cooling by way of a mounting bracket. This is where we must look for potential thermal dissipation differences.
The cooler on the EVGA Hybrid has a coldplate extrusion which directly contacts with the surface of the GPU. GPU package size and smoothness measure differently than that of a CPU – especially if the CPU CLC is built to fit multiple socket types – and this GPU-specific tuning could potentially have a large impact on thermal output. We'll test that below.”
Original GTX 1080 Founders Edition Overclocking
Here's our original OC progression. The below numbers represent the final values and were validated by real-world games, not just FurMark / Kombustor (which doesn't provoke the same boost/fluctuation-related failures that a game will).
| Core Clock (MHz) | Core Offset (MHz) | Mem CLK (MHz) | Mem Offset (MHz) | Power Target (%) | 5m Test | 60m Burn-in |
| 1733 | 0 | 5005 | 0 | 100 | Pass | Pass |
| 1880 | 150 | 5305 | 300 | 120 | Pass | - |
| 1974 | 171 | 5305 | 300 | 120 | Pass | - |
| 1987 | 190 | 5305 | 300 | 120 | Pass | - |
| 2025 | 210 | 5305 | 300 | 120 | Pass | - |
| 2050 | 230 | 5305 | 300 | 120 | Fail Driver Crash | |
| ~2030 | 220 | 5400 | 400 | 120 | Pass | Pass |
New DIY GTX 1080 'Hybrid' Overclocking
Our new overclocking was more successful. We were able to maximally achieve 2202MHz in Kombustor's particle simulation, but we were only able to hit this core frequency by cheating voltage away from the VRAM (downclocking VRAM by -500MHz). That's not really acceptable – but it was a good test to learn more about how Pascal's overclocking works. More realistically, we were able to attain a ~2189MHz OC in Kombustor.
That doesn't translate well into games, and so can be discarded as synthetic only performance (but was stable, unlike previous, non-liquid efforts). When tuning for gameplay, we ended up settling on 2164MHz core OC and a +600MHz memory OC. That's not as impressive as 2202MHz, but it works, it's stable, and it's a measurable and noteworthy gain over the FE version of the card (which sat at ~2025-2050MHz).
It still feels like there's more room in this chip, but the VRM is fairly weak and the power limitation eventually throttles us. Overvoltage seems to get stuck around 1.0610V, though we did manage to spike it to ~1.08V a few times. We're not sure if this is just Pascal, if it's a software issue, or if it's the Founders Edition card limiting itself in VBIOS. Will explore that in the future.
| Core Clock (MHz) | Core Offset (MHz) | Mem CLK (MHz) | Mem Offset (MHz) | Power Target (%) | 5m Test | 60m Burn-in |
| ~2050-2072 | 225 | 5005 | 0 | 120 | Pass | - |
| ~2100-2138 | 250 | 5005 | 0 | 120 | Pass | - |
| 2164 | 275 | 5005 | 0 | 120 | Pass | - |
| 2164 | 275 | 5602 | 600 | 120 | Pass | Pass |
| 2189 | 300 | 5602 | 600 | 120 | Fail | - |
| 2189 | 300 | 4489 | -500 | 120 | Pass | Pass (But struggled – so would probably fail with longer burn-in; failed immediately when gaming / not synthetic load) |
| 2202 | 325 | 4489 | -500 | 120 | Pass | Fail |
| 2164 | 275 | 5602 | 600 | 120 | Pass | Pass |
GTX 1080 Overclocked FPS Benchmark
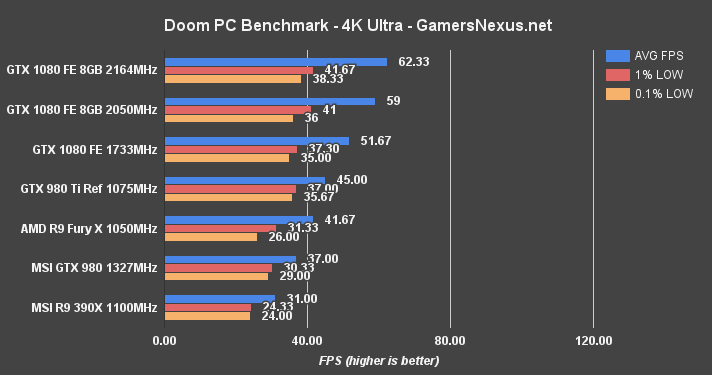
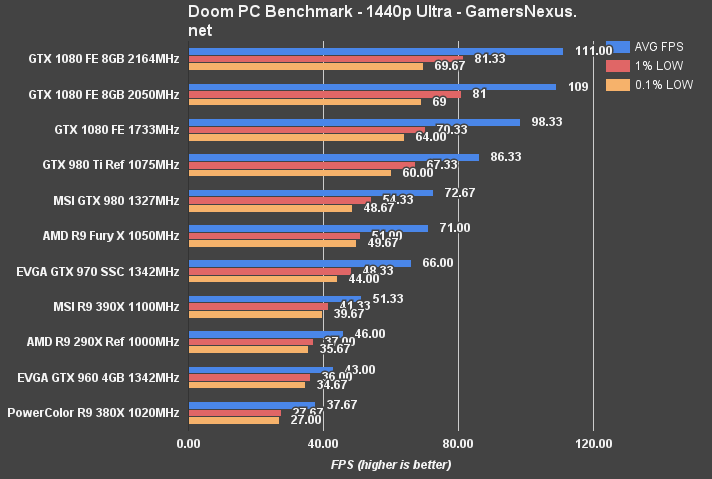
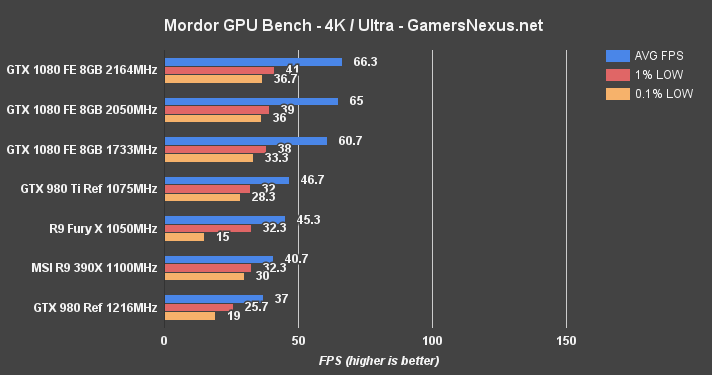
But, of course, the actual FPS gains from our additional OC headroom (a little over 100MHz more) doesn't really produce much in the way of raw FPS – but it is more stable, and that's the most critical. The added stability (reflected in the above clock vs. time charts) means we won't experience “random” driver crashes or frequency dives.
We're seeing an additional ~2% improvement over the previous overclock – hardly noticeable – with a 5.5% gain in Doom at 4K/ultra.
Conclusion: GN's DIY GTX 1080 Hybrid
Clearly, this isn't a project you embark on for FPS gains. Nor is it one we'd recommend for any of the other good reasons to adopt liquid cooling – it's just too much work, the brackets and shrouds don't really exist yet, and the pump is tough to orient in a non-obstructive way. But, for a fun enthusiast hack, our GTX 1080 GN Hybrid is performing exceptionally well. It's significantly cooler, runs with greater stability, runs quieter, and gave us more OC headroom.
Real-world performance is measurable and noticeable in just about every aspect other than raw framerate, which sees no reasonable improvement. That's overclocking in general, though; there's a point where the improvement becomes asymptotic, and the curve flatlines with the small frequency gains toward the top-end of the spectrum.
If you enjoyed following this three part series, please consider backing us on Patreon.
Editorial: Steve “Lelldorianx” Burke
Video Production: Andrew “ColossalCake” Coleman
