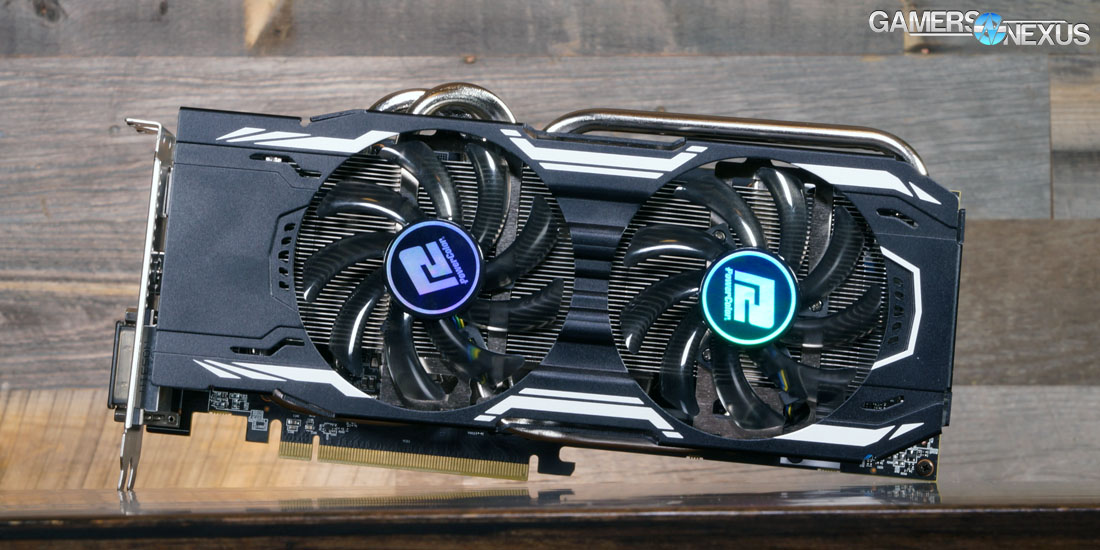
Aside from some odd encounters in the Fury X department and poor initial driver support, AMD's continued R9 roll-out has increasingly improved in its competitive posturing. We've already looked at the R9 380X as provided by Sapphire and remarked that we felt “confident in recommending” AMD's newest device. Today, we're moving to PowerColor's PCS+ R9 380X, a dual-fan-cooled 380X chip with a slight pre-overclock, but significant overhead for additional clock increases.
Our benchmark reviews the PowerColor R9 380X Myst Edition graphics card vs. Sapphire's R9 380X Nitro, including FPS, thermal, and OC testing.
For a review of the R9 380X as it compares to other cards – like the similarly-priced GTX 960 – we'd recommend our R9 380X review and individual game benchmarks (including ACS, Battlefront, Fallout, and more). This review specifically looks at the PCS+ 380X as it compares to our other R9 380X, the Sapphire Nitro card.
PowerColor PCS+ R9 380X Specs
| GamersNexus.net | AMD R9 380X | Sapphire R9 380X | PCS+ R9 380X | AMD R9 380 |
| Process | 28nm | 28nm | 28nm | 28nm |
| Stream Processors | 2048 | 2048 | 2048 | 1792 |
| Boosted Clock | 970MHz | 1040MHz | 1020MHz | 970MHz |
| COMPUTE | 3.97TFLOPs | 4.26TFLOPs | 4.18TFLOPs | 3.84TFLOPs |
| TMUs | 128 | 128 | 128 | 112 |
| Texture Fill-Rate | 124.1GT/s | 133.1GT/s | 130.56GT/s | 108.64GT/s |
| ROPs | 32 | 32 | 32 | 32 |
| Z/Stencil | 128 | 128 | 128 | 128 |
| Memory Configuration | 4GB GDDR5 | 4GB GDDR5 | 4GB GDDR5 | 2 & 4GB GDDR5 |
| Power | 2x6-pin | 2x6-pin | 2x6-pin | 2x6-pin |
| TDP | 190W | 190W | 190W | 190W |
| API Support | Dx12, Vulkan, Mantle | Dx12, Vulkan, Mantle | Dx12, Vulkan, Mantle | Dx12, Vulkan, Mantle |
| Launch Price | $230 | $230 | $230 | $200 |
Formulas used to extrapolate specs:
COMPUTE TFLOPs = (TMUs * ROPs * Core CLK) / 1000
Texture Fill-Rate = Core Clock * TMUs
The PCS+ R9 380X Myst Edition card is slightly overclocked from reference (970MHz) at 1020MHz, but comes in slightly slower than the Nitro card (1040MHz). We'll see how much this matters in the benchmarks below.
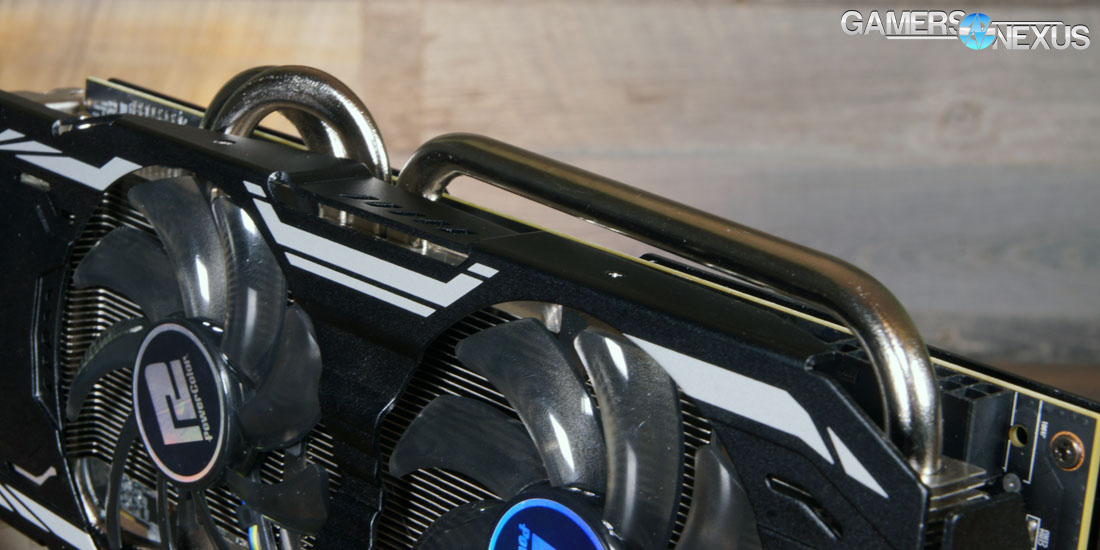
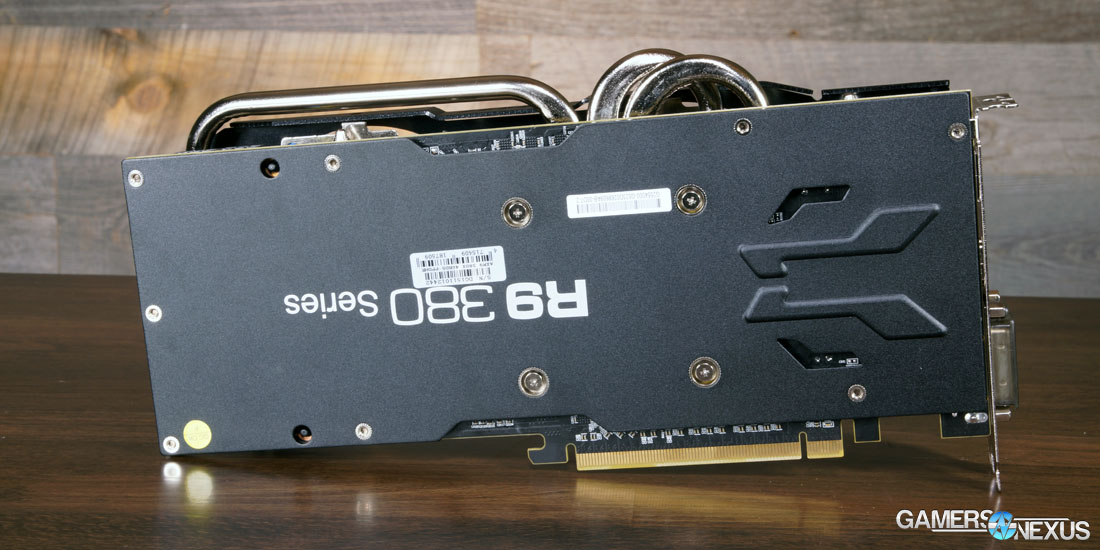
Other than the clockrate difference, the only real identifier between video cards (as always) is the cooling design. PowerColor uses three 8mm and 6mm heatpipes on its card, routed through a large, aluminum heatsink that's cooled by dual 90mm fans. The card measures approximately 10.5” long, making it about an inch longer than the Sapphire Nitro card; PowerColor makes full use of its extra length, filling it with more metal for thermal dissipation.
Test Methodology
We tested using both of our GPU test benches, as we are in the process of merging into a single GPU test bench. Both are detailed in the tables below. Our thanks to supporting hardware vendors for supplying some of the test components.
The latest AMD drivers (15.12) were used for testing, except in the case of the Fury X and R9 380/390, which were all on loan and have not been updated since ~15.7. NVidia's 361.43 drivers were used for testing the latest games. Game settings were manually controlled for the DUT. All games were run at presets defined in their respective charts. We disable brand-supported technologies in games, like The Witcher 3's HairWorks and HBAO. GRID: Autosport saw custom settings with all lighting enabled. All other game settings are defined in respective game benchmarks, which we publish separately from GPU reviews. Our test courses, in the event manual testing is executed, are also uploaded within that content. This allows others to replicate our results by studying our bench courses.
Each game was tested for 30 seconds in an identical scenario, then repeated three times for parity.
Z97 bench:
| GN Test Bench 2015 | Name | Courtesy Of | Cost |
| Video Card | This is what we're testing! | - | - |
| CPU | Intel i7-4790K CPU | CyberPower | $340 |
| Memory | 32GB 2133MHz HyperX Savage RAM | Kingston Tech. | $300 |
| Motherboard | Gigabyte Z97X Gaming G1 | GamersNexus | $285 |
| Power Supply | NZXT 1200W HALE90 V2 | NZXT | $300 |
| SSD | HyperX Predator PCI-e SSD | Kingston Tech. | TBD |
| Case | Top Deck Tech Station | GamersNexus | $250 |
| CPU Cooler | Be Quiet! Dark Rock 3 | Be Quiet! | ~$60 |
X99 Bench:
| GN Test Bench 2015 | Name | Courtesy Of | Cost |
| Video Card | This is what we're testing! | - | - |
| CPU | Intel i7-5930K CPU | iBUYPOWER | $580 |
| Memory | Kingston 16GB DDR4 Predator | Kingston Tech. | $245 |
| Motherboard | EVGA X99 Classified | GamersNexus | $365 |
| Power Supply | NZXT 1200W HALE90 V2 | NZXT | $300 |
| SSD | HyperX Savage SSD | Kingston Tech. | $130 |
| Case | Top Deck Tech Station | GamersNexus | $250 |
| CPU Cooler | NZXT Kraken X41 CLC | NZXT | $110 |
Average FPS, 1% low, and 0.1% low times are measured. We do not measure maximum or minimum FPS results as we consider these numbers to be pure outliers. Instead, we take an average of the lowest 1% of results (1% low) to show real-world, noticeable dips; we then take an average of the lowest 0.1% of results for severe spikes. Anti-Aliasing was disabled in all tests except GRID: Autosport, which looks significantly better with its default 4xMSAA, and Black Ops III. HairWorks was disabled where prevalent. Manufacturer-specific technologies were used when present (CHS, PCSS).
- Black Ops III test methodology is here.
- The Witcher 3 test methodology is here.
- Fallout 4 test methodology is here.
- Assassin's Creed Syndicate methodology is here.
Note: Battlefront was removed as we need to rebench the entire game, following new performance optimizations that drastically improve AMD performance.
Overclocking was performed incrementally using MSI Afterburner. Parity of overclocks was checked using GPU-Z. Overclocks were applied and tested for five minutes at a time and, if the test passed, would be incremented to the next step. Once a failure was provoked or instability found -- either through flickering / artifacts or through a driver failure -- we stepped-down the OC and ran a 30-minute endurance test using 3DMark's FireStrike Extreme on loop (GFX test 2).
Thermals and power draw were both measured using our secondary test bench, which we reserve for this purpose. The bench uses the below components. Thermals are measured using AIDA64. We execute an in-house automated script to ensure identical start and end times for the test. 3DMark FireStrike Extreme (GFX test 2) is executed on loop for 25 minutes and logged. Parity is checked with GPU-Z.
Thermals, power, and overclocking were all conducted on the Z97 bench above.
Thermal Benchmark – PowerColor PCS+ R9 380X
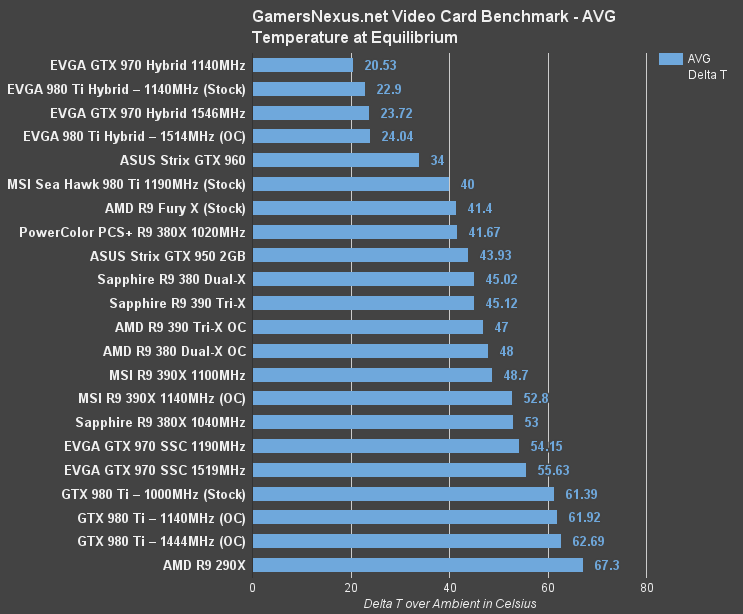
PowerColor's PCS+ R9 380X performed so well in our thermal benchmarks that we reran the tests three times, then re-tested the R9 380X from Sapphire. The performance advantage of the PCS+ cooler is clear, visible in its ~12C lead over the Sapphire Nitro cooler (41.67C vs. 53C delta T over ambient). This is far more than the 20MHz slower core clock; the difference we're looking at here is a direct result of PowerColor's cooler design. The board layout spreads-out card components over a slightly larger area (10.5” vs. ~9.5”), and the PCS+ cooler drops a massive aluminum heatsink atop the GPU with 90mm cooling fans. The most substantial contributor to the card's stellar thermal performance is its large heatpipes, three total, at 8mm and 6mm in heatpipe diameter.
We're blown away by the PCS+ R9 380X's thermal performance against its competition.
X99 Benchmarks
This was discussed in test methodology, but it's worth bringing up again here: We're between two benches right now, transitioning, but we wanted to bring you all the latest game benchmarks. That includes Assassin's Creed: Syndicate (launched today) and Fallout 4, both tested on our X99 platform. The rest of the games were tested on the Z97 platform.
PCS+ R9 380X Benchmark – Fallout 4
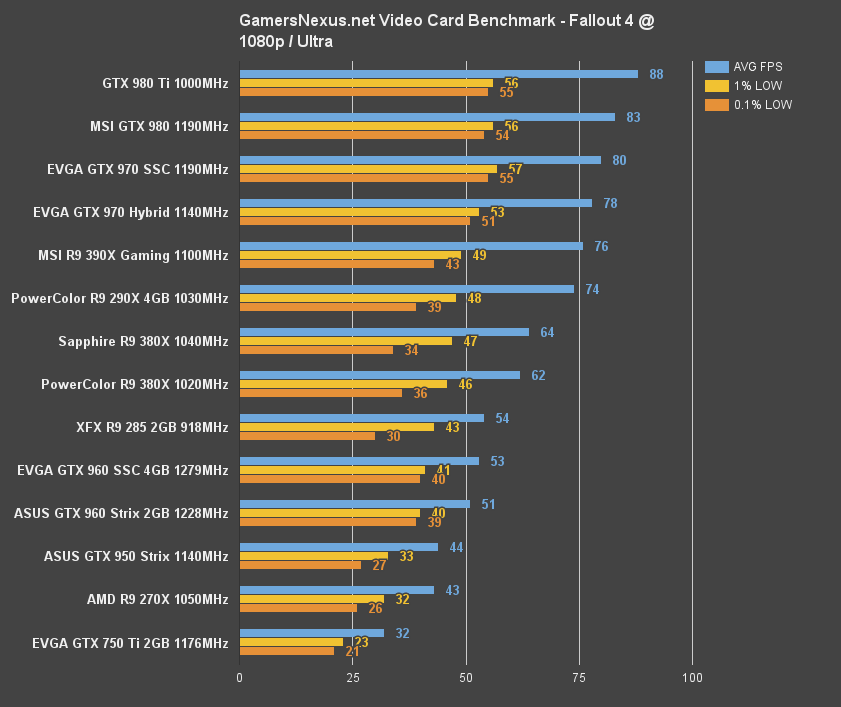
With a 20MHz difference between the core clocks (and slight difference in memory clock) of the Sapphire R9 380X and PCS R9 380X, we didn't go into this hypothesizing much visible difference between cards. Characteristic of such slight clock changes on identical architecture, the Sapphire Nitro 380X ($230) pulls a 2FPS (3.17%) lead over the PowerColor PCS+ R9 380X ($230).
1% and 0.1% low frametime metrics are effectively identical, average FPS is marginally different, and overall experience is about the same. There is no significant lead for either device in Fallout 4; at least, not pre-overclock.
PCS+ R9 380X Benchmark – Assassin's Creed Syndicate
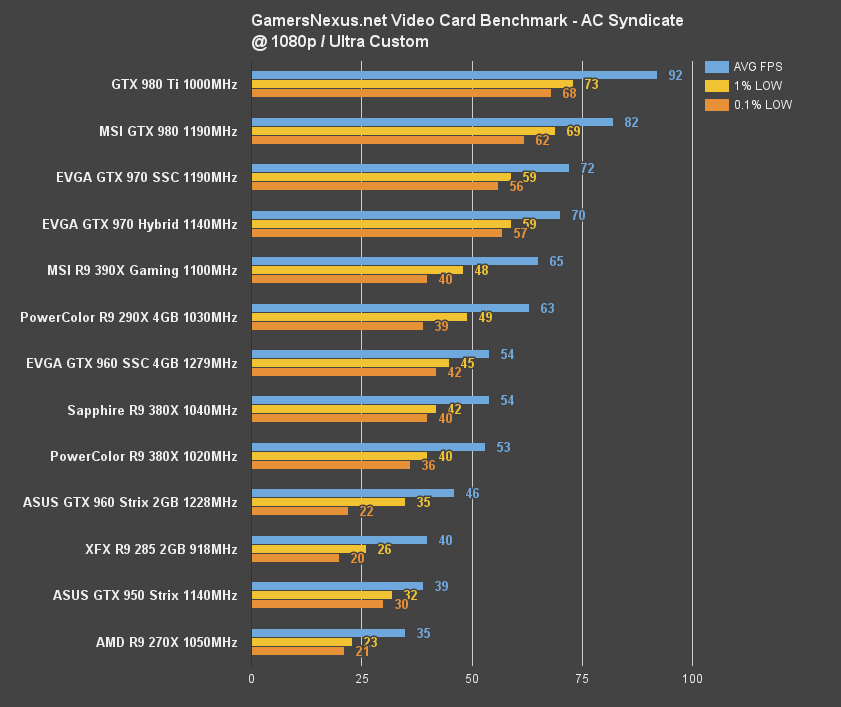
Another marginal difference at 1FPS (AVG) between the two 380X cards, produced by the 20MHz clock gap. That's 1.87% between the two, which is outside of our margin of error and LSD value, but still statistically insignificant when it comes to gameplay 'fluidity.' No user will be able to tell the difference between a 54FPS and 53FPS AVG in Assassin's Creed Syndicate – or any game, probably.
Z97 Benchmarks
Here's the platform we're transitioning to other tests, but still use for some of the “core” benchmarks.
PCS+ R9 380X Benchmark – COD: Black Ops III
First off, check our Black Ops III optimization guide to fully understand all of the graphics settings.
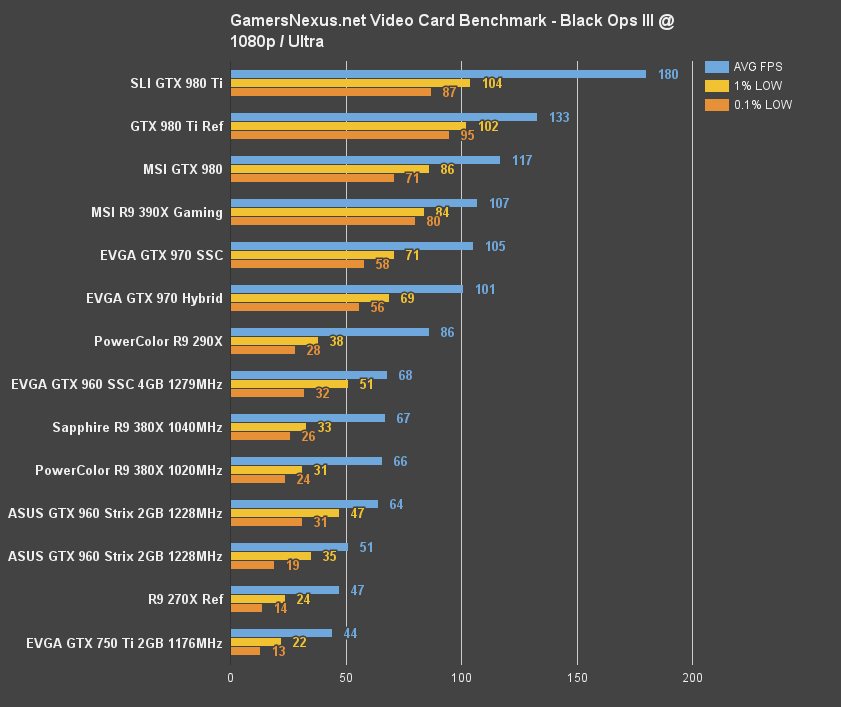
Another 1.5% delta (1FPS) between the Sapphire and PowerColor R9 380X cards, again with the 20MHz Nitro landing marginally ahead of the PCS+ card. Black Ops III produces some of the most reliable metrics we produce, following Metro: Last Light, and consistently output the 66FPS vs. 67FPS average FPS numbers.
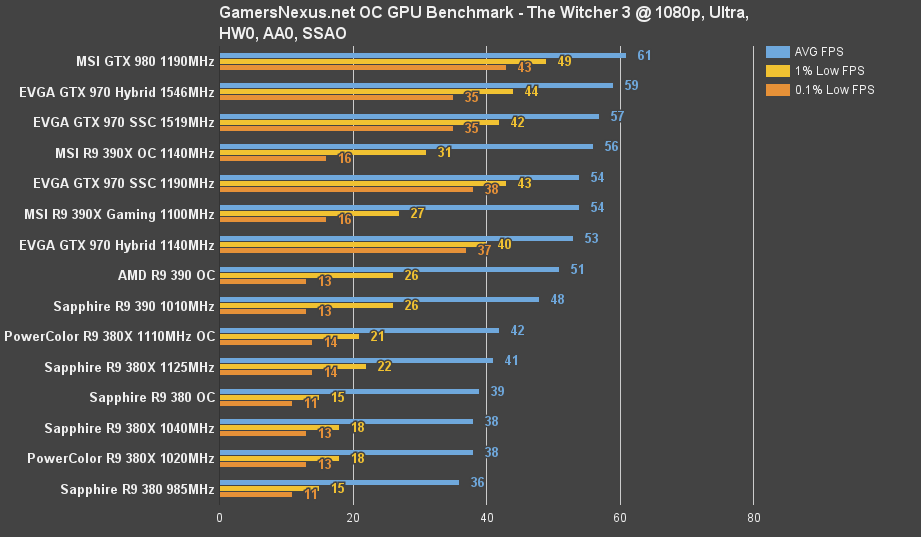
PCS+ R9 380X Benchmark – The Witcher 3
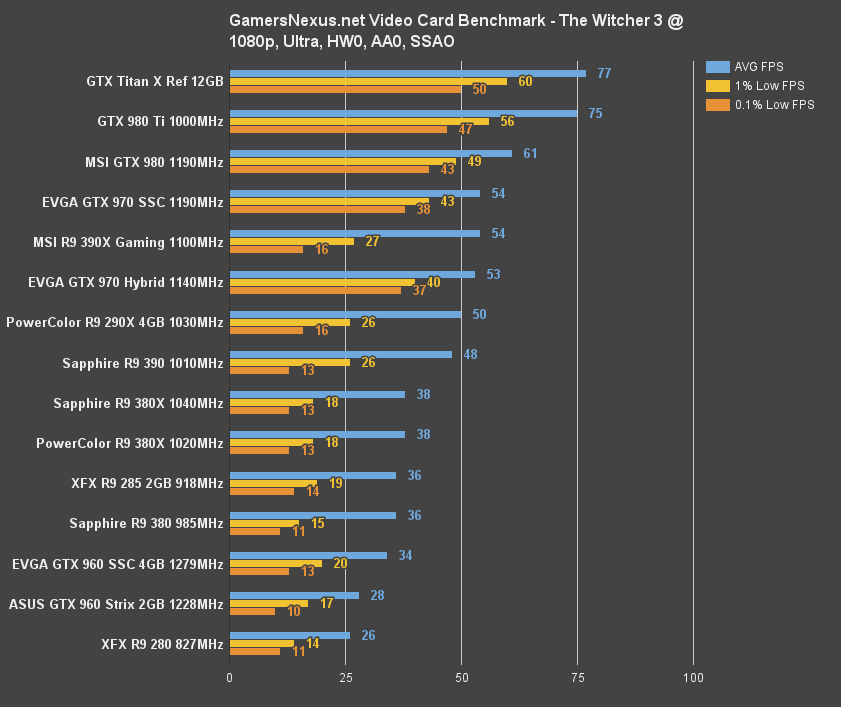
The Witcher 3 has had major performance improving patches since launch, but we're still running the first major patched install (locked updating to ensure consistent results). In TW3, we're seeing zero difference at 1080p / ultra, a result of the game choking the GPU to a point that it's stuck in sub-40FPS output.
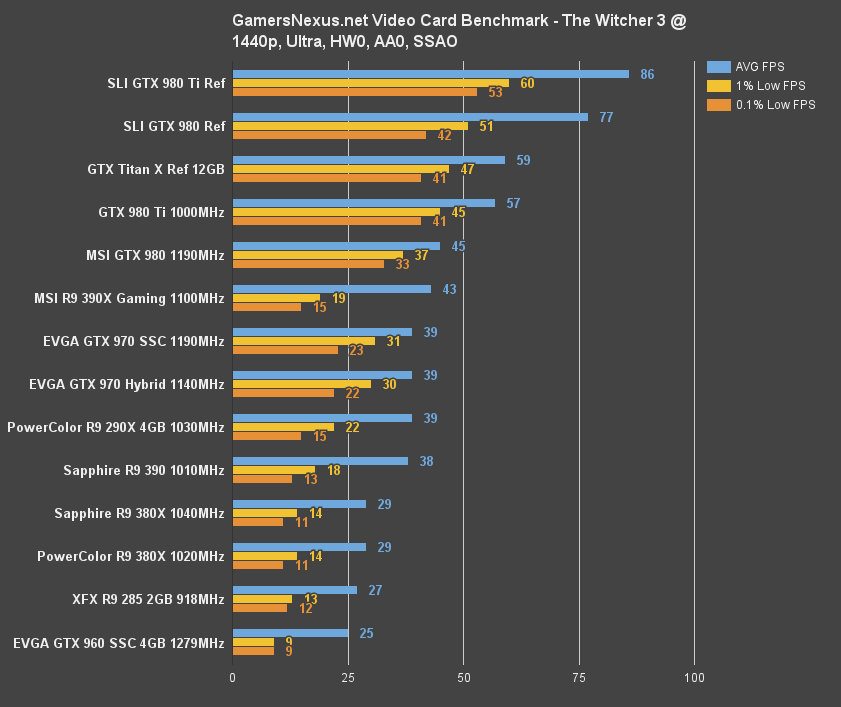
1440p is the same, with AVG, 1% low, and 0.1% low FPS metrics all identical between the two cards.
PCS+ R9 380X Benchmark – GTA V
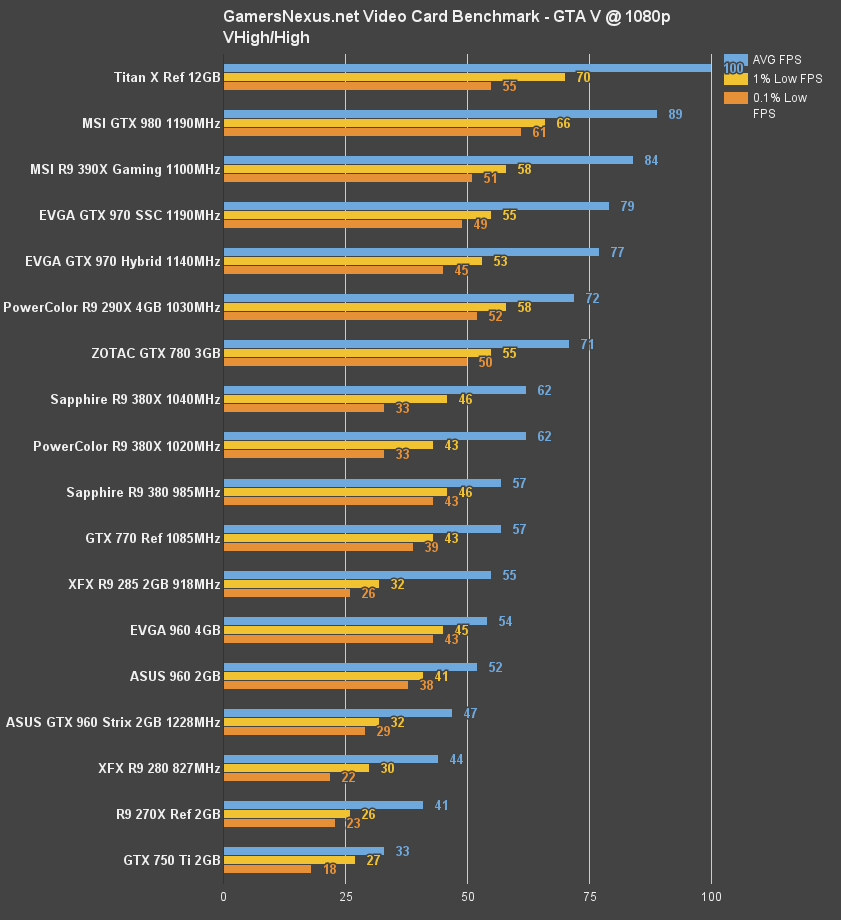
Zero noteworthy difference here. Both the Sapphire and PowerColor R9 380X cards push 62FPS AVG in the GTA V benchmark.
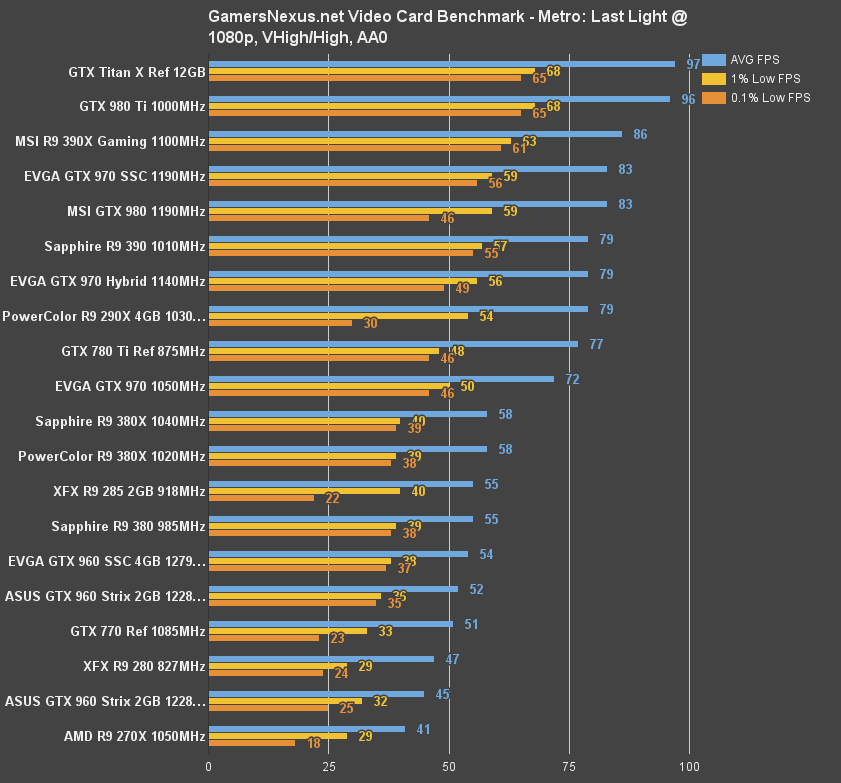
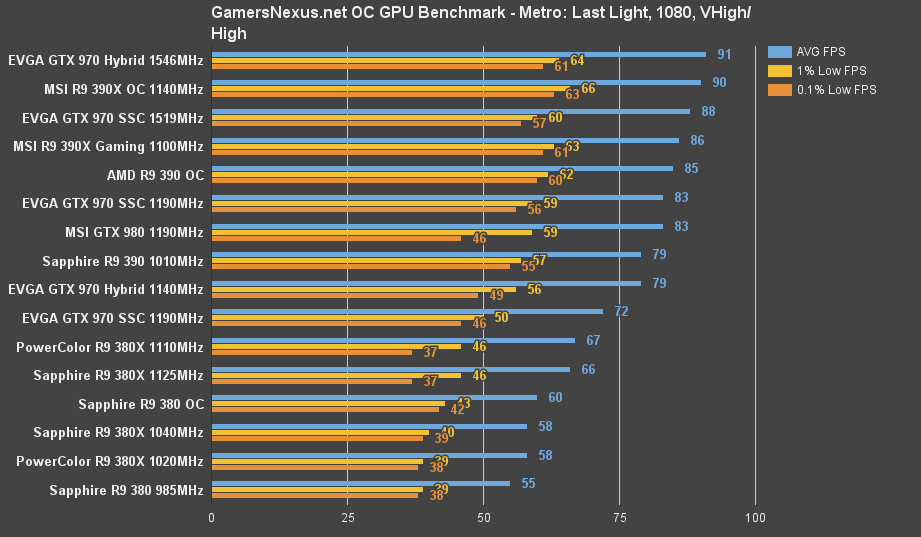
PCS+ R9 380X Benchmark – Metro: Last Light
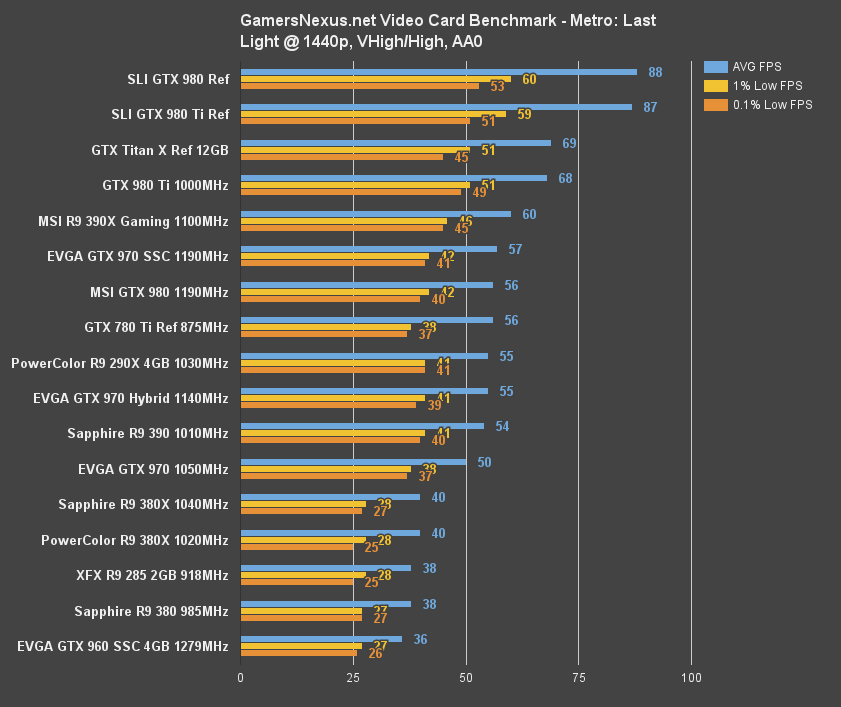
1440p MLL is another chart showing effectively zero difference, aside from 0.1% lows being 2FPS apart (within least significant difference, given how granular 0.1% low measurement is at this framerate).
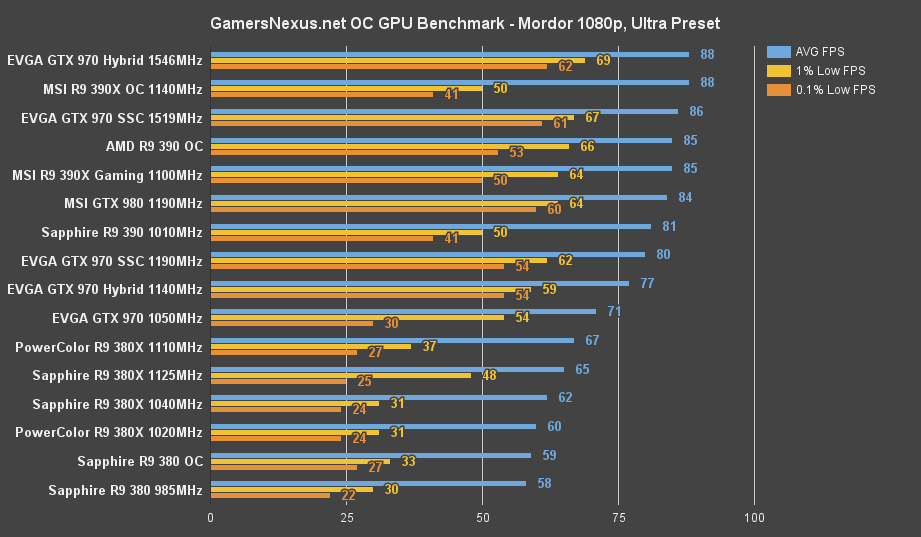
PCS+ R9 380X Benchmark – Shadow of Mordor
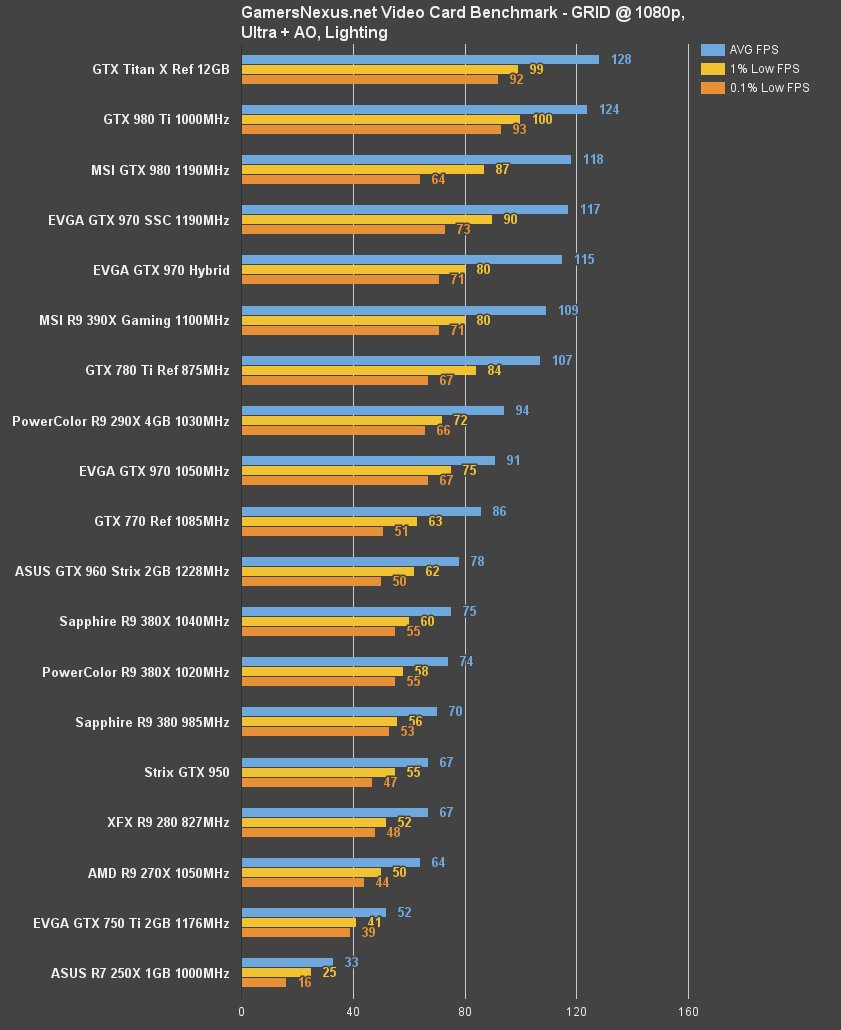
PCS+ R9 380X Benchmark – GRID: Autosport
Overclocking PowerColor's R9 380X
For overclocking, we configure the power percent target to its maximum value before adjusting voltage to its own corresponding outputs. We avoid maxing-out voltage where possible, as it eats into total TDP available to the card's clocks. We then slowly increment clockrate, observing for visual artifacting or catastrophic failures throughout the process. Each increment is left only for a few minutes before moving to the next step. We're eventually confronted with a driver failure, at which point the clockrate is backed-down, then endurance tested for 25 minutes using 3DMark Firestrike Extreme on loop.
With the R9 380X, we presently have no voltage control, and so left voltage untouched. The R9 380X allows 120% of base power to be supplied to the GPU for overclocking, utilized alongside the clock stepping shown below:
| AMD R9 380X Overclock Stepping - GamersNexus.net | ||||||
| CLK Offset | Max CLK | Mem Offset | Mem CLK | PWR Offset | Initial Test | Endurance? |
| 0 | 1020 | 0 | 1475 | 0 | Y | - |
| 60 | 1080 | 50 | 1525 | 20 | Y | - |
| 80 | 1100 | 50 | 1525 | 20 | Y | - |
| 100 | 1120 | 50 | 1525 | 20 | Y | - |
| 120 | 1140 | 50 | 1525 | 20 | Y | N - Flicker |
| 90 | 1110 | 50 | 1525 | 20 | Y | Y |
| 90 | 1110 | 65 | 1540 | 20 | Y | Y |
| 90 | 1110 | 85 | 1560 | 20 | Y | Y |
| 90 | 1110 | 95 | 1570 | 20 | Y | Y |
| 90 | 1110 | 105 | 1580 | 20 | Y | Y |
| 90 | 1110 | 115 | 1590 | 20 | Y | Y |
| 90 | 1110 | 135 | 1610 | 20 | Y | Y |
| 90 | 1110 | 165 | 1640 | 20 | Y | Y |
| 90 | 1110 | 195 | 1670 | 20 | Y | Y |
| 90 | 1110 | 210 | 1685 | 20 | Y | Y |
| 90 | 1110 | 275 | 1750 | 20 | Y | N - Driver Crash |
| 90 | 1110 | 225 | 1700 | 20 | Y | Y |
PowerColor's PCS+ R9 380X didn't want to quit. It got to a point that we had to double-check validation results from AIDA64, GPU-Z, and other software to ensure that the OC was actually applying; the memory OC kept going, driving all the way up to 1700MHz before its failure. This is uncharacteristic of the PCS+ R9 380X Myst Edition's Nitro competition, which stopped at a 1550MHz memory clock. The PCS+ R9 380X, although it couldn't sustain quite as high core clocks, holds a significant advantage in the MemOC department.
Sapphire Nitro R9 380X Overclocking Results
| AMD R9 380X Overclock Stepping - GamersNexus.net | ||||||
| CLK Offset | Max CLK | Mem Offset | Mem CLK | PWR Offset | Initial Test | Endurance? |
| 0 | 1040 | 0 | 1500 | 0 | Y | - |
| 50 | 1090 | 0 | 1500 | 20 | Y | - |
| 80 | 1120 | 0 | 1500 | 20 | Y | - |
| 105 | 1145 | 0 | 1500 | 20 | Y | - |
| 105 | 1145 | 50 | 1550 | 20 | Y | - |
| 105 | 1145 | 75 | 1575 | 20 | Y | - |
| 120 | 1200 | 75 | 1575 | 20 | N | - |
| 105 | 1145 | 75 | 1575 | 20 | N | - |
| 90 | 1130 | 50 | 1550 | 20 | Y | N |
| 80 | 1120 | 50 | 1550 | 20 | Y | Y |
| 80 | 1120 | 75 | 1575 | 20 | Y | N |
| 85 | 1125 | 50 | 1550 | 20 | Y | Y |
Above are the results for the R9 380X by Sapphire. We had to revisit a few CLK Offsets after spotty stability, eventually settling on +85MHz (1125MHz max) core clock and +50MHz memory offset (1550MHz).
PowerColor PCS+ R9 380X Overclocking Benchmarks
The memory offset does give the PCS+ R9 380X Myst card a slight lead over the overclocked Sapphire card (in some games).
Conclusion
Our R9 380X initial review had us stating that we felt confident in recommending AMD's newest card, based upon performance metrics vs. the GTX 960 and improved driver support. That hasn't changed, and at this time, the PowerColor PCS+ R9 380X Myst Edition card – aside from having the longest name – has superior cooling performance ranked against comparable cards.
This is somewhat expected of same-GPU card comparisons, but framerate performance is effectively identical between the PCS+ 380X and the Nitro card from Sapphire. There is hardly a measurable difference pre-OC, mostly falling in the ~1.5% to 3% range, and post-OC doesn't see a massive gain either (though the PCS+ card does pull ahead in some games). If looking strictly at these two cards for purchase, it'd really come down to warranty, thermals, and OC support. Both companies offer a two-year warranty, so that's not much differentiation, but the PCS+ Myst card significantly outperforms the Sapphire Nitro in the thermal department (~+11-13C cooler). The PCS+ card also overclocks its memory significantly higher, though some of that could be 'silicon lottery,' with the core clock OC pretty similar to the Nitro. Form factor is a consideration, the Nitro about 1” shorter than the ~10.5” PCS+, but is only worth noting for ultra SFF builds.
Aside from the fact that it's about 1 frame (1.5%-3%) slower than its 1040MHz competition, the PowerColor PCS+ R9 380X Myst Edition card is the superior choice if only for its thermal advantage – and that's ultimately what differentiates these two cards.
- Steve “Lelldorianx” Burke.