AMD's RX 480 launch introduces the Polaris architecture to the world, arranging an alliterative architecture assortment from both GPU vendors (Pascal, if you're curious, is the other). This is AMD's answer to the largest market segment, shipping in 4GB and 8GB variants that are priced at $200 and $240, respectively.
During the RX 480 press briefing, AMD strongly defended its stance on maturing and tuning its architectures to extract the maximum possible performance prior to an architectural shift. “We don't have a billion dollars to spend on a single architecture,” said AMD SVP & Chief Architect Raja Koduri, clearly referencing nVidia's boastful Order of 10 unveil. Koduri went on to praise his team for doing an “amazing job with existing products,” but welcomed the arrival of a new 14nm FinFET process node to usurp the long-standing ubiquity of 28nm planar process.
The AMD RX 480 8GB is on the bench for review today. In this RX 480 8GB review, we benchmark framerate (FPS) & frametime performance, overclocking, thermals, clockrate vs. time endurance, fan RPMs, and noise levels.
AMD RX 480 vs. GTX 1070, GTX 970, 960, & R9 390X [Video Review]
AMD RX 460, RX 470, & RX 480 Specs
| AMD RX 480 | AMD RX 470 | AMD RX 460 | |
| Architecture | Polaris 10 | Polaris 10 | Polaris 11 |
| Compute Units (CUs) | 36 | 32 | 14 |
| Stream Processors | 2304 | [Unverified] 2048? | [Unverified] 864? |
| Base / Boost Clock | 1120MHz / 1266MHz | ? / ? | ? / ? |
| COMPUTE Performance | >5 TFLOPS | >4 TFLOPS | >2 TFLOPS |
| Graphics Command Processor (GCP) | 1 | 1 | 1 |
| ACEs | 4 | ? | 2 |
| HWS | 2 | 2 (?) | 2 |
| TMUs | 144 | ? | 64 |
| Pixels Output / Clock | 32 | ? | 16 |
| Geometry Processors | 4 | ? | 2 |
| L2 Cache | 2MB | ? | 1MB |
| LSU | 576x32b | ? | 256x32b |
| VRAM Capacity | 4GB GDDR5 @ 7Gbps 8GB GDDR5 @ 8Gbps | 4GB GDDR5 | 2GB GDDR5 |
| Memory Interface | 256-bit | 256-bit | 128-bit |
| Memory Speed | 7Gbps (4GB model) 8Gbps (8GB model) | 7Gbps | 7Gbps |
| Memory Bandwidth | 224GB/s (4GB model) 256GB/s (8GB model) | ??? | ??? |
| TDP | 150W | 110W | 75W |
| Power Connectors | 6-pin | 6-pin | None (Slot only) |
| Display Port | 1.3 HBR / 1.4 HDR | 1.3/1.4 HDR | 1.3/1.4 HDR |
| Release Date | June 29 | Mid-July | End of July |
Polaris 10 vs. Polaris 11 Specs & Architecture
| Polaris 10 | Polaris 11 | |
| Compute Units (CUs) | 36 | 16 |
| COMPUTE Performance | “>5 TFLOPS” | “>2 TFLOPS” |
| Memory Interface | 256-bit | 128-bit |
| Architecture | Gen 4 GCN | Gen 4 GCN |
| Playback Support | 4K encode/decode | 4K encode/decode |
| Output Standard | DP1.3/1.4 HDR | DP1.3/1.4 HDR |
Of most immediate (and brief) note, our above table reveals some new information: The RX 470's release date is set for “mid-July,” with the RX 460 release date scheduled for the end of July.
Let's take a look at the block diagram.
Architecture – Exploring Polaris & Ellesmere Block Diagrams
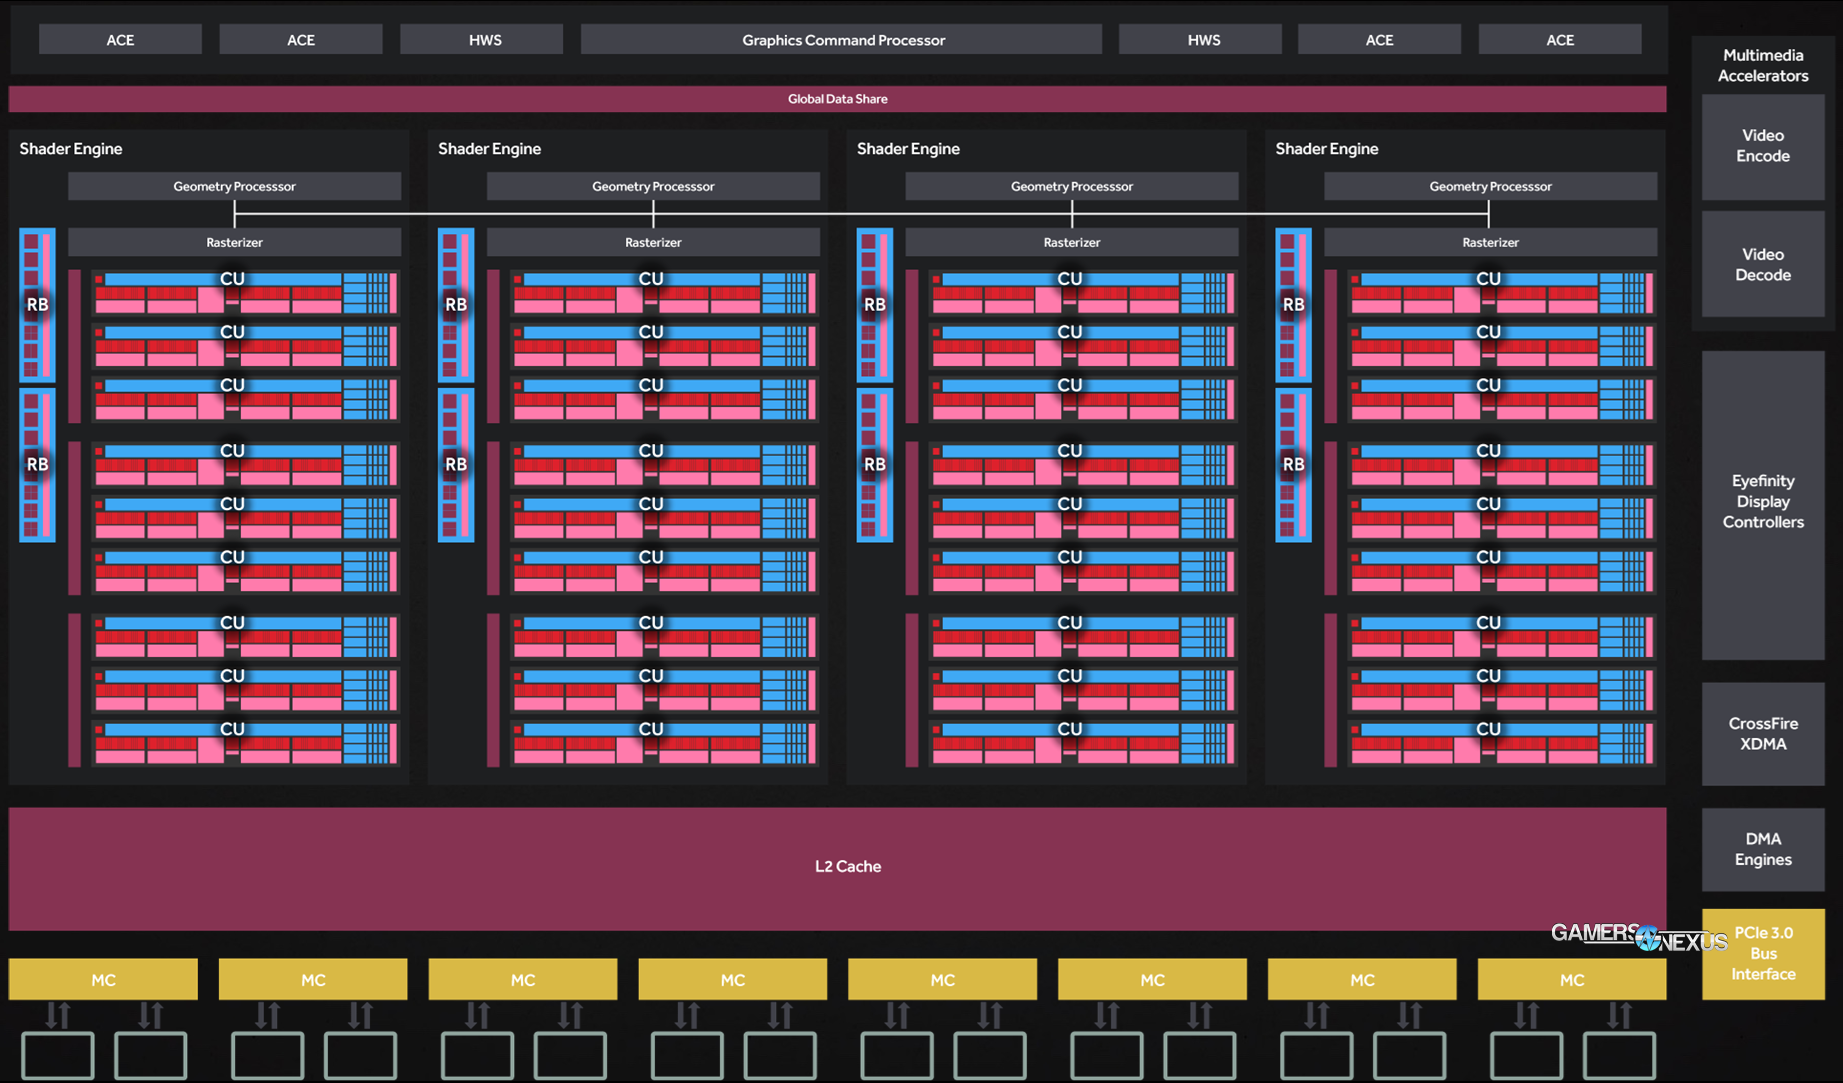
Above: AMD Polaris 10 block diagram.
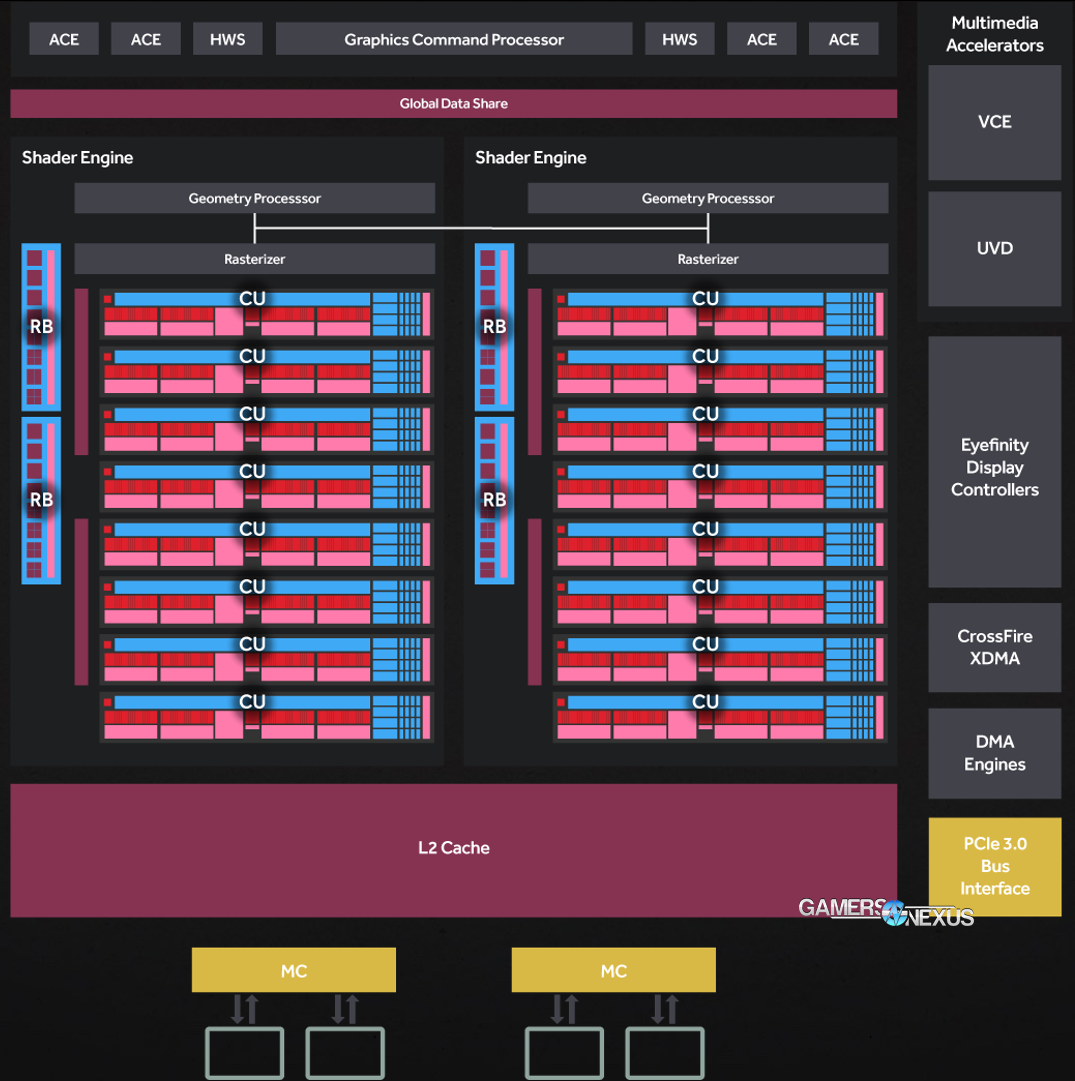
Above: AMD Polaris 11 block diagram.
This is Polaris.
Polaris runs on the new 14nm FinFET process, coinciding almost simultaneously with nVidia's new 16nm FinFET node from TSMC. Both companies have reduced their process size from 28nm, where the industry resided for a number of years – more than typical – while waiting for something more efficient to come along. The jump to 20/22nm planar nodes wasn't worth it for either company. Tooling-up a factory and building the chip for marginal gains made less sense than maturing development on the existing 28nm process. A long waiting period ensued.
FinFET, as we described in our highly-detailed GTX 1080 review, reduces power leakage and voltage requirements. From our previous content:
“FinFET transistors use a three-dimensional design that extrudes a fin to form the drain and source; the transistor's fins are encircled by the gate, reducing power leakage and improving overall energy efficiency per transistor.”
AMD has coupled its FinFET process with datapath organization improvements and improved data compression, both of which reduce overall power consumption. Memory alone has seen an energy reduction upwards of 40% per bit transacted, significantly lowered versus Hawaii and previous generations. This allows more room for energy provided to the cores, of course, but also reduces total consumption. Changes to boosting functions have also improved power utilization, mainly by introducing 7 DPM states (DPM1=sleep, DPM7=fully unlocked for high-end production/gaming).
Clock gating and power gating for under-utilized circuits furthers the perf/watt argument, as does the introduction of heuristic pre-fetch routines that keep cycles occupied with instructions.
But that's getting ahead of the architecture discussion.
Packed into the RX 480 Polaris 10 chip is a grouping of 36 CUs, over which rests a single GCP (Graphics Command Processor), flanked by two Hardware Schedulers (HWS) and four Asynchronous Compute Engines (ACEs). Polaris 10 and Polaris 11 both operate on a single GCP and have expanded reliance upon the HWS over what was found in Gen 3 GCN. The HWS block was first introduced on Gen 3, and owners of Fury- and 390-class GPUs will be happy to know that microcode updates to firmware will enable some of the Polaris-class HWS enhancements. One of those is the introduction of QRQs, which aid in hardware power reductions when using the Oculus Rift HMD. The HWS is controlled by microcode and can be updated through drivers, beneficial as hardware and APIs mature.
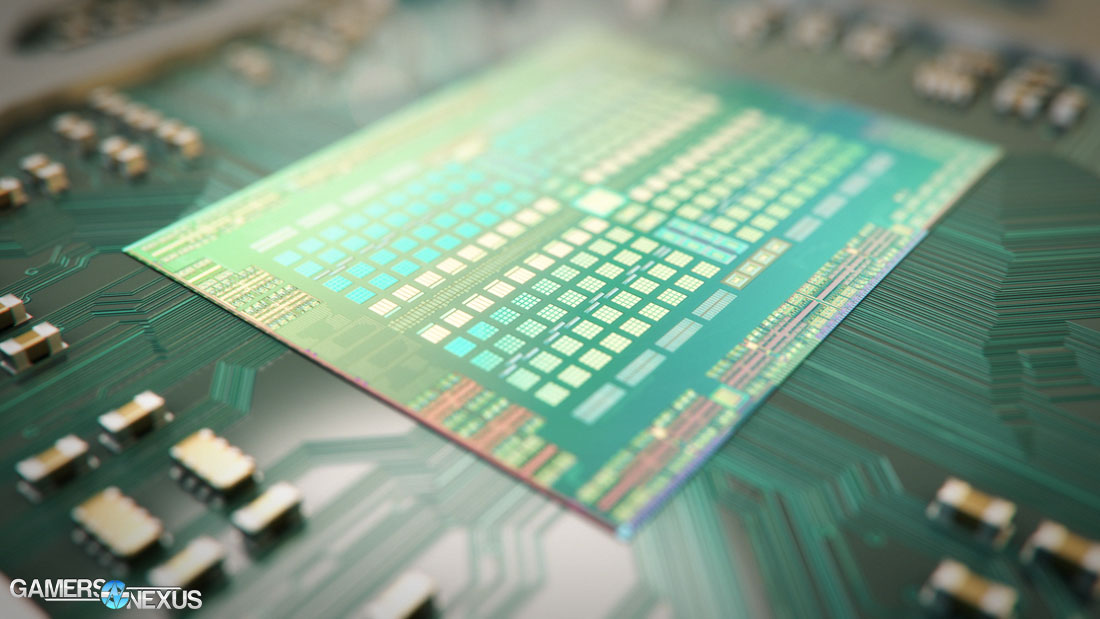
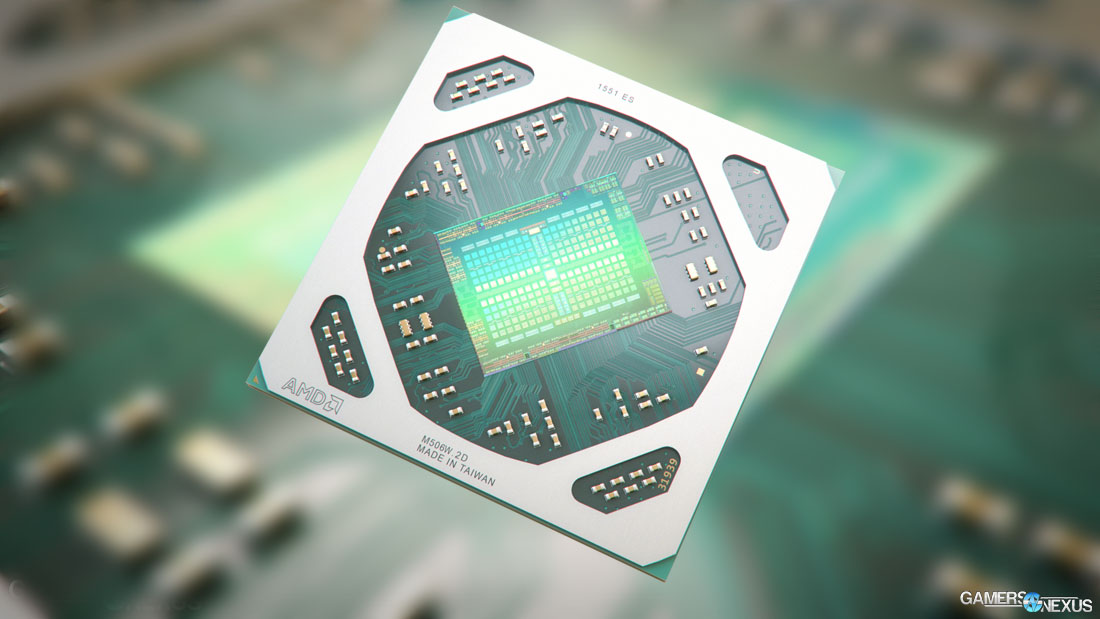
Above: A render of Polaris 10.
The back-end of the render pipeline (GCP → Setup Engine → Scheduler / CEs) begins tasking incoming resources appropriately to low-level GPU components (some virtualized, some physical – ACEs, for instance, are a physical compute resources on the silicon). The Graphics Command Processor takes instruction from the CPU and sends it to the scheduler, which is a GPU component. The scheduler then begins the process of managing a familiar graphics pipeline (discussed here), e.g. drawing primitives and geometry, performing light/shading passes, eventually fetching textures, applying transforms, and preparing to rasterize the output. Post-processing, as always, happens at the end of the pipeline.
But none of that is news – just a refresher for our upcoming discussion on asynchronous compute within Polaris 10.
Looking back at the block diagram, we see that there are four Shader Engines containing the 36 CUs on the RX 480. Here's a reminder of what a CU looked like in 2013:
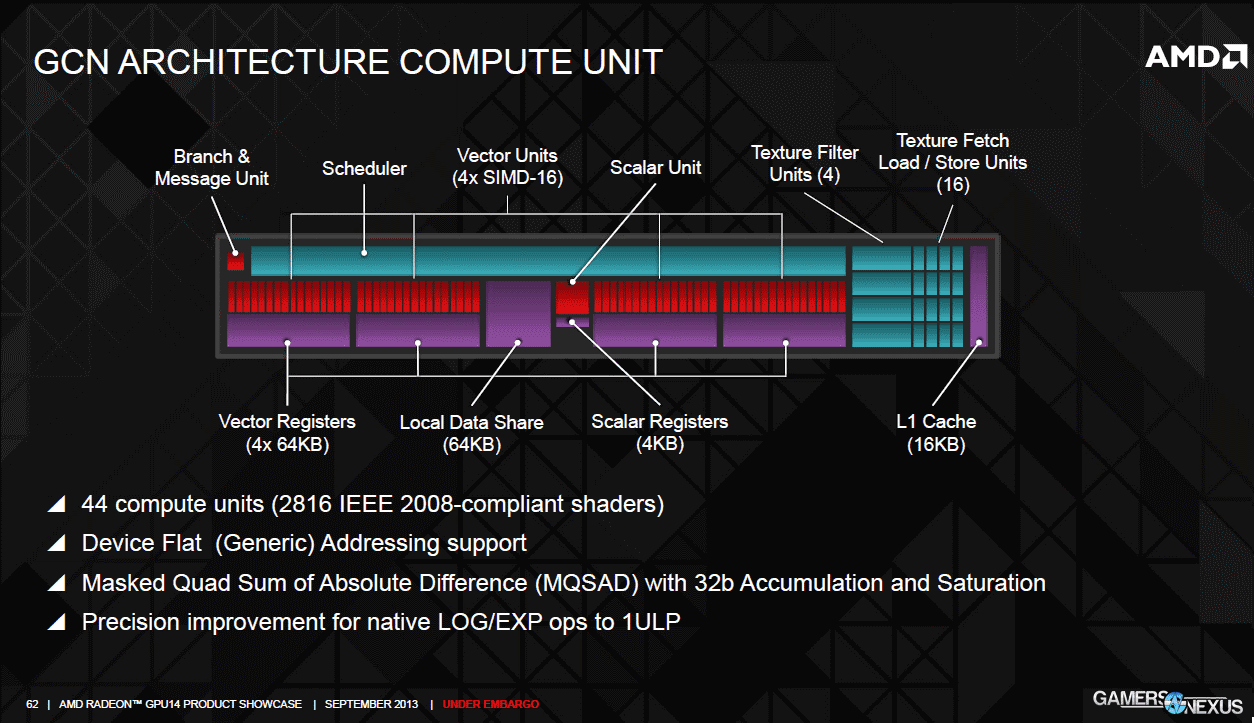
GCN 4.0 has arrived with Polaris (and the above CU architecture is from a 2013 AMD presentation), but the diagram is still useful. In fact, here's the most recent version of a CU block diagram:
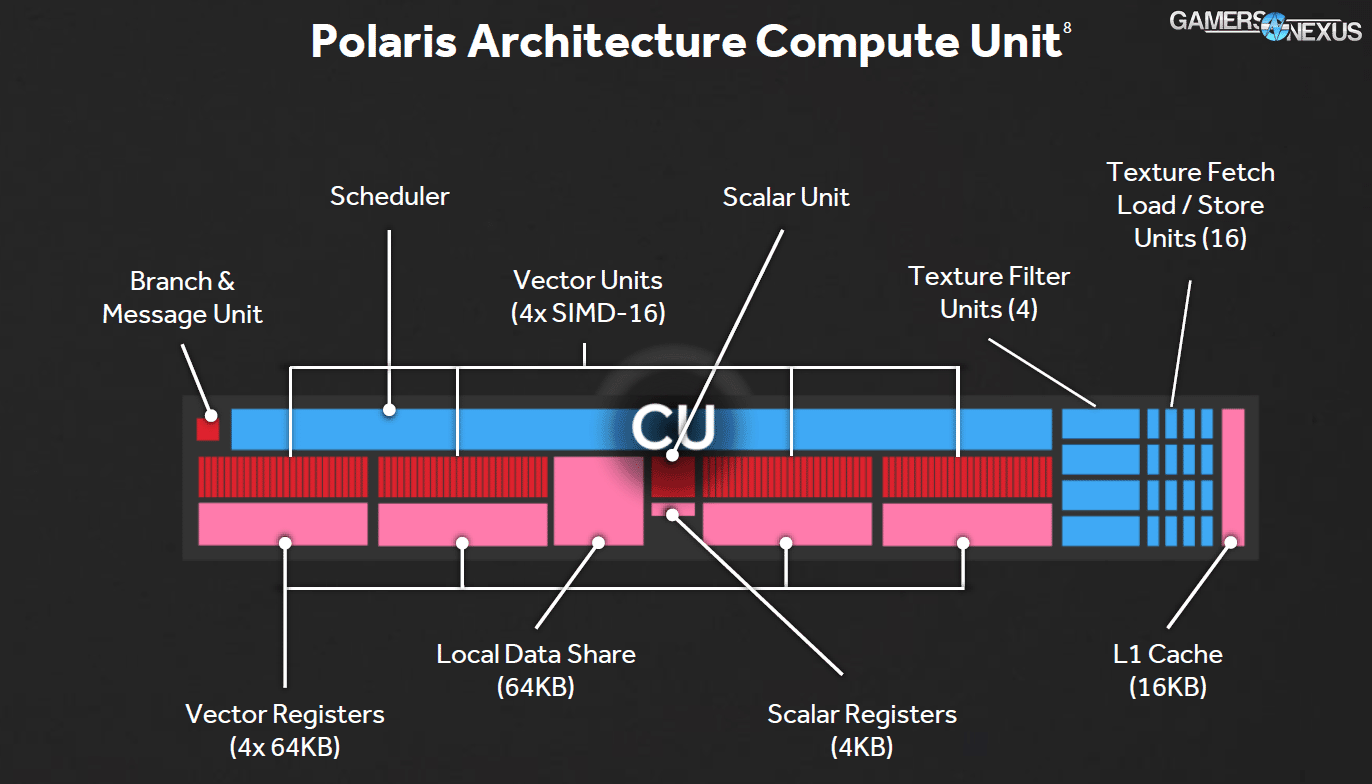
Not much has changed at this low level. Under modern GCN architecture, each CU possesses four Vector Units (SIMD-16), four Vector Registers, a local data share, L1 Cache, four TMUs (sometimes called Texture Filter Units), and sixteen Texture Fetch / Load / Store units.
Doubling L2 Cache, Power Savings, & Delta Color Compression
One of the RX 480's biggest changes is its doubling of L2 Cache. With more capacity in cache for data storage, texture references and color compression remain resident for longer (reducing computational workload). This improves processing efficiency and reduces bandwidth consumption where unnecessary. There's no reason to transact the same data back-and-forth if it can be stored into a local, nearby cache.
Critically, this also has a side effect which is perhaps overlooked: Energy savings. Along with the power reduction native to smaller FinFET process nodes – moving away from planar helps tremendously – the caching system reduces power consumed by GPU memory. Delta Color Compression (DCC) and 2MB of L2 Cache work in conjunction to minimize VRAM activity, and while it is impossible for us to test something this low-level at GN, AMD tells us that power savings are upwards of 40% on memory transactions alone.
AMD's version of DCC can compress colors up to 8:1, offering 4:1 and 2:1 compression as fall-backs in instances which cannot fully compress. DCC functions similarly to what we've shown in our Pascal reviews: The scene is analyzed for similar colors, and those colors are then compressed into as few blocks as possible. An example makes this easy: Imagine looking at a game's skybox. These often consist almost entirely of blues – maybe a few whites are tossed in. The blues might be compressible 8:1; in such an instance, eight blue values may be stored as one blue value. Delta values can than be used to create the rest as needed, rather than absolute color values – which require greater bandwidth.
Pipeline Improvements to Geometry Culling (Tackling Tessellation)

At AMD's press briefing preceding Computex, one of the company's presentations took clear jabs at competitor nVidia: “There's some people who really like to tessellate and tessellate and tessellate. That can create lots of traingles that don't really contribute to the scene.”
AMD is likely referencing nVidia's utilization of tessellation to leverage its own architecture, showcased most recently and heavily with HairWorks in The Witcher.
Polaris updates the geometry engines on the silicon. A primitive discard accelerator culls primitives (triangles, pieces of larger geometry) sooner in the pipeline, targeting primitives that are sort of “orphaned” without sample points. This is different from usual scene z-culling, where obscured geometry is culled prior to being drawn as a means to reduce workload. AMD's discard accelerator specifically looks for geometry it deems valueless to the greater scene, then axes it from the render pipeline. This should improve AMD's performance with heavy tessellated scenes, though does introduce the question of reviving “frame quality” analysis alongside usual framerate and frametime analysis.
There is also a new index cache for instanced geometry, which is useful in games that re-use the same object multiple times. Skyrim is a good example of a game that relies heavily upon object and model instancing. By using an index cache for small, repeated geometry, memory transactions are reduced and bandwidth is freed-up for other tasks. The primitive is maintained in the index cache and re-used as called for scenes, so that the GPU does not need to communicate with memory for every fetch.
A new instruction prefetch also improves pipeline efficiency. The prefetch is a heuristic circuit that capitalizes on cycles left under-utilized by pre-fetching data and avoiding stalls in the pipeline. 16-bit registers also lower the power requirement.
A Push to Notebooks (& a New Driver Strategy)

Polaris 11 is targeted heavily at notebooks – though it will find its way into the RX 460.
The Polaris 11 GPU reduces power consumption and favors a more modest approach to graphics. The company's marketing language feels poorly chosen to use – “console-class performance” – but has good intentions. AMD hopes to re-enter the mobile computing market with Polaris, pushing first into notebooks.
Power is obviously the big argument, but AMD also makes an argument for height. The dimensions of the smallest Polaris chip measure out to 24.5x24.5, with a 1.5mm height (Polaris 11). That small z-height is a noteworthy reduction over Bonaire, which sat at 1.9mm, and theoretically enables thinner notebooks.
We do not yet know of any officially announced notebooks.
As for the new driver strategy, AMD will now be releasing game-specific drivers on an as-needed basis, and will push 6 full WHQL drivers per year. This allows enthusiast and gaming users to pull updates for new games as desired, without flooding less concerned users with driver update notifications. AMD claims to have been the target of driver criticism from two camps: Critics of drivers being updated too frequently (think: mainstream and business users), and critics of drivers not being updated frequently enough (gaming users – we were part of that group).

Last year, AMD released 3 WHQL drivers. The company had a period of 180+ days without any official driver releases. This followed the Omega announcement, wherein GamersNexus was told to expect a major driver update on a monthly basis.
That never happened – but AMD hopes to set things right. In a press briefing, the company highlighted its 4 WHQL driver launches thus far in 2016, further underscoring game-specific driver updates in between those launches.
It's a good habit to get into, and one that AMD has promised to better keep up with.
Continue to Page 2 for test methodology.
Game Test Methodology
We tested using our GPU test bench, detailed in the table below. Our thanks to supporting hardware vendors for supplying some of the test components.
The latest AMD drivers (16.6.2 RX 480 press) were used for testing. NVidia's 368.69 drivers were used for game (FPS) testing. Game settings were manually controlled for the DUT. All games were run at presets defined in their respective charts. We disable brand-supported technologies in games, like The Witcher 3's HairWorks and HBAO. All other game settings are defined in respective game benchmarks, which we publish separately from GPU reviews. Our test courses, in the event manual testing is executed, are also uploaded within that content. This allows others to replicate our results by studying our bench courses. In AMD Radeon Settings, we disable all AMD "optimization" of graphics settings, e.g. filtration, tessellation, and AA techniques. This is to ensure that games are compared as "apples to apples" graphics output. We leave the application in control of its graphics, rather than the IHV. In NVIDIA's control panel, we disable G-Sync for testing (and disable FreeSync for AMD).
Windows 10-64 build 10586 was used for testing.
Each game was tested for 30 seconds in an identical scenario, then repeated three times for parity.
Average FPS, 1% low, and 0.1% low times are measured. We do not measure maximum or minimum FPS results as we consider these numbers to be pure outliers. Instead, we take an average of the lowest 1% of results (1% low) to show real-world, noticeable dips; we then take an average of the lowest 0.1% of results for severe spikes.
| GN Test Bench 2015 | Name | Courtesy Of | Cost |
| Video Card | This is what we're testing! | - | - |
| CPU | Intel i7-5930K CPU | iBUYPOWER | $580 |
| Memory | Corsair Dominator 32GB 3200MHz | Corsair | $210 |
| Motherboard | EVGA X99 Classified | GamersNexus | $365 |
| Power Supply | NZXT 1200W HALE90 V2 | NZXT | $300 |
| SSD | HyperX Savage SSD | Kingston Tech. | $130 |
| Case | Top Deck Tech Station | GamersNexus | $250 |
| CPU Cooler | NZXT Kraken X41 CLC | NZXT | $110 |
For Dx12 and Vulkan API testing, we use built-in benchmark tools and rely upon log generation for our metrics. That data is reported at the engine level.
Video Cards Tested
- AMD RX 480 8GB ($240)
- NVIDIA GTX 1080 Founders Edition ($700)
- NVIDIA GTX 980 Ti Reference ($650)
- NVIDIA GTX 980 Reference ($460)
- NVIDIA GTX 980 2x SLI Reference ($920)
- AMD R9 Fury X 4GB HBM ($630)
- AMD MSI R9 390X 8GB ($460)
- And more
Thermal Test Methodology
We strongly believe that our thermal testing methodology is the best on this side of the tech-media industry. We've validated our testing methodology with thermal chambers and have proven near-perfect accuracy of results.
Conducting thermal tests requires careful measurement of temperatures in the surrounding environment. We control for ambient by constantly measuring temperatures with K-Type thermocouples and infrared readers. We then produce charts using a Delta T(emperature) over Ambient value. This value subtracts the thermo-logged ambient value from the measured diode temperatures, producing a delta report of thermals. AIDA64 is used for logging thermals of silicon components, including the GPU diode. We additionally log core utilization and frequencies to ensure all components are firing as expected. Voltage levels are measured in addition to fan speeds, frequencies, and thermals. GPU-Z is deployed for redundancy and validation against AIDA64.
All open bench fans are configured to their maximum speed and connected straight to the PSU. This ensures minimal variance when testing, as automatically controlled fan speeds will reduce reliability of benchmarking. The CPU fan is set to use a custom fan curve that was devised in-house after a series of testing. We use a custom-built open air bench that mounts the CPU radiator out of the way of the airflow channels influencing the GPU, so the CPU heat is dumped where it will have no measurable impact on GPU temperatures.
We use an AMPROBE multi-diode thermocouple reader to log ambient actively. This ambient measurement is used to monitor fluctuations and is subtracted from absolute GPU diode readings to produce a delta value. For these tests, we configured the thermocouple reader's logging interval to 1s, matching the logging interval of GPU-Z and AIDA64. Data is calculated using a custom, in-house spreadsheet and software solution.
Endurance tests are conducted for new architectures or devices of particular interest, like the GTX 1080, R9 Fury X, or GTX 980 Ti Hybrid from EVGA. These endurance tests report temperature versus frequency (sometimes versus FPS), providing a look at how cards interact in real-world gaming scenarios over extended periods of time. Because benchmarks do not inherently burn-in a card for a reasonable play period, we use this test method as a net to isolate and discover issues of thermal throttling or frequency tolerance to temperature.
Our test starts with a two-minute idle period to gauge non-gaming performance. A script automatically triggers the beginning of a GPU-intensive benchmark running MSI Kombustor – Titan Lakes for 1080s. Because we use an in-house script, we are able to perfectly execute and align our tests between passes.
Noise Testing Methodology
Our noise testing methodology is new and still being revised, but has been kept consistent across all tests contained herein. We test noise in a real-world environment and do not presently use an anechoic chamber. The results align with what consumers will encounter in their own rooms.
We use a REED logging dB meter mounted to a tripod, whose mic is positioned 20” from the face of the GPU (mounted in an open bench). The REED meter is approximately 6” above the bench. All open bench fans are disabled. The Kraken X41 CPU cooling fan is configured to its “silent” mode, minimizing its noise output to be effectively imperceptible.
A noise floor measurement is taken prior to each test's execution to determine ambient without any systems running in the room. We then take an idle measurement (GPU & CPU at idle). Our noise floor has a fluctuation of approximately +/-0.6dB.
Noise levels are logarithmic, and are therefore not as simple to perform delta calculations as thermals or framerates. Noise percent differences are calculated using dB=20*log(V2/V1) (where V is amplitude). You cannot perform a simple percent difference calculation to determine the delta. For an example, a 10dB range (50dB vs. 40dB) is not equal to a 22% delta.
After the noise floor is determined, we log idle fan dB, 50% speed dB, and 100% speed dB (configured in Afterburner). We also measure auto fan dB at an identical stepping for every test; we do this by running Kombustor for exactly 5 minutes prior to beginning dB logging, which is useful for fans which use two push fans. Some dual-push fan cards will only trigger the second fan if the VRM is under load.
Power Testing Methodology
Power consumption is measured at the system level. You can read a full power consumption guide and watt requirements here. When reading power consumption charts, do not read them as a GPU-specific requirements – this is a system-level power draw.
Power draw is measured during a FireStrike Extreme - GFX2 run. We are currently rebuilding our power benchmark.
For regular readers: We have begun the process of migrating off of our Z97 test platform for power. This means that the new power chart is scarcer, but on the same platform as everything else.
Continue to the next page for thermal benchmarks, noise, and power!
AMD RX 480 Thermal Benchmark – Reference Temperatures
Our thermal benchmarking for new architectures goes deep. With Pascal, we ran the GTX 1080 Founders Edition through the usual peak load (average) and thermal vs. time tests, but we added more to it – and that's been carried over. Our benchmarking now includes a two-hour minimum endurance burn-in using real games in looping scenarios. Thermals are logged during this time to uproot potential points of failure or clock throttling, which are not always discovered when using synthetic applications. Furmark, for instance, will only stress the GPU in one specific way and won't vary load in a comparable fashion to a “real” game.
This first chart shows peak (averaged) GPU temperatures. This number is averaged at the same point in the over time graph (further down) for every card. We wait until the temperature asymptotes and stabilizes before averaging the output for an 'equilibrium' value.

The AMD RX 480 runs about as warm as the GTX 1080 FE. AMD's RX 480 cooler lands the chip at 56.33C delta T over ambient when under load. Idle, we're seeing temperatures of 7.58C. The reference GTX 1080, for comparison, runs at 57.51C load and 7.96C idle. Both are handily beaten by AIB partner coolers, which often use dual-fan solutions and larger alloy/copper heatsinks and heatpipes.
Like the GTX 1080 and GTX 1070, the AMD RX 480 seems to peak around 82C absolute when under its stock (auto) settings. We'll look at fan RPM vs. temperature in a moment, along with throttle checks.
AMD RX 480 Thermals Over Time
The data used to generate the above graph is represented below as a “versus time” metric, something we've begun expanding on:
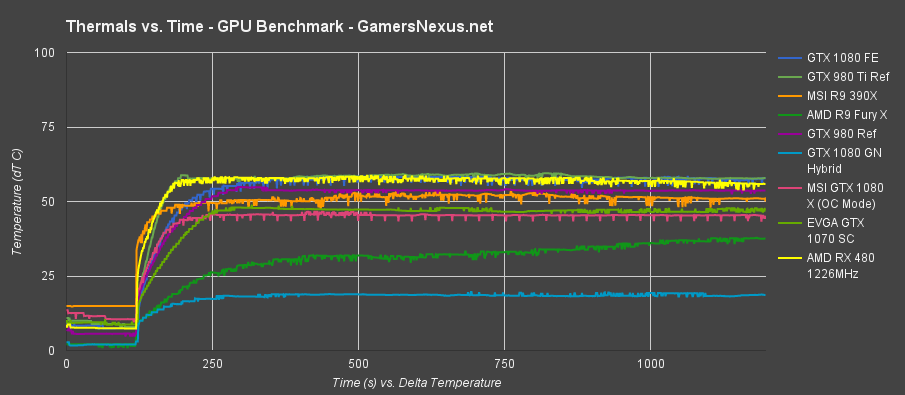
The RX 480 is represented in bright yellow. The GN Hybrid is the lowest temperature line on the chart. The GTX 1080 FE is the dark blue line that collides with the RX 480.
Endurance: AMD RX 480 Thermals versus Frequency (& Thermal Throttling)
The clock-rate is a little shaky at first as dynamic clock fluctuations range from 300MHz to the boosted 1266MHz, but this is stabilized as the card ramps into its workload.
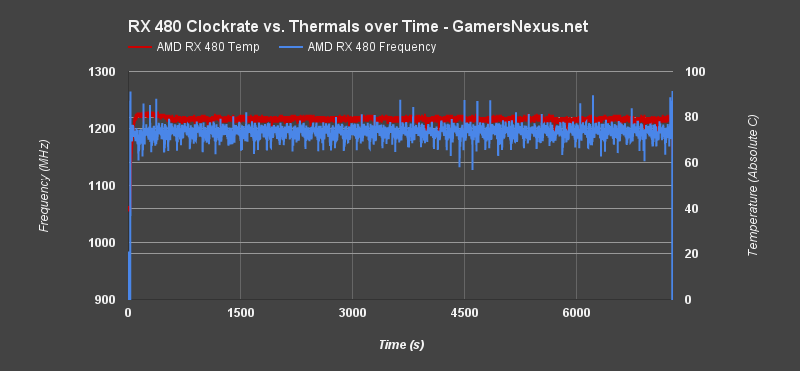
Let's zoom-in on one of the spikes to better detail the “amplitude” of our line:

This chart is cropped to 4200-4600 seconds of the test. We see fluctuations from ~1150MHz to ~1240MHz, which is nearly a 100MHz range. That's enough to cause a very brief dip in 0.1% low and 1% low frametimes (both of which improved with our core-locked overclocking), but is otherwise easily overlooked during gameplay. These fluctuations happen so rarely that the impact is only occasionally noticed – we're talking a few times per hour, if that – and only if the user is looking for such fluctuations.
Here is a look at some of the data from the above slice:
| MHz | Tmp (C) |
| 1186.9 | 81 |
| 1162.1 | 79 |
| 1184.2 | 81 |
| 1183 | 79 |
| 1183.6 | 79 |
| 1183.2 | 79 |
| 1183.4 | 80 |
| 1179.3 | 79 |
| 1192.7 | 80 |
| 1190.5 | 80 |
| 1191.3 | 80 |
| 1193.8 | 79 |
| 1193.7 | 79 |
| 1193.3 | 80 |
| 1184.7 | 73 |
| 1190.7 | 78 |
| 1189.3 | 79 |
| 1189.3 | 80 |
| 1187 | 78 |
| 1188.7 | 78 |
| 1191.6 | 79 |
| 1188.2 | 80 |
| 1192 | 79 |
| 1189.1 | 79 |
| 1182.8 | 79 |
| 1192 | 79 |
| 1179.6 | 80 |
| 1182.4 | 79 |
| 1182.6 | 78 |
| 1185.7 | 80 |
| 1182.9 | 79 |
| 1188.8 | 80 |
| 1185.8 | 80 |
| 1195.8 | 78 |
| 1193.8 | 79 |
| 1201 | 78 |
Most of this fluctuation is a result of AMD's new dynamic clock, which adapts to pre-defined states in WattMan as workload changes. The rest is resultant of thermals – we're seeing some throttles once temperatures exceed 80~82C, but this can be overridden in Wattman by increasing the max temperature. Of course, fan RPMs can also be increased.
AMD's clock-rate stability is reliable and steady, something for which we commend the company's work on its new process and power management.
And for the curious, here is a chart comparing the fan RPM to the temperatures. Again, this is with all settings stock – so you're looking at out-of-box fan RPM & temperature target performance:
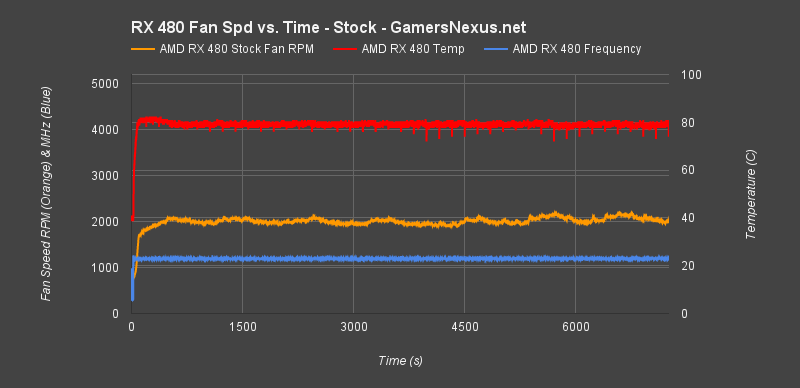
The red line represents temperature (plotted against the right axis, absolute temperature *C). The blue line represents frequency in MHz (plotted against the left axis). The orange line represents fan RPM (plotted against the left axis, in RPM).
In order to sustain the card's ~82C resting area and 1200~1300MHz stock clock-rate (boosted – so it's dynamically fluctuating), the blower fan must spin at approximately 2000~2300RPM. The specific sound of this fan is demonstrated in our video review that's embedded on the first page, but we've also got some objective metrics.
AMD RX 480 Reference Noise Levels / Decibel Output
The below formula is used to determine delta values with decibels:
![]()
Calculating dB deltas is not a simple subtraction; decibel addition and subtraction follows a logarithmic function. We extract the ambient noise (~25-27dB) from these system noise results to create linearly comparable dB readings. For more, our noise test methodology is explained on the Test Methodology page.
We're testing for Idle, Auto, 50% Fan, and 100% Fan noise levels. Idle is conducted at the desktop. For “Auto,” we run a burn-in test for 5 minutes and allow the card to ramp into its curve, then monitor fan noise and RPM from there. The AMD RX 480 fan spins maximally at 5200RPM, so our 50% speed setting plants the RPM at 2600, with 100% blasting the fan at its max speed. All extra bench fans are disconnected.
Note that the below chart is representative of total system noise. As our PSU and CLC pump make some amount of fan / vibrational noise, the quietest operation will always hinge on those two devices. Even with a passive video card, we'd still be in the ~37.1dB range.
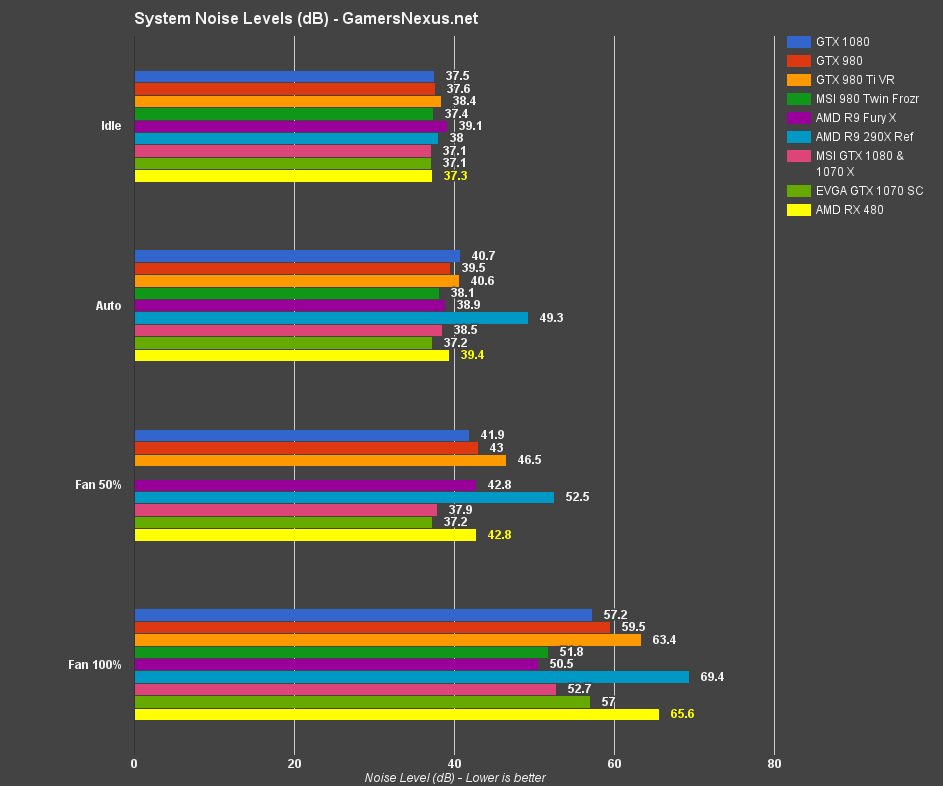
AMD's RX 480 peak system noise is hitting ~37.3dB when idle, which is about identical to the AIB EVGA & MSI 1070 cards (represented by the same line, as it's the same performance). AMD's fan spins at just ~780RPM when under no load, keeping the card in the 7-8C (dT) range while maintaining the 37.3dB noise output. The stock GTX 1080/1070 Founders Edition cards run about 37.5dB during this test.
After some gaming and initializing our next test, the “auto” fan speed finds its resting point in the 2000~2300RPM range and produces a total system noise of 39.4dB.
50% fan speeds are going to be the most common during drawn-out gaming sessions. We hit 42.8dB on the RX 480, now overtaking the GTX 1080/1070 FE's 41.9dB. AMD's card becomes louder at this point for a few reasons, but the most obvious is raw RPM – AMD's fan just spins faster, which generally pushes higher noise levels.
100% fan speed is utterly unbearable. At this point, the rest of the system noise becomes irrelevant, as it's all drowned-out by the GPU blower fan. You would not ever want to approach this fan speed. In fact, in our endurance OC tests (discussed on P6), we found the ~70-80% fan speed similarly unbearable. The fan had to run at ~3800~4300RPM to sustain our overclocks, something that drove us out of the room a few times for a break from the noise.
Like the GTX 1080 FE in some instances, and AMD's Fury X (though that was a pump whine issue), the RX 480 produces a high frequency output at some RPMs. The high frequency output is describable most accurately as a “whine,” but is mostly detected once passing the 50% RPM fan speed. Until this point – and most gaming use cases will keep the fan at or below 50% RPM – the whine exists in some capacity, but would not be detected by any user keeping the card in a traditional PC case. On the open air bench, it is slightly noticeable, but easily ignored.
Once passing 50% fan speed, the whine becomes significantly more annoying and would be a little maddening during long run-times. This should only be a hurdle for overclockers or users with severe heat issues caused by other parameters, like poor ventilation.
If you want to hear this noise yourself to determine if it is a problem for your use case, we'd recommend checking out our RX 480 noise video that's going live at 10:00AM EST today (June 29). That video will be here.
AMD RX 480 Power Consumption & System VA Draw
NOTE: We're currently rebuilding our power benchmarking methodology and platform. We've been using a Z97 platform for some time now, but have finally migrated to the X99 platform. These cards are the first to be run through the power bench. It is scarcer right now than our Z97 platform was, but the chart will fill-in as we put new cards through it. We will be rebuilding this chart one more time in the near future, but these numbers will give us a performance baseline for the RX 480:
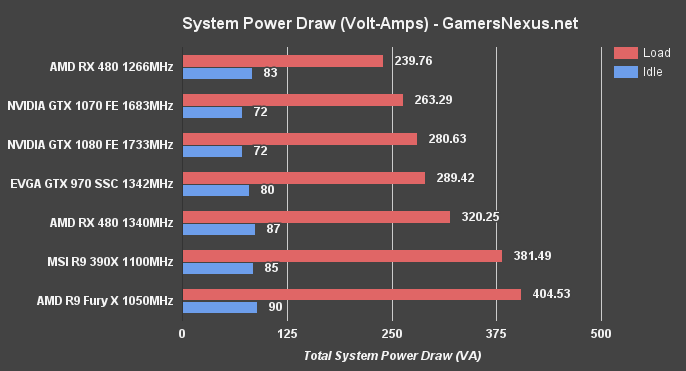
We're looking at VA (apparent power consumption) here. Total system load with the RX 480 (stock clock) sat at 239.76VA, the lowest of the tested cards (to include the GTX 1070). The GTX 1070 FE reports 263.29VA, with the 1080 at ~280.63VA. The GTX 970 SSC has an extra power header and a max board power of ~202W, pushing it past the 1080, 1070, and RX 480 in power draw (289.42VA). Overclocking the RX 480 does see a fairly large power jump, but nothing abnormal.
Continue to the next page for DOOM & Dx12/Vulkan benchmarks.
OpenGL DOOM – AMD RX 480 vs. GTX 1070, GTX 970, GTX 1080
We first benchmarked DOOM on launch day, when we revealed issues with AMD's R9 390 series GPUs. Those issues were later resolved in an AMD driver hotfix, something we validated in a re-test; the performance improvement on the R9 390X was upwards of 20-25%. The other AMD GPUs were not affected by this launch-day issue, and saw no performance difference following the hotfix.
Developers id Software have appeared at both the NVIDIA 1080 press event and AMD Macau press event, batting for both teams and showing a general interest in optimizing their OpenGL title. At the AMD press event, the id Software team reminded attendees that Vulkan is forthcoming. The brief id Software presentation concluded with a comment that the RX 480 proves “you don't need a $700 graphics card” to play DOOM on higher settings – a clear reference to the GTX 1080.
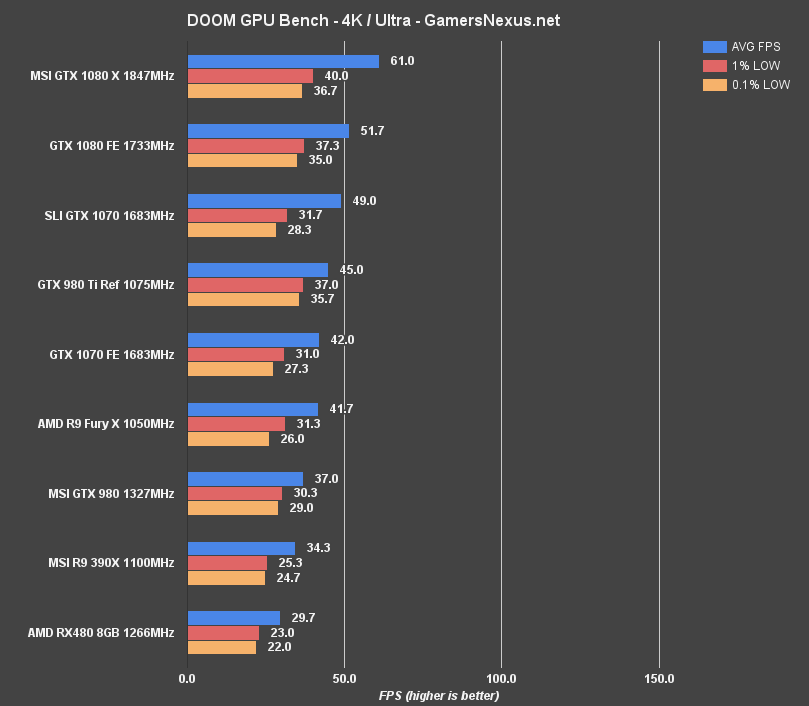

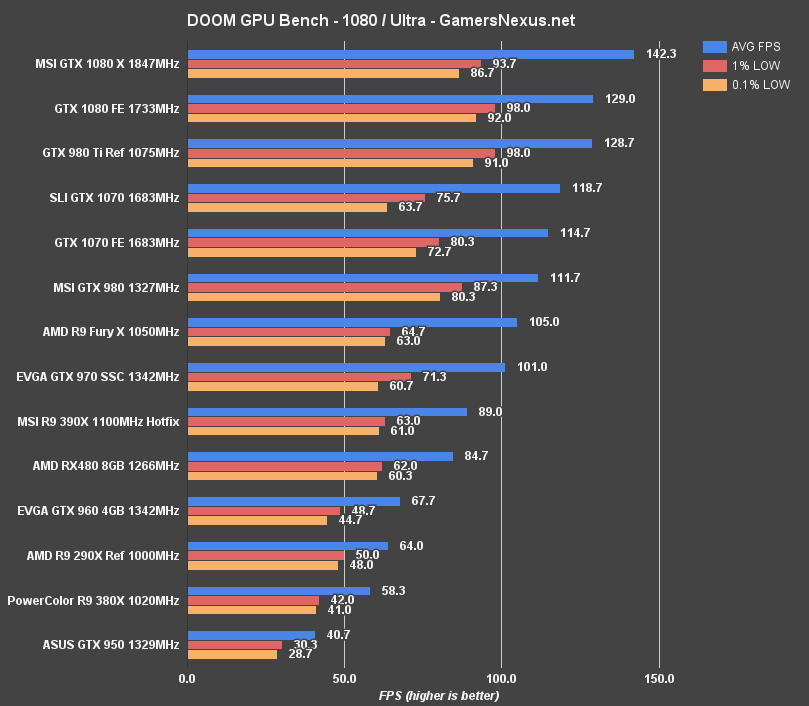
At 4K, DOOM is unsurprisingly not playable on the RX 480 – but it's still worth testing to see performance baselines. The RX 480 outputs 29.7FPS at 4K ultra, with the 390X operating ~4-5FPS faster in AVG FPS.
At 1440p, the RX 480 runs at 56.3FPS AVG, with tightly timed 43.3 and 42.3FPS 1% and 0.1% lows. The RX 480 is 23.6% faster than the GTX 960 4GB and 33% faster than the R9 380X. The R9 390X operates at 62FPS AVG, or 10.1% faster than the RX 480. The GTX 970 outperforms both, with an average of 66FPS and lead of 17% over the RX 480. NVidia's new GTX 1070 runs approximately 43.8% faster than the RX 480.
1080p in DOOM was also tested, where we saw the RX 480 land between the 390X at 89FPS and the GTX 960 at 67.7FPS, with the RX 480 at 84.7FPS. The GTX 970 outperforms all of those, running 101FPS – or a speed increase of 16.1% over the RX 480.
Comparative Dx12 vs. Dx11 FPS in Ashes of Singularity – RX 480 vs. 1070, 970, 390X
Ashes of the Singularity remains one of the best-built DirectX 12 benchmarks to-date, having been developed from the ground-up with Dx12 in mind. We test Ashes for framerate (AVG) and frametimes (AVG), using that data to build a latency % change chart (lower down). This chart is useful for determining the efficacy of a particular card or architecture at extracting performance out of new APIs.
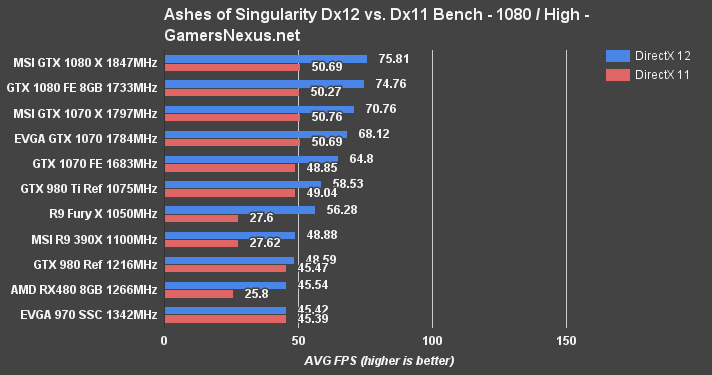
The RX 480 performs at 45.54FPS AVG when running Dx12 for 1080p / High. The previous Dx11 choke-point we discovered on the R9 Fury X and R9 390X still exists within Polaris architecture, and is present in the form of a near 2x gap between Dx12 and Dx11 performance. Leveraging Dx12, the RX 480 and GTX 980 are almost at parity with each other – and may as well be, since no one can reasonably observe a ~3FPS delta. That's not quite true with Dx11, though.
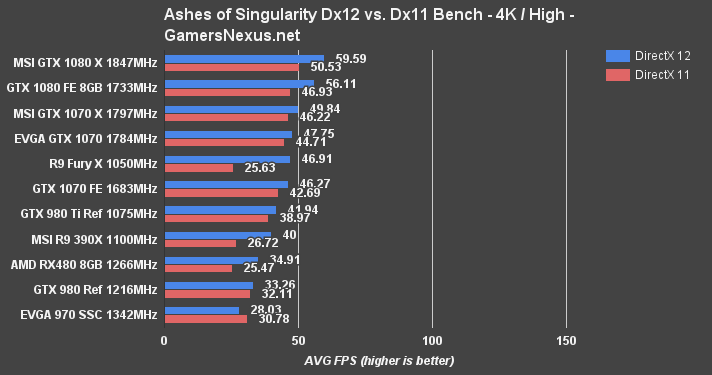
At 4K/High, the RX 480 operates at 34.91FPS AVG (Dx12) and 25.47FPS AVG (Dx11). The R9 390X is approximately 14.58% faster than the RX 480 with Dx12 performance, and the RX 480 is 4.7% faster than a single GTX 980. It seems that Ashes of the Singularity works particularly well on the RX 480 – which makes sense, as AMD's unveil used the game to point toward CrossFire scaling that allegedly exceeds GTX 1080 performance. We'll validate this independently in the near future.
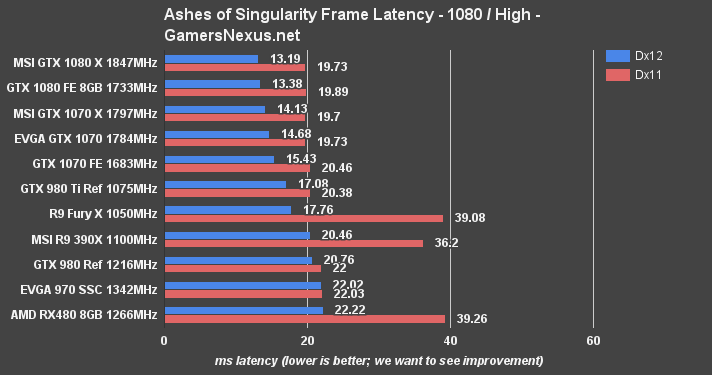
This frametimes chart shows 1080p/high performance with average milliseconds between frames as the X axis. The RX 480 sees a massive improvement in Dx12 over Dx11, though is still about even with the GTX 970 in total average frame pacing. AMD's architecture advances this trend through its Fury X and R9 390X cards.
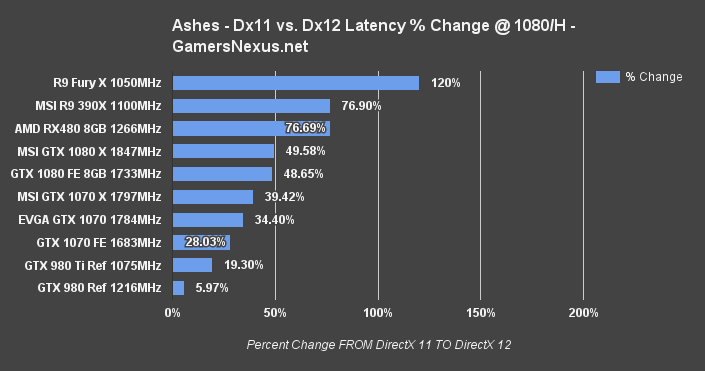
The RX 480 and Polaris 10 architecture benefit nearly 77% by moving to from Dx11 to Dx12, similar to what's seen on last generation's 390X. The Fury X looks a bit exaggerated here, since its Dx11 performance is so plainly dismal that any gain looks massive.
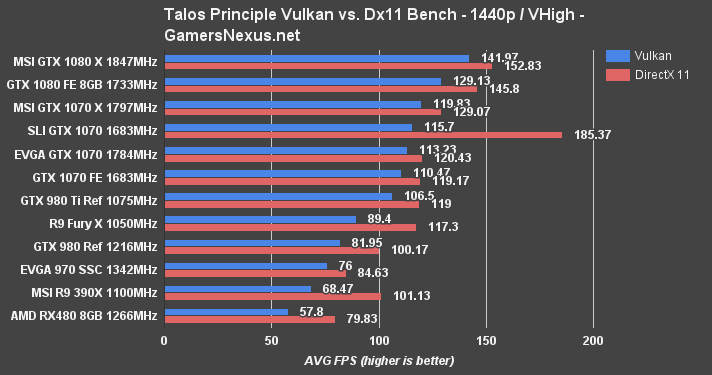
Comparative Vulkan vs. Dx11 in Talos Principle – RX 480 vs. 1080, 970, 1070, Fury X
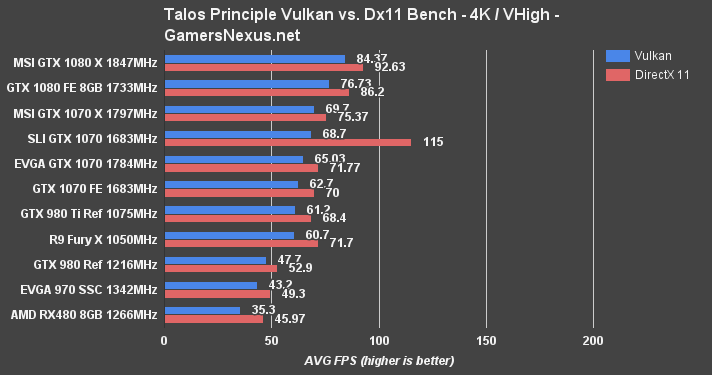
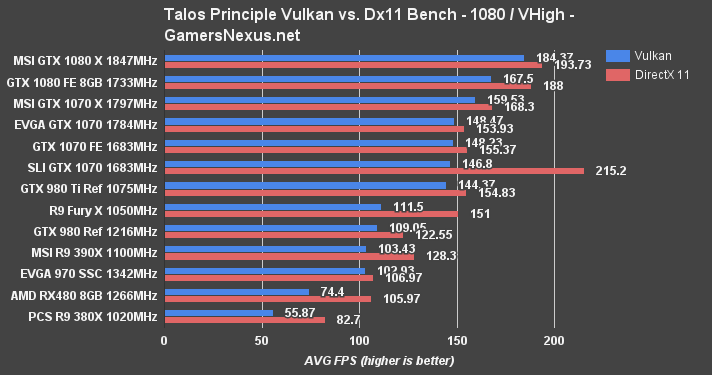
The Talos Principle is still largely unoptimized and acts more as a proof of concept than a proper benchmark, at this time – but it's the best we've got for Vulkan. At least, it is until DOOM pushes its major patch.
We're presently seeing RX 480 performance about equal with the GTX 970 when using DirectX 11 in The Talos Principle, though Vulkan permits the GTX 970 to wrest top spot from the RX 480. And by large margins, too – Talos Principle seems to favor the GTX 970 by 32.17% over the RX 480 (Vulkan, 1080p).
Continue to the next page for Dx11 gaming benchmarks.
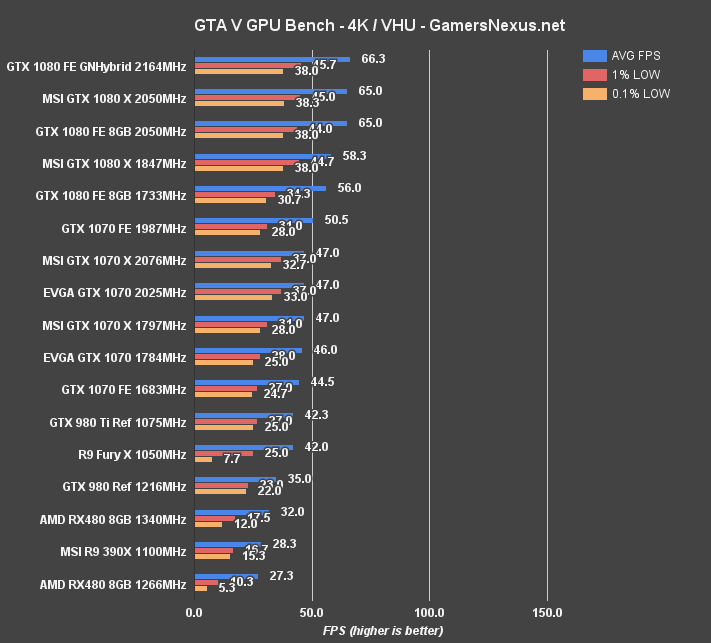
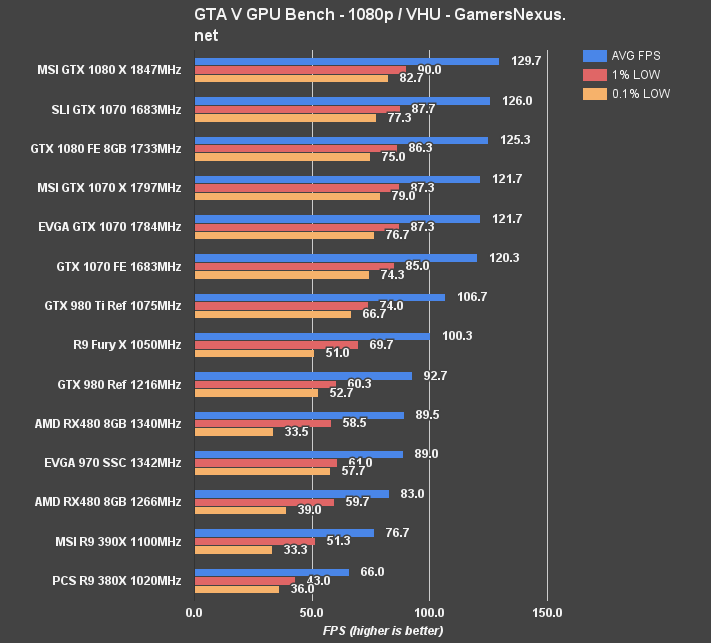
GTA V Benchmark on RX 480 vs. GTX 970, 1070, 960, 390X, etc.
There are some severe stuttering issues currently occurring on the RX 480 in GTA V. We contacted AMD about this issue, and the company acknowledged the stuttering and has told us that a fix is in progress. AMD hopes to deliver a fix for the stuttering in a driver update prior to consumer receipt of the card, but the company has not yet (as of this writing) identified the cause.
GTA V is one of our longest standing, most reliable benchmarks. Learn more about individual graphics settings for GTA V over here.
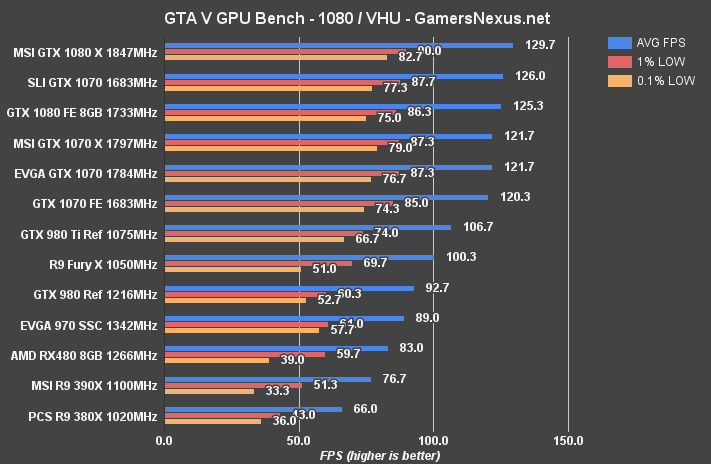
The RX 480 operates at 83FPS AVG for GTA V at 1080p. Because we average our values, the whole story isn't told here. Here's a look at the raw data from three test passes:
| GTA V 1080p | ||
| Avg FPS | 1.0% low | .1% low |
| 85 | 61 | 56 |
| 85 | 61 | 55 |
| 79 | 57 | 6 |
The 0.1% low metric in our third test pass was jarred by a 6FPS hiccup, which was visibly noticeable during the benchmark. We demonstrate the stuttering in our video. This issue was even more prevalent during the second-to-last scene before our benchmark initializes, where a pier is shown with a timelapsed sunrise and sunset. The average framerate technically exceeds the 390X (+7.6%) and 380X (+20.48%), with a -7% drag behind the 970, but playability on the RX 480 is hindered by these stutters and “frame drops.” This is present in our 1% and 0.1% low metrics, where the GTX 970 SSC sustains significantly higher performance values.
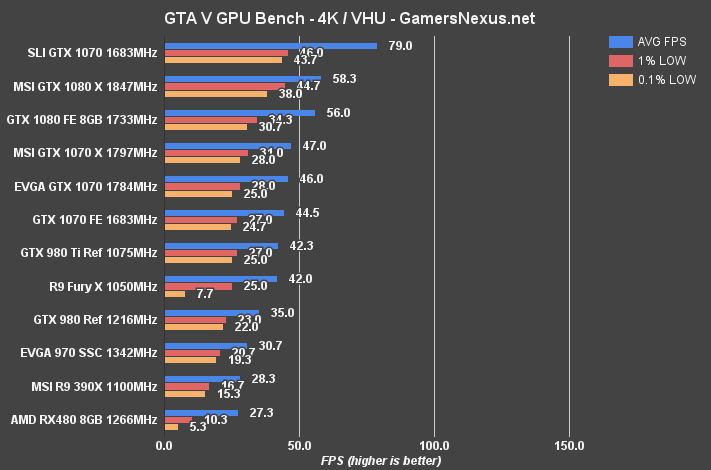
Looking at 4K, something similar happened:
| GTA V 4K | ||
| Avg FPS | 1.0% low | .1% low |
| 28 | 15 | 6 |
| 27 | 7 | 5 |
| 27 | 9 | 5 |
Not that the game's particularly playable anyway, but there it is. We also ran the GTA V benchmark at 1440p, finding the following results:
| GTA V 1440p | ||
| Avg FPS | 1.0% low | .1% low |
| 59 | 34 | 27 |
| 60 | 37 | 32 |
| 60 | 35 | 6 |
The good news, then, is that the RX 480 can somewhat easily sustain 60FPS averages in GTA V – the golden number – and brings 1440p playability into the realm of a $240 graphics card. That is, if the stuttering issue can be resolved.
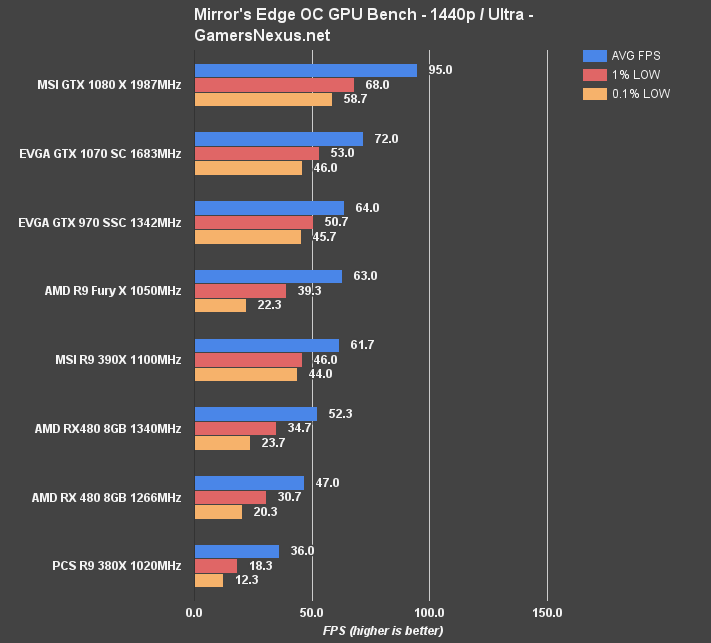
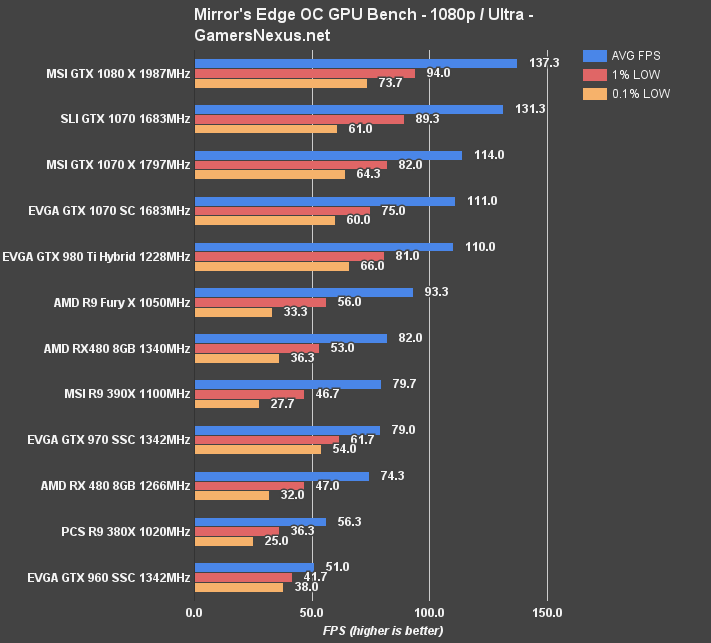
Mirror's Edge Catalyst Benchmark on RX 480 vs. 380X, 390X, 970, etc.
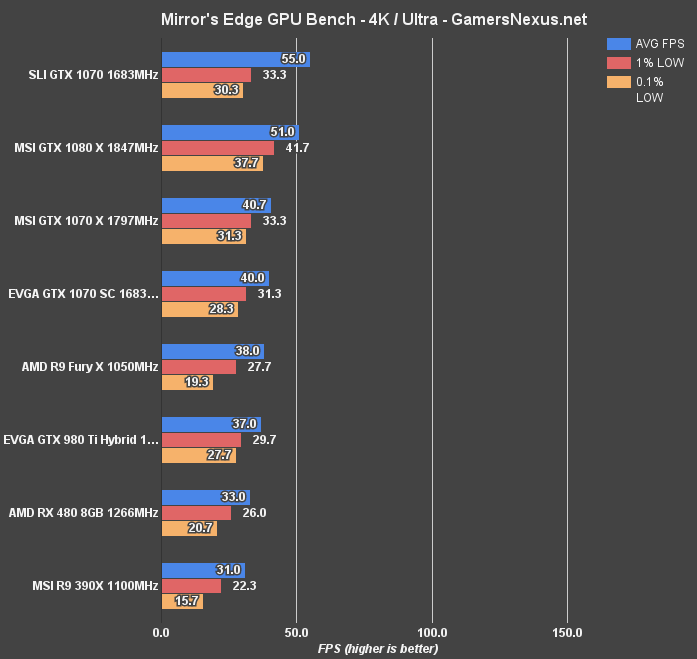
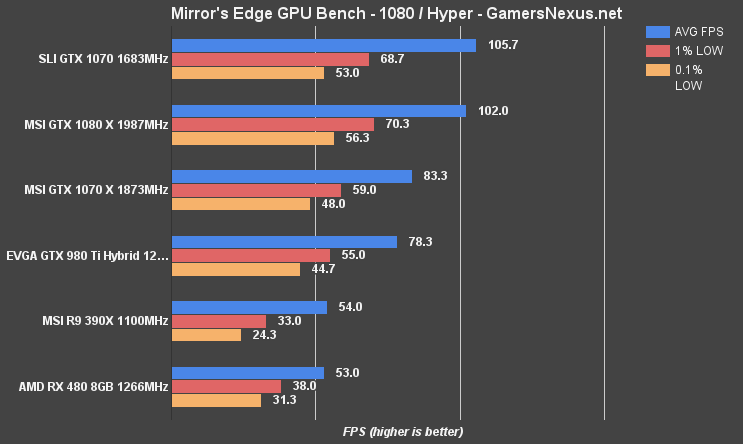
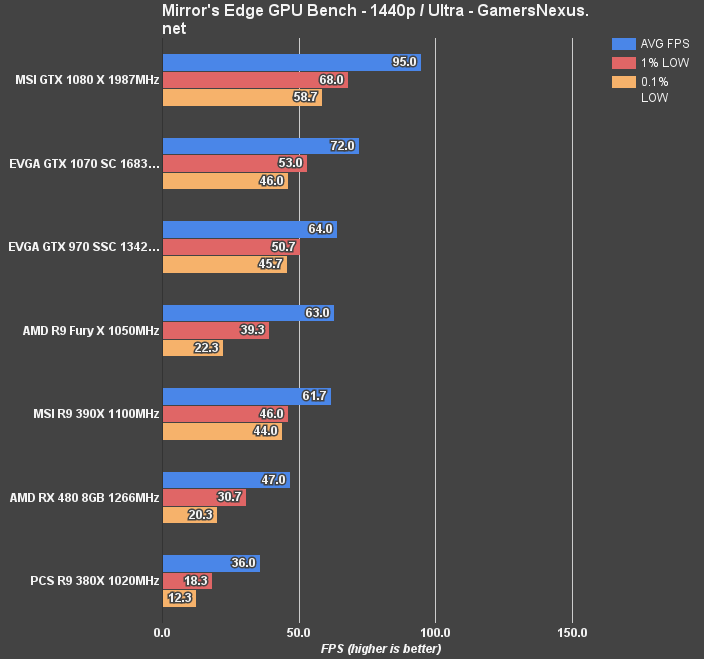
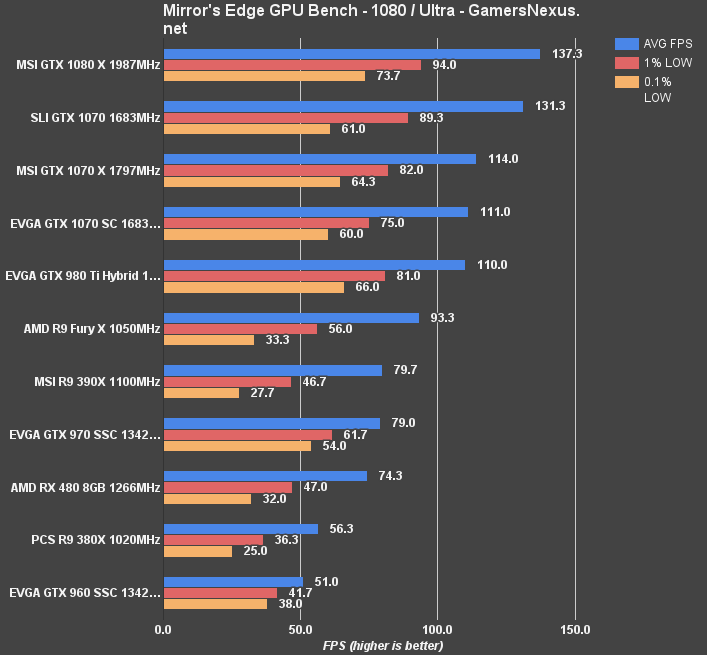
(Note: Some ME Catalyst tests were revisited following patches and driver updates).
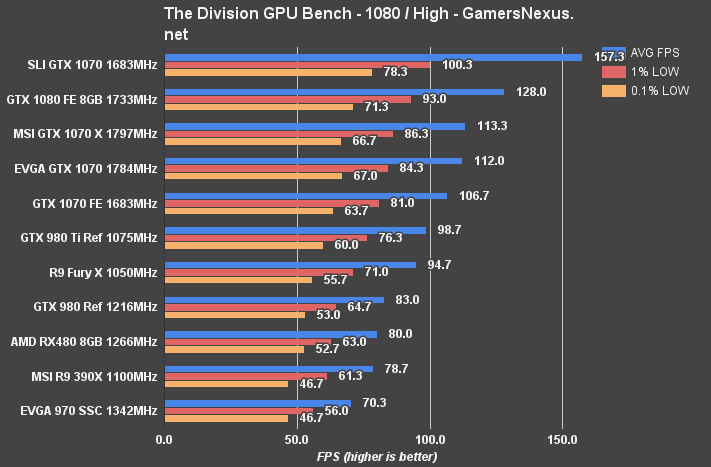
The Division Benchmark – RX 480 vs. GTX 1080, 1070, 970, 960, 380X
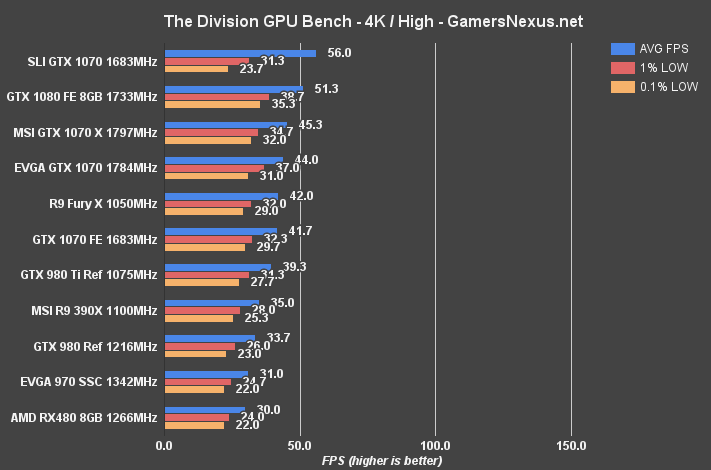
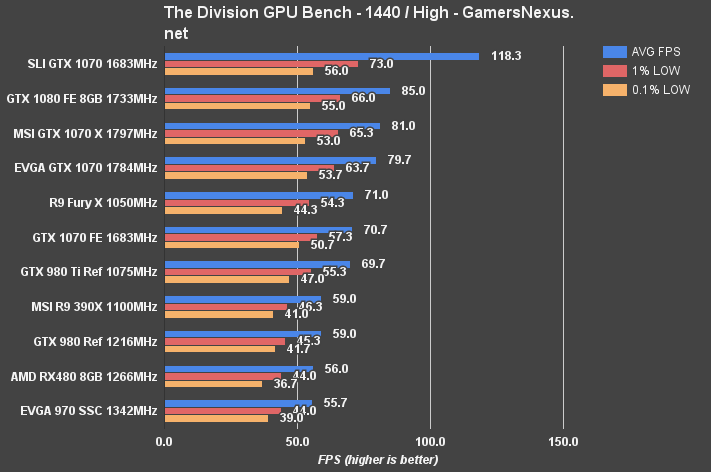
The Division at 1440p plants the RX 480 at 56FPS AVG with reasonably timed 1% and 0.1% low metrics. The GTX 980 Reference card is 3FPS faster than the RX 480, or 5.4%. The RX 480 is effectively identical to the GTX 970 in performance (0.3FPS difference).
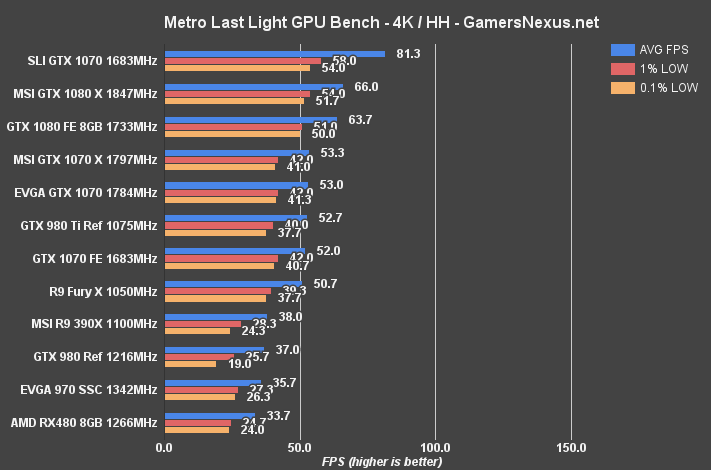
Metro: Last Light Benchmark – RX 480 vs. GTX 1080, 980 Ti, More
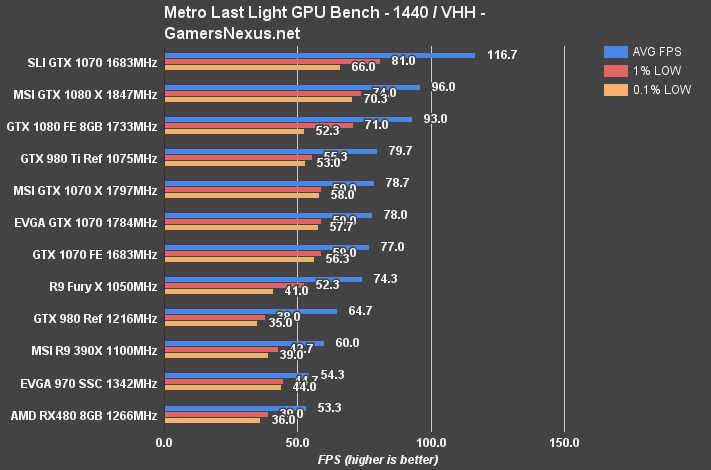
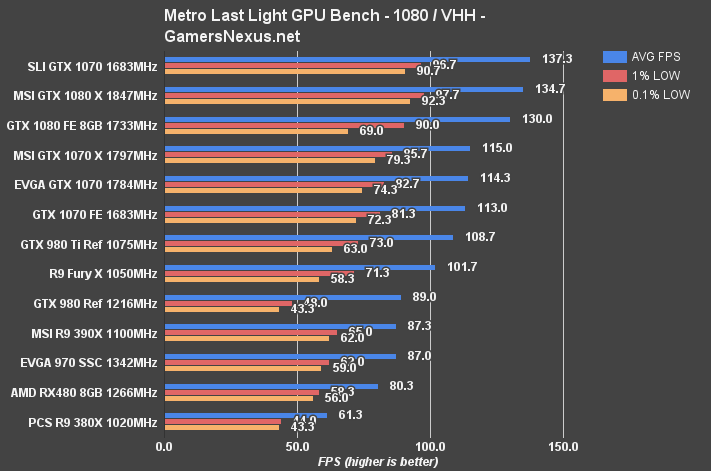
At 1440p, the RX 480 falls below the GTX 970 and R9 390X, with the RX 480 pushing 53.3FPS AVG and 38FPS 1% lows. The GTX 970 is marginally ahead (~1FPS), and the R9 390X runs about 7FPS faster than the RX 480.
Dropping to 1080p plants the RX 480 at 80.3FPS AVG, about 23.6% faster than the R9 380X. The GTX 970 is about 7.7% faster than the RX 480. The GTX 1070 FE is 28.9% faster than the RX 480.
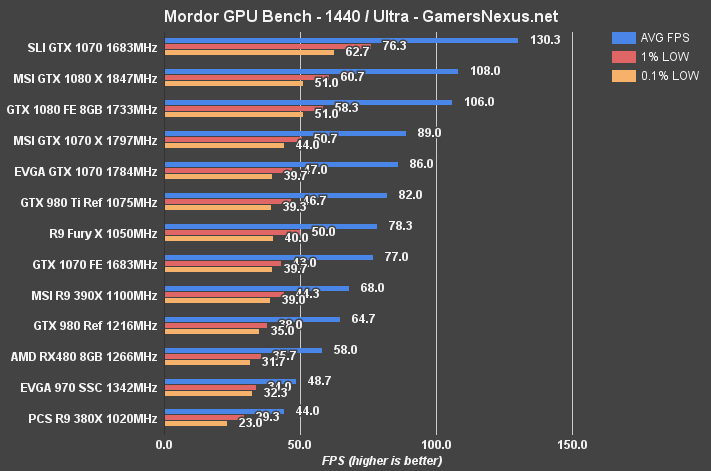
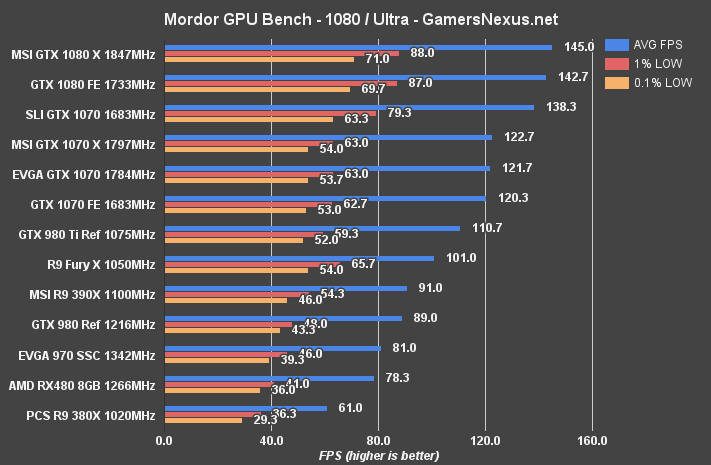
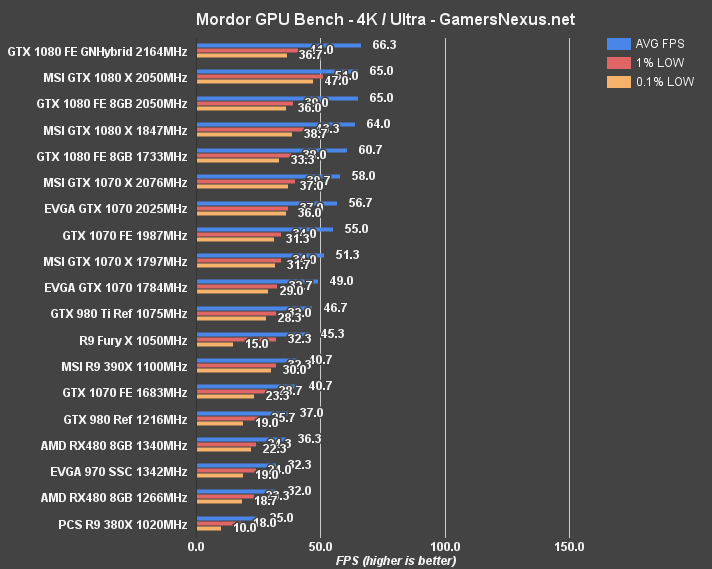
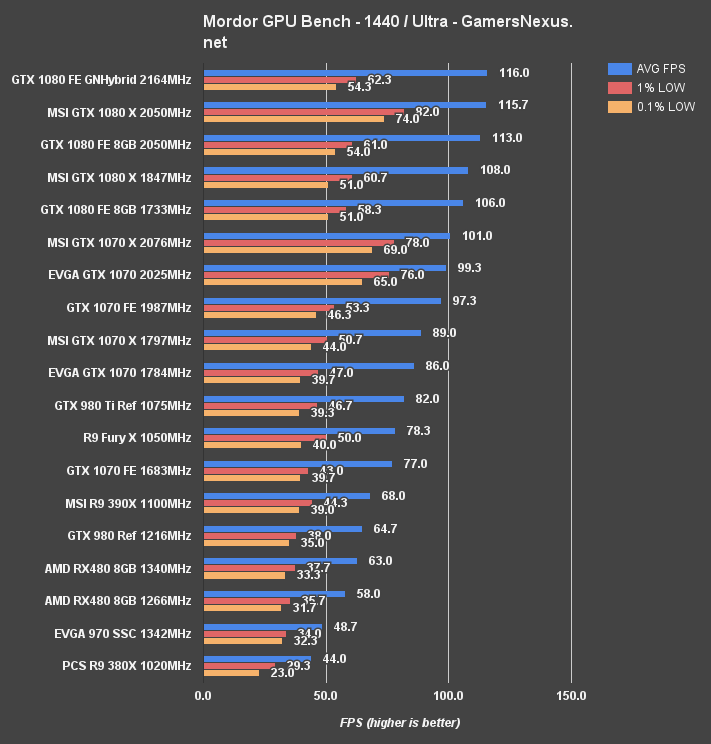
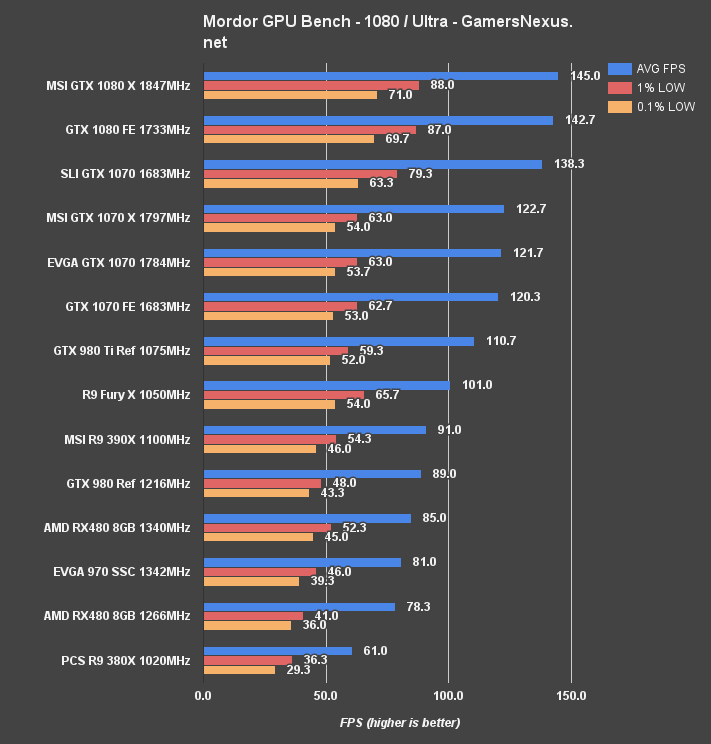
Shadow of Mordor Benchmark – GTX 1080 vs. 980 Ti, Fury X at 4K, 1440, & 1080
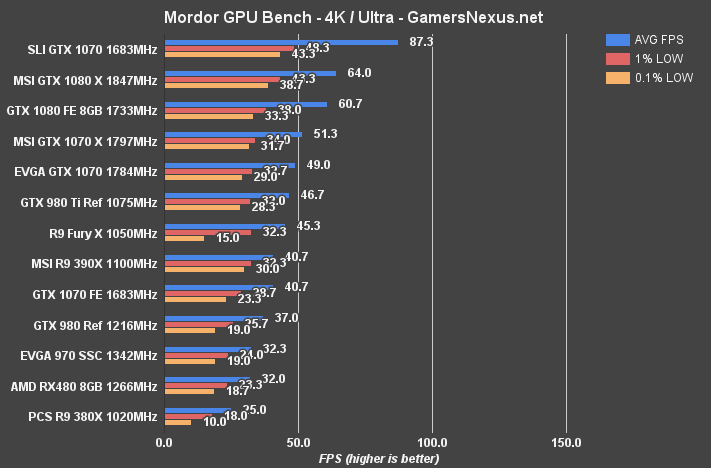
The RX 480 isn't really built for 4K gaming – and neither is the 970 – but we still stress-test our cards at the three 'big' resolutions. At 4K, the RX 480 is outputting performance effectively equivalent to that of a GTX 970 SSC ($270). Margin of error accounts for the gaps between these two cards. The R9 390X is approximately 27.19% faster than the RX 480 at 4K. The GTX 1070 FE outputs the same AVG FPS, and is therefore also ~27.19% faster in its averages.
At 1440p, the RX 480 comes into play with a 58FPS AVG, 35.7FPS 1% low, and 31.7FPS 0.1% low. This plants it within the realm of good “playability,” and could easily match 60FPS with a few small tweaks to High settings. The R9 390X is approximately 14.7% faster than the RX 480 at 1440p average FPS, and sustains ~20.5% faster 1% low frametimes. The RX 480's AVG FPS is approximately 47.6% different from its 1% low values, though at this average, that's acceptable.
1080p pushes the RX 480 to 78.3FPS AVG. The percentage difference versus 1% low and 0.1% low frametimes has widened – now at 62.5% – and mostly mirrors the percentage difference exhibited on the GTX 1070 (~57% different between AVG & 1% FPS). At 1080p, the GTX 970 is 3.3% faster than the RX 480, the GTX 980 is ~8.99% faster, and the R9 390X is 10.99% faster. The new GTX 1070 maintains a powerful lead and is 35% faster in AVG FPS than the RX 480.
Call of Duty: Black Ops III Benchmark – RX 480 vs. 1070 at 1080p, 1440p, 4K
Call of Duty: Black Ops III has always seen performance gains with AMD hardware that are often not found on other titles. BLOPS3 is also exceptionally well-optimized after its launch patch, making it a good benchmark title.
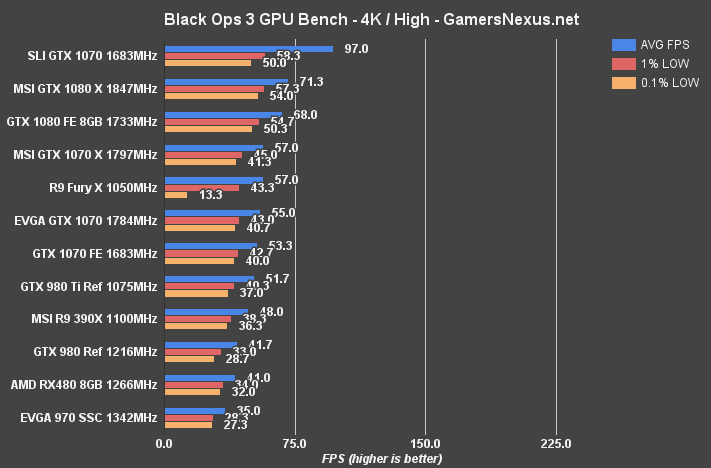
At 4K, the RX 480 runs 41FPS average and sits below the target 60FPS mark for this FPS. The card is outperforming the GTX 970 at this point, but that's moot given the generally unplayable nature of the output.
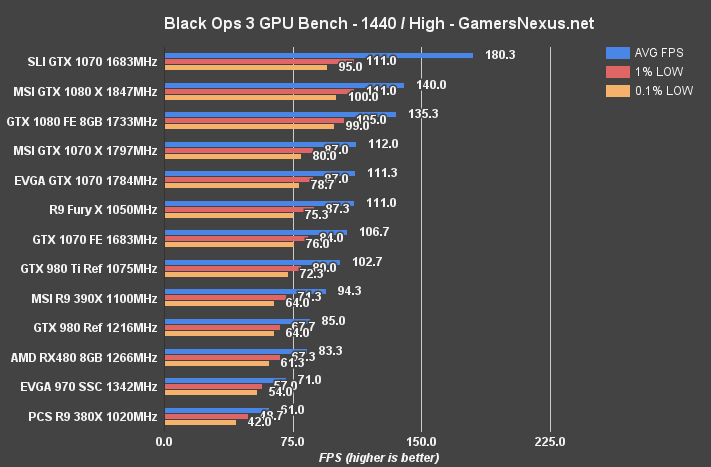
Moving to 1440p, the RX 480 is now operating at 83.3FPS average, with tightly timed 1% and 0.1% lows that remain above the 60FPS threshold. This makes the RX 480 14.77% faster than the GTX 970, so the two trade blows here, and nearly ties the 480 with the GTX 980. The R9 390X outperforms all these cards with its 94.3FPS. The GTX 1070 FE is at 106.7FPS, or 28.1% faster than the RX 480.
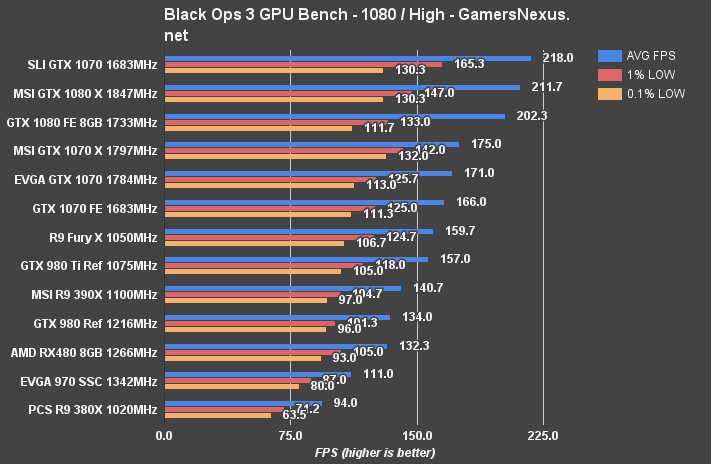
1080p would mostly permit 144Hz-ready framerates, if accompanying the RX 480 with a few settings reductions from High.
Continue to the next page for overclocking.
How to Overclock the RX 480 & Polaris GPUs
Overclocking the RX 480 is only possible through AMD's WattMan software right now. Keep in mind that this testing was conducted pre-launch, but it is likely that the usual crew of AIB partner utilities will update as the RX 480 rolls out to market. For now, Afterburner is not compatible, leaving us to rely on AMD's software.
This time, though, that's an OK thing to rely on. WattMan is a massive improvement over OverDrive (now dead, thankfully), and allows enthusiast-level fine-tuning over most normal OC functions. Something like Afterburner may remove a few restrictions, but there don't seem to be many in place with the Radeon Settings utility.
WattMan allows dynamic or fixed clock speed modulation, controlled through a toggle and then through sliders (or manually input numbers). We switched to manual control and then configured the numbers to be equal across all 7 DPM states, since we don't much care for power savings when running OC testing. vCore can be tuned per state or left to automated control. Manually tuning vCore allows movement up to 1150mV. Power percent target increases to +50%, which grants us an additional 50% of base power to increase the clock and voltage. Memory overclocking is done with memory MHz offsets and memory voltage control (can be left to 'auto'). Thermal targets and fan RPM targets are relatively self-explanatory.
AMD RX 480 Max Overclocking Results
Here's our stepping table that shows the RX 480's overclock progression.
| Core Clock (MHz) | Mem CLK (MHz) | Mem Offset (MHz) | Power Target (%) | Voltage | vCore Offset | 5m Test | 60m Endurance | Fan target |
| 1266 | 2000 | 0 | 100 | 1.05 | 0 | P | P | Auto |
| 1280 | 2000 | 0 | 150 | 1.075 | 1100 | P | - | 3500 |
| 1300 | 2000 | 0 | 150 | 1.0813 | 1110 | P | - | 3500 |
| 1320 | 2000 | 0 | 150 | 1.0875 | 1110 | P | - | 3500 |
| 1350 | 2000 | 0 | 150 | 1.0875 | 1110 | F | - | 3500 |
| 1340 | 2000 | 0 | 150 | 1.1 | 1130 | F | - | 3500 |
| 1340 | 2000 | 0 | 150 | 1.1 | 1130 | F | - | 3800 |
| 1340 | 2000 | 0 | 150 | 1.1 | 1130 | F | - | 3800 |
| 1340 | 2000 | 0 | 150 | 1.1187 | 1140 | F | - | 3800 |
| 1340 | 2000 | 0 | 150 | 1.125 | 1150 Max | P | - | 3800 |
| 1340 | 2100 | 100 | 150 | 1.125 | 1150 | P | P | 4100 |
| 1350 Max | 2100 | 100 | 150 | 1.125 | 1150 | P | F | 4100 |
| 1340 | 2150 | 150 | 150 | 1.125 | 1150 | P | P | 4100 |
| 1340 | 2200 | 200 | 150 | 1.125 | 1150 | P | P | 4100 |
| 1340 | 2250 | 250 | 150 | 1.125 | 1150 | F Flickering | - | 4100 |
Voltage ended up around 1.125V, power target at 150%, and we configured the frequency (manually, across all states) to 1340MHz (~+74MHz offset from Boost). This effectively disables Boost. Memory was configured to 2200MHz (+200MHz offset) and left to a single state. Memory voltage control was left to WattMan to handle on auto, while vCore was manually tuned to its maximum setting of 1150mV.
Following this, we performed a two-hour burn-in of the overclock and created the below chart:
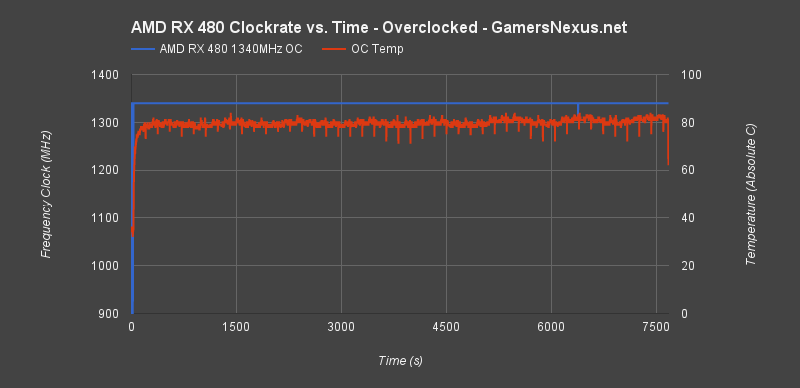
This shows Metro: Last Light at 1440p (Very High with High tessellation) hammering the GPU for about two hours. The clock-rate, represented by the blue line, was almost perfectly stable at 1340MHz. There was only one anomalous instance where the clock dipped below 1340MHz, and that dip was inconsequential.
Temperature fluctuates pursuant to our fan speed configuration, which was a range of 3800~4300RPM, depending on test. This was loud and largely unbearable, but fine for burn-in. We would advise that any “real” user stay away from RPMs approaching and exceeding 4000.
GTX 1080 Founders Edition Overclocking Results
Here's our 1080 FE stepping, for reference. Note: Specific OC settings cannot be compared cross-architecture!
| Core Clock (MHz) | Core Offset (MHz) | Mem CLK (MHz) | Mem Offset (MHz) | Power Target (%) | 5m Test | 60m Burn-in |
| 1733 | 0 | 5005 | 0 | 100 | Pass | Pass |
| 1880 | 150 | 5305 | 300 | 120 | Pass | - |
| 1974 | 171 | 5305 | 300 | 120 | Pass | - |
| 1987 | 190 | 5305 | 300 | 120 | Pass | - |
| 2025 | 210 | 5305 | 300 | 120 | Pass | - |
| 2050 | 230 | 5305 | 300 | 120 | Fail Driver Crash | |
| ~2030 | 220 | 5400 | 400 | 120 | Pass | Pass |
GTX 1070 Founders Edition Overclocking Results
Here's our 1070 FE stepping, for reference. Note: Specific OC settings cannot be compared cross-architecture!
| Core Clock (MHz) | Core Offset (MHz) | Mem CLK (MHz) | Mem Offset (MHz) | Voltage | Voltage Offset | Power Target (%) | 5m test | Endurance |
| 1771 | 0 | 4006 | 0 | 950mv | 0% | 100% | P | - |
| 1936 | 150 | 4151 | 300 | 1000mv | 30% | 112% (max) | P | - |
| 1974 | 200 | 4353 | 350 | 1000 | 30 | 112 | P | - |
| x | 250 | x | 400 | 1000 | 30 | 112 | F | - |
| 1974 | 200 | 4374 | 375 | 1000 | 30 | 112 | P | - |
| x | 250 | x | 375 | x | 30 | 112 | F | - |
| 2015 | 225 | 4374 | 375 | 1000 | 30 | 112 | F | - |
| 1974 | 200 | 4374 | 375 | 1000 | 30 | 112 | P | - |
| 1974 | 200 | 4404 | 400 | 1000 | 30 | 112 | P | - |
| 1974 | 200 | 4455 | 450 | 1000 | 30 | 112 | P | - |
| 1987 | 215 | 4498 | 500 | 1000 | 30 | 112 | P | - |
| 1987 | 215 | 4551 | 550 | 1000 | 30 | 112 | P | - |
| 1987 | 220 | 4551 | 550 | 1000 | 30 | 112 | F | - |
| 1987 | 215 | 4608 | 600 | 1000 | 30 | 112 | P | P |
| 1987 | 215 | 4704 | 700 | 1000 | 30 | 112 | artifacts | - |
AMD RX 480 – Overclocked FPS vs. Stock
Here's the output:
We're looking at a range of ~5% to 10% change, depending on the game. Not massive, but enough to help push past 60FPS in some instances.
Mirror's Edge Catalyst shows some reasonable gains:
Continue to the final page for the conclusion.
AMD RX 480 Conclusion & Impressions
The RX 480 ($240) is an interesting card. It's effectively a flagship launch, being the unveil of Polaris, but it's not a flagship price – that'll be reserved for Vega. The RX 480 is the start and the end of Polaris 10; there will not be a “Big Polaris” chip that comes out later. After the 480, it's the 470, 460, and then we wait for Vega with HBM2.
AMD has invested heavily into perf-per-watt with Polaris – and that's apparent in the charts. The RX 480 is a $240 card for 1440p gaming that trades blows with nVidia's GTX 970, which is also available in the $250 to $280 range these days. If you've already got a GTX 970, the RX 480 isn't an upgrade; but if you're considering buying a fire-sale 970 at a cheap price or the 480 at $240, then we'd push towards the RX 480. The AMD card has 8GB of VRAM, which is becoming increasingly important in modern games (a few years ago, we'd call this “marketing-driven,” but that is no longer the case).
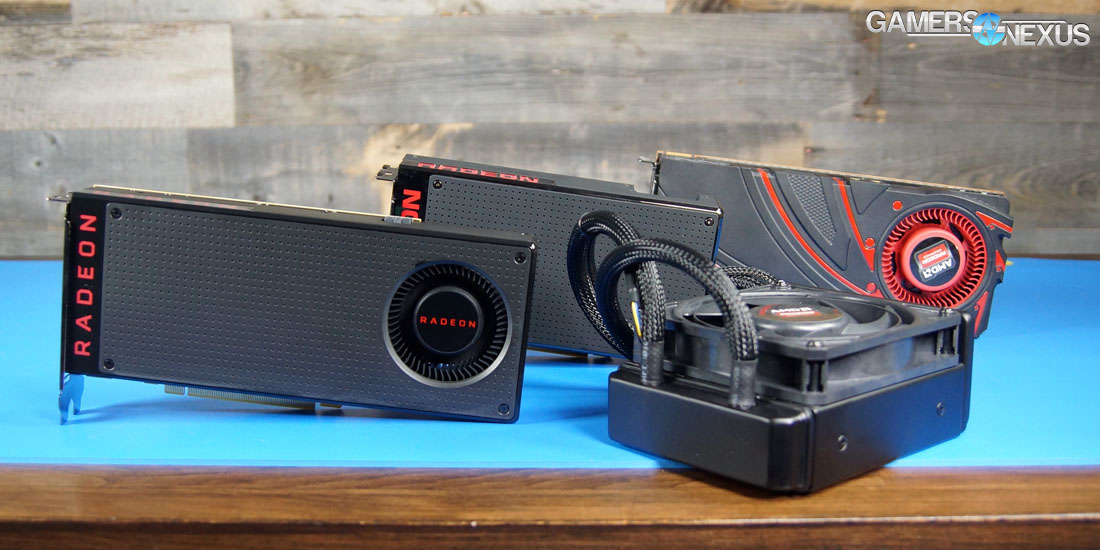
Above: The last three generations of AMD reference designs (front to back: RX 480, R9 Fury X, R9 270).
The card performs reasonably at 1440p for most games. You won't be playing 1440p at absolute max settings – that's not what this card does – but you'll be close. Generally, the 480 can push 1440p between High and Ultra settings, depending on game. Up until this year, it was not really possible to do 1440p gaming on $200 to $250 graphics cards – but the 970 price drops and RX 480 launch have made that a reality.
Performance shows gains of 20-35% over the R9 380X, some ties or close calls with the R9 390X, and mostly identical performance to the GTX 970 (though the 970 still has a better track record for 1% low and 0.1% low framerates. The RX 480 had some issues with GTA V stuttering, but those are known to AMD and under investigation. Failure to recover from driver crashes during OC attempts also drags-down an otherwise powerful software suite, but that's another issue we brought to AMD's attention – and was known. WattMan is a huge improvement over OverDrive. This is one utility that makes a strong argument for installing the Radeon Settings software (though navigation needs work).
Our OC landed us at 1340MHz core and 2200MHz memory (+74MHz offset from stock boost, +200MHz mem offset), with a maxed-out vCore of 1115mV. That overclock stuck, too, as shown in our endurance test. Here's a reproduced version of that chart (see P6 for full details):
Thermals aren't great with the reference cooler, and will prove to be a weak point of the RX 480. It's a similar story told by the Founders Edition cooler, and is the main reason to wait for AIB partner launches before making a decision.
Still, the RX 480 is not an exciting architecture. It's not a game-changing launch because products already exist at the price-point that accomplish similar objectives, but that's not to knock the 480: it's an improvement over existing, same-price products – just not one that amounts to tremendous fanfare. The RX 480 is a reasonable buy at $240. As of today – this instant – the 8GB RX 480 has become our recommendation for a sub-$300 video card.
Now, there's a big contingency tied to this recommendation: As we stated with the NVIDIA 1070 and 1080, we'd strongly recommend grabbing an AIB partner model with an aftermarket cooler instead. This chip is good, but the air cooler has some serious tradeoffs between thermals and noise. We show this extensively in our P3 – Thermal & Noise testing (and strongly recommend that you read that page, if you've skipped straight ot the conclusion). AIB partners will do a much better job of thermal/noise management, the question is whether or not those cards exceed the $240 price-point. As price grows beyond $240, the value proposition swiftly diminishes. The RX 480 does feel like it's priced precisely where it belongs – $200 to $240. We just need to see if those prices stick.
Regardless, we have some plans for the RX 480 yet. Be sure to subscribe to the YouTube channel (or follow) and check back here regularly for our forthcoming lab work.
If you enjoyed the depth of our content, please consider supporting our small team on Patreon. A big list of credits to follow:
Editorial, Test Lead: Steve “Lelldorianx” Burke
Video Producer: Andrew “ColossalCake” Coleman
Supporting Photo/Video: Keegan “HornetSting” Gallick
Sr. Test Technician: Mike “Budekai?” Gaglione
Noise Test Technician: Patrick “Mocalcium” Stone
FPS Test Technician: Andie “Draguelian” Burke