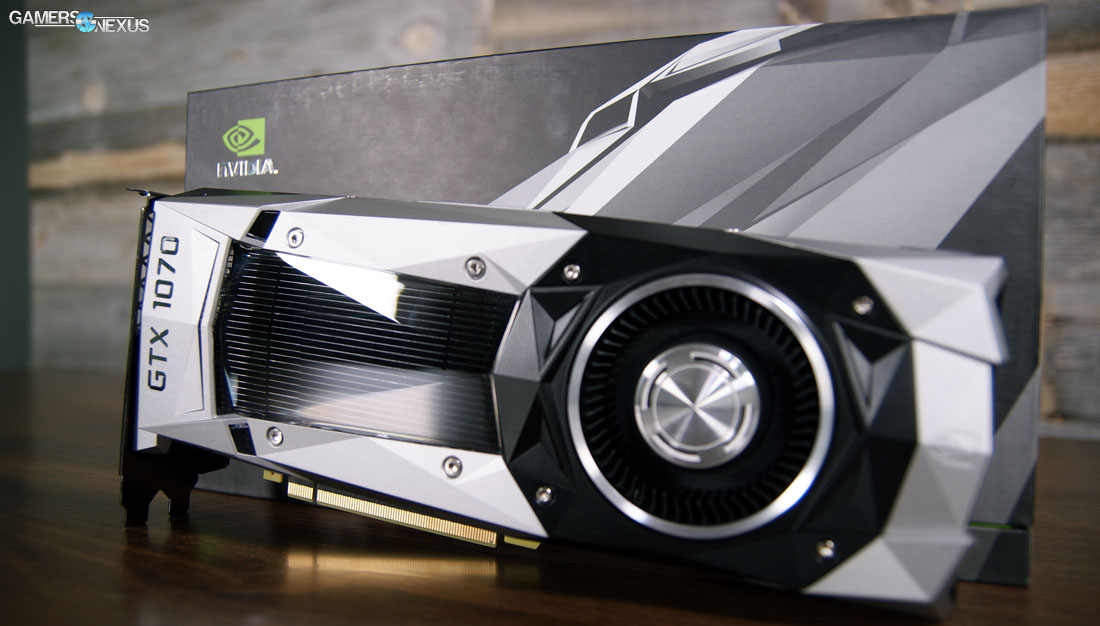
The GTX 1080's epochal launch all but overshadowed its cut-down counterpart – that is, until the price was unveiled. NVidia's GTX 1070 is promised at an initial $450 price-point for the Founders Edition (explained here), or an MSRP of $380 for board partner models. The GTX 1070 replaces nVidia's GTX 970 in the vertical, but promises superior performance to previous high-end models like the 980 and 980 Ti; we'll validate those claims in our testing below, following an initial architecture overview.
The GeForce GTX 1070 ($450) uses a Pascal GP104-200 chip. The architecture is identical to the GTX 1080 and its GP104-400 GPU, but cuts-down on SM presence (and core count) to create a mid-range version of the new 16nm FinFET architecture. This new node from TSMC is nearly half the size of Maxwell's 28nm Planar process, and switches the company over to FinFET transistor architecture for reduced power leakage and overall improved performance-per-watt efficiency. The trend is symptomatic of an industry trending toward ever-smaller devices with a greater concern on the power envelope, and has been reflected in nVidia's architectures since Fermi (GTX 400 series running notoriously hot) and AMD's since Fiji (sort of – Polaris claims to make a bigger push in this direction). On the CPU side, Intel has been driving this trend for several generations now, its 10nm process making promises to further extend mobile device endurance and transistor density.
Before getting started, here's a list of relevant Pascal & GTX 1080 articles we wrote:
GTX 1080 Founders Edition Review & In-Depth Benchmark (9000 words!)
Building Our Own GTX 1080 Hybrid – Tearing Apart the Founders Edition
Our review of the GTX 1070 Founders Edition graphics card will compare it vs. the GTX 1080, 980 Ti, 970 (and more) and AMD's R9 Fury X & R9 390X. We'll look at performance (FPS) benchmarks and our specialized thermal testing with endurance (clock-rate vs. time) burn-in. These tests explore major points of issue for new GPUs, and provide a closer look at real-world gaming performance. We're in Taipei, Taiwan right now for Computex, and so we've culled a few tests due to travel complications. Power draw did not make it into this review.
NVIDIA GeForce GTX 1070 vs. GTX 1080, 980 Ti, 970, & 390X [Video]
NVIDIA GeForce GTX 1070 Specs vs. 1080, 970, 980 Ti
| NVIDIA Pascal vs. Maxwell Specs Comparison | ||||||
| Tesla P100 | GTX 1080 | GTX 1070 | GTX 980 Ti | GTX 980 | GTX 970 | |
| GPU | GP100 Cut-Down Pascal | GP104-400 Pascal | GP104-200 Pascal | GM200 Maxwell | GM204 Maxwell | GM204 |
| Transistor Count | 15.3B | 7.2B | 7.2B | 8B | 5.2B | 5.2B |
| Fab Process | 16nm FinFET | 16nm FinFET | 16nm FinFET | 28nm | 28nm | 28nm |
| CUDA Cores | 3584 | 2560 | 1920 | 2816 | 2048 | 1664 |
| GPCs | 6 | 4 | 3 | 6 | 4 | 4 |
| SMs | 56 | 20 | 15 | 22 | 16 | 13 |
| TPCs | 28 TPCs | 20 TPCs | 15 | - | - | - |
| TMUs | 224 | 160 | 120 | 176 | 128 | 104 |
| ROPs | 96 (?) | 64 | 64 | 96 | 64 | 56 |
| Core Clock | 1328MHz | 1607MHz | 1506MHz | 1000MHz | 1126MHz | 1050MHz |
| Boost Clock | 1480MHz | 1733MHz | 1683MHz | 1075MHz | 1216MHz | 1178MHz |
| FP32 TFLOPs | 10.6TFLOPs | 9TFLOPs | 6.5TFLOPs | 5.63TFLOPs | 5TFLOPs | 3.9TFLOPs |
| Memory Type | HBM2 | GDDR5X | GDDR5 | GDDR5 | GDDR5 | GDDR5 |
| Memory Capacity | 16GB | 8GB | 8GB | 6GB | 4GB | 4GB |
| Memory Clock | ? | 10Gbps GDDR5X | 4006MHz | 7Gbps GDDR5 | 7Gbps GDDR5 | 7Gbps |
| Memory Interface | 4096-bit | 256-bit | 256-bit | 384-bit | 256-bit | 256-bit |
| Memory Bandwidth | ? | 320.32GB/s | 256GB/s | 336GB/s | 224GB/s | 224GB/s |
| TDP | 300W | 180W | 150W | 250W | 165W | 148W |
| Power Connectors | ? | 1x 8-pin | 1x 8-pin | 1x 8-pin 1x 6-pin | 2x 6-pin | 2x 6-pin |
| Release Date | 4Q16-1Q17 | 5/27/2016 | 6/10/2016 | 6/01/2015 | 9/18/2014 | 9/19/2014 |
| Release Price | TBD (Several thousand) | Reference: $700 MSRP: $600 | Reference: $450 MSRP: $380 | $650 | $550 | $330 |
Architecture Revisit – GP104-200 Simultaneous Multiprocessors, GPCs, TPCs
The GTX 1070 utilizes the same Pascal GP104 architecture as found on the GTX 1080, though the *-200 subversion (rather than *-400) does bring some changes. Those changes are mostly to core count and clock speed.
The silicon is the same, the architecture is mostly the same, but the die has been somewhat simplified on the GTX 1070 to reduce cost. The heart of the chip is still 16nm FinFET design, which operates at slightly lower voltage than planar process and exhibits less power leakage than planar. Datapath optimizations are also in-place for performance improvements, something we spent a few thousand words on in our 1080 review.
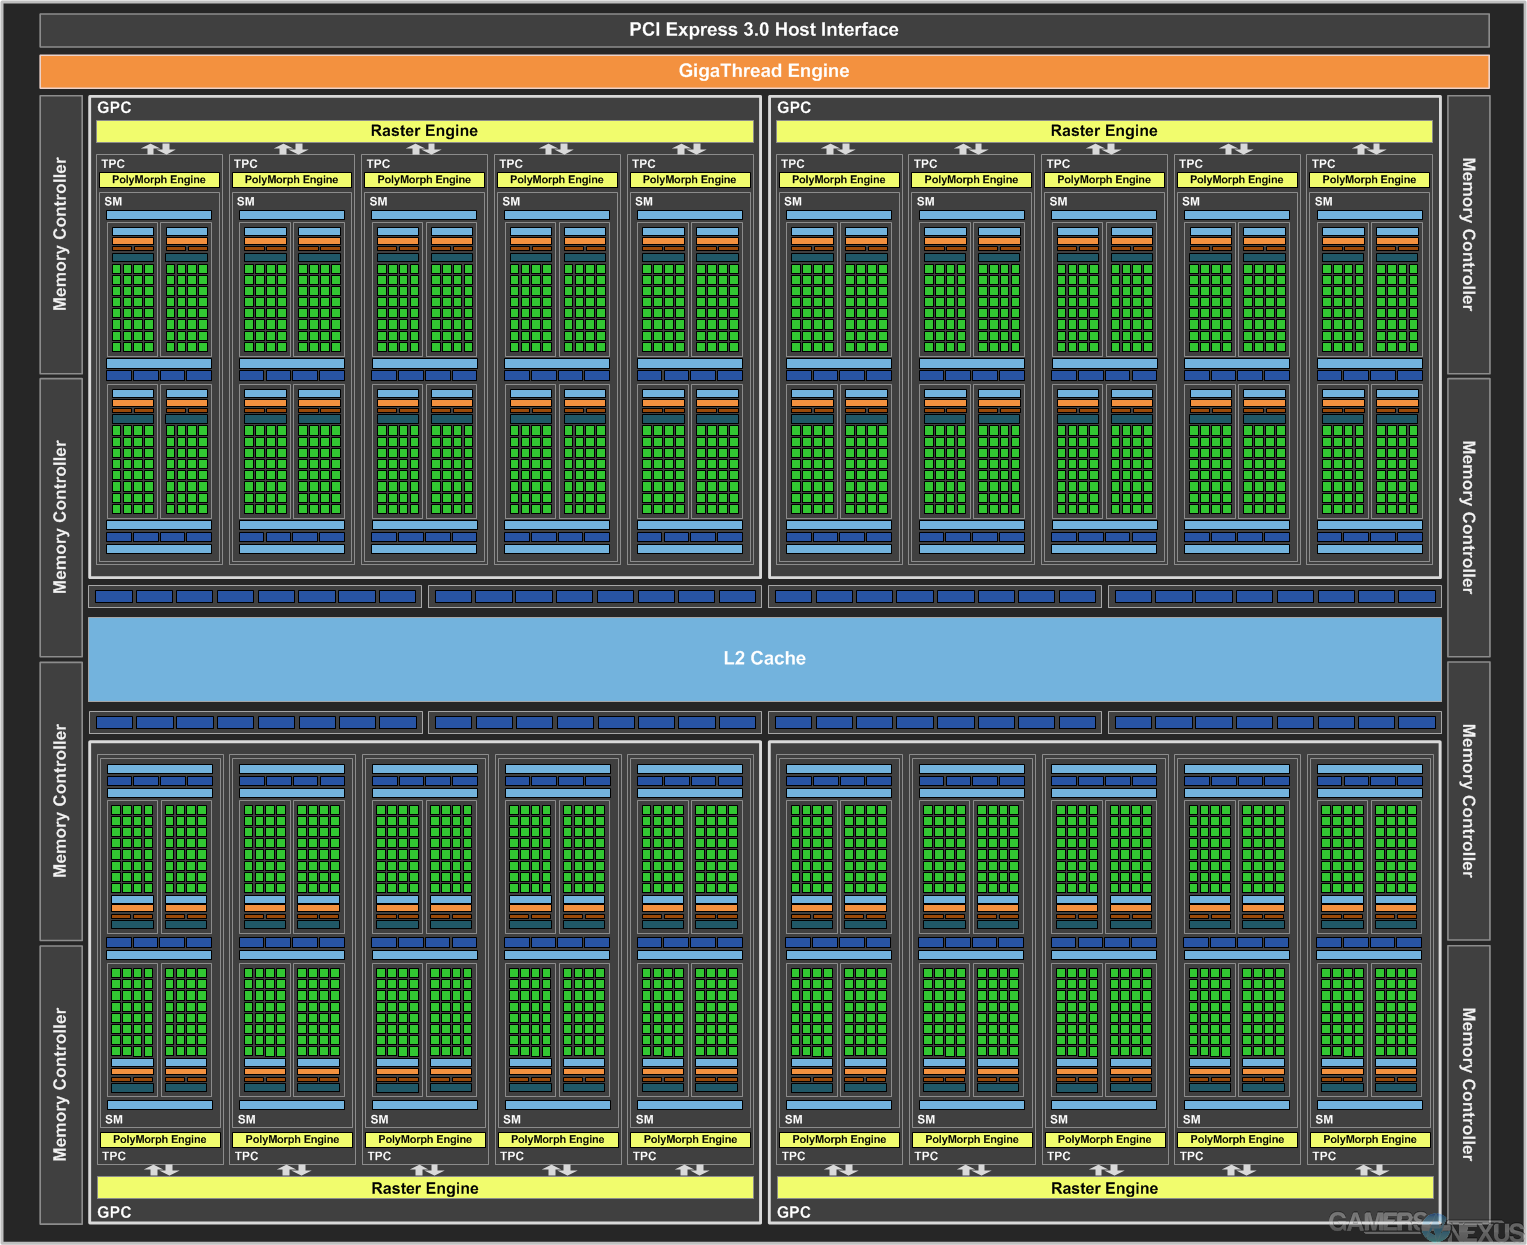
(Above: The GP104-400 block diagram. Remove one GPC -- that's basically GP104-200.)
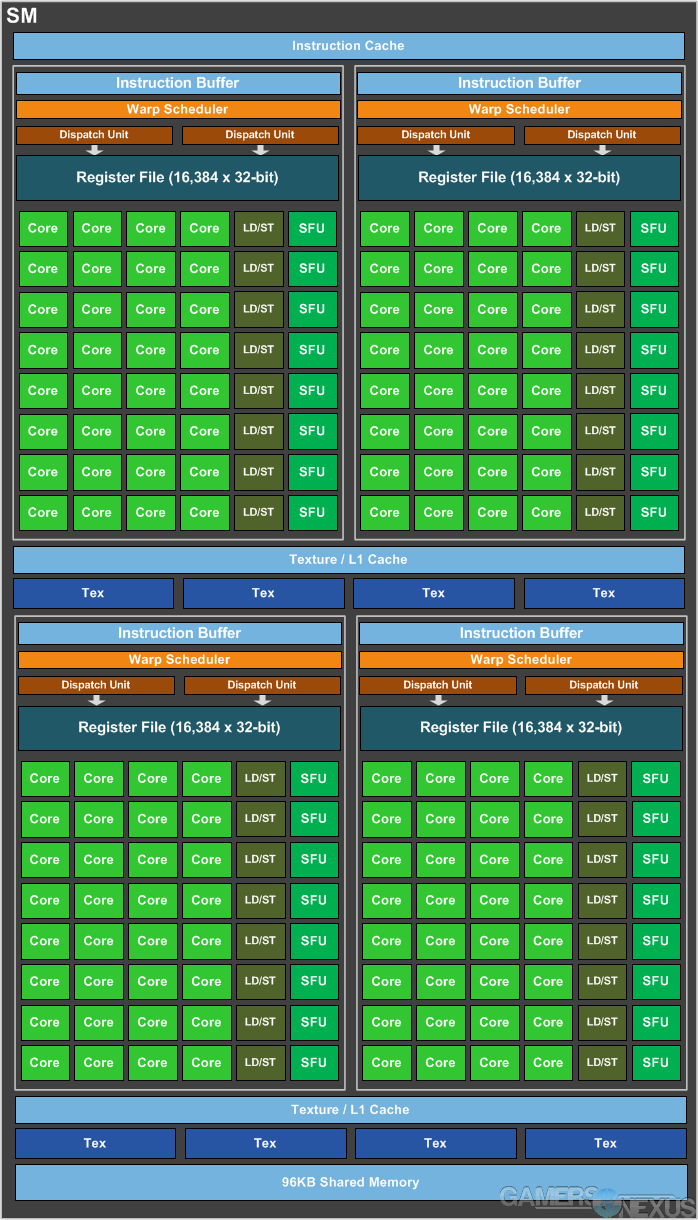
(Above: SM architecture on Pascal / GP104.)
NVidia's GTX 1070 runs 15 SMs rather than the 20 SMs of GP104-400, reducing core count to 1920 and TMUs to 120 (capable of 202GT/s). The clock boosts to 1683MHz, but has OC headroom that we play with later in this review.
Another major change from the 1080 is the GTX 1070's usage of GDDR5 8Gbps memory, rather than the new GDDR5X 10Gbps memory of the GTX 1080. This reduces cost of the card by mounting a more ubiquitous memory platform to the device.
To learn about asynchronous compute and memory subsystems on Pascal, check out our 9000-word review on the GTX 1080.

Game Test Methodology
We tested using our GPU test bench, detailed in the table below. Our thanks to supporting hardware vendors for supplying some of the test components.
The latest AMD drivers (16.15.2.1 Doom-ready) were used for testing. NVidia's unreleased press drivers were used for game (FPS) testing. Game settings were manually controlled for the DUT. All games were run at presets defined in their respective charts. We disable brand-supported technologies in games, like The Witcher 3's HairWorks and HBAO. All other game settings are defined in respective game benchmarks, which we publish separately from GPU reviews. Our test courses, in the event manual testing is executed, are also uploaded within that content. This allows others to replicate our results by studying our bench courses.
Windows 10-64 build 10586 was used for testing.
Each game was tested for 30 seconds in an identical scenario, then repeated three times for parity. Some games have multiple settings or APIs under test, leaving our test matrix to look something like this:
| Ashes | Talos | Tomb Raider | Division | GTA V | MLL | Mordor | BLOPS3 | Thermal | Power | Noise | |
| NVIDIA CARDS | |||||||||||
| GTX 1080 | 4K Crazy 4K High 1080 High Dx12 & Dx11 | 4K Ultra 1440p Ultra 1080p UltraVulkan & Dx11 | 4K VH 1440p VH 1080p VHDx12 & Dx11 | 4K High 1440p High 1080p High | 4K VHU 1080 VHU | 4K HH 1440p VHH 1080p VHH | 4K Ultra 1440p Ultra 1080p Ultra | 4K High 1440p High 1080p High | Yes | Yes | Yes |
| GTX 980 Ti | 4K Crazy 4K High 1080 High Dx12 & Dx11 | 4K Ultra 1440p Ultra 1080p UltraVulkan & Dx11 | 4K VH 1440p VH 1080p VHDx12 & Dx11 | 4K High 1440p High 1080p High | 4K VHU 1080 VHU | 4K HH 1440p VHH 1080p VHH | 4K Ultra 1440p Ultra 1080p Ultra | 4K High 1440p High 1080p High | Yes | Yes | Yes |
| GTX 980 | 4K Crazy 4K High 1080 High Dx12 & Dx11 | 4K Ultra 1440p Ultra 1080p UltraVulkan & Dx11 | 4K VH 1440p VH 1080p VHDx12 & Dx11 | 4K High 1440p High 1080p High | 4K VHU 1080 VHU | 4K HH 1440p VHH 1080p VHH | 4K Ultra 1440p Ultra 1080p Ultra | 4K High 1440p High 1080p High | Yes | Yes | Yes |
| AMD CARDS | |||||||||||
| AMD R9 390X | 4K Crazy 4K High 1080 High Dx12 & Dx11 | 4K Ultra 1440p Ultra 1080p UltraVulkan & Dx11 | 4K VH 1440p VH 1080p VHDx12 & Dx11 | 4K High 1440p High 1080p High | 4K VHU 1080 VHU | 4K HH 1440p VHH 1080p VHH | 4K Ultra 1440p Ultra 1080p Ultra | 4K High 1440p High 1080p High | Yes | Yes | No |
| AMD Fury X | 4K Crazy 4K High 1080 High Dx12 & Dx11 | 4K Ultra 1440p Ultra 1080p UltraVulkan & Dx11 | 4K VH 1440p VH 1080p VHDx12 & Dx11 | 4K High 1440p High 1080p High | 4K VHU 1080 VHU | 4K HH 1440p VHH 1080p VHH | 4K Ultra 1440p Ultra 1080p Ultra | 4K High 1440p High 1080p High | Yes | Yes | Yes |
Average FPS, 1% low, and 0.1% low times are measured. We do not measure maximum or minimum FPS results as we consider these numbers to be pure outliers. Instead, we take an average of the lowest 1% of results (1% low) to show real-world, noticeable dips; we then take an average of the lowest 0.1% of results for severe spikes.
| GN Test Bench 2015 | Name | Courtesy Of | Cost |
| Video Card | This is what we're testing! | - | - |
| CPU | Intel i7-5930K CPU | iBUYPOWER | $580 |
| Memory | Corsair Dominator 32GB 3200MHz | Corsair | $210 |
| Motherboard | EVGA X99 Classified | GamersNexus | $365 |
| Power Supply | NZXT 1200W HALE90 V2 | NZXT | $300 |
| SSD | HyperX Savage SSD | Kingston Tech. | $130 |
| Case | Top Deck Tech Station | GamersNexus | $250 |
| CPU Cooler | NZXT Kraken X41 CLC | NZXT | $110 |
For Dx12 and Vulkan API testing, we use built-in benchmark tools and rely upon log generation for our metrics. That data is reported at the engine level.
Video Cards Tested
- NVIDIA GTX 1080 Founders Edition ($700)
- NVIDIA GTX 980 Ti Reference ($650)
- NVIDIA GTX 980 Reference ($460)
- NVIDIA GTX 980 2x SLI Reference ($920)
- AMD R9 Fury X 4GB HBM ($630)
- AMD MSI R9 390X 8GB ($460)
Thermal Test Methodology
We strongly believe that our thermal testing methodology is the best on this side of the tech-media industry. We've validated our testing methodology with thermal chambers and have proven near-perfect accuracy of results.
Conducting thermal tests requires careful measurement of temperatures in the surrounding environment. We control for ambient by constantly measuring temperatures with K-Type thermocouples and infrared readers. We then produce charts using a Delta T(emperature) over Ambient value. This value subtracts the thermo-logged ambient value from the measured diode temperatures, producing a delta report of thermals. AIDA64 is used for logging thermals of silicon components, including the GPU diode. We additionally log core utilization and frequencies to ensure all components are firing as expected. Voltage levels are measured in addition to fan speeds, frequencies, and thermals. GPU-Z is deployed for redundancy and validation against AIDA64.
All open bench fans are configured to their maximum speed and connected straight to the PSU. This ensures minimal variance when testing, as automatically controlled fan speeds will reduce reliability of benchmarking. The CPU fan is set to use a custom fan curve that was devised in-house after a series of testing. We use a custom-built open air bench that mounts the CPU radiator out of the way of the airflow channels influencing the GPU, so the CPU heat is dumped where it will have no measurable impact on GPU temperatures.
We use an AMPROBE multi-diode thermocouple reader to log ambient actively. This ambient measurement is used to monitor fluctuations and is subtracted from absolute GPU diode readings to produce a delta value. For these tests, we configured the thermocouple reader's logging interval to 1s, matching the logging interval of GPU-Z and AIDA64. Data is calculated using a custom, in-house spreadsheet and software solution.
Endurance tests are conducted for new architectures or devices of particular interest, like the GTX 1080, R9 Fury X, or GTX 980 Ti Hybrid from EVGA. These endurance tests report temperature versus frequency (sometimes versus FPS), providing a look at how cards interact in real-world gaming scenarios over extended periods of time. Because benchmarks do not inherently burn-in a card for a reasonable play period, we use this test method as a net to isolate and discover issues of thermal throttling or frequency tolerance to temperature.
Our test starts with a two-minute idle period to gauge non-gaming performance. A script automatically triggers the beginning of a GPU-intensive benchmark running MSI Kombustor – Titan Lakes for 1080s. Because we use an in-house script, we are able to perfectly execute and align our tests between passes.
GTX 1070 Thermal Benchmark – Founders Edition / Reference Temperatures
Thermal benchmarking is our “thing.” It's what we most enjoy doing, and have spent the most time refining. For the GTX 1070, we sent the card through the usual “thermals over time” and peak-load analysis. Here's what we've got for the averaged peak load temperatures:
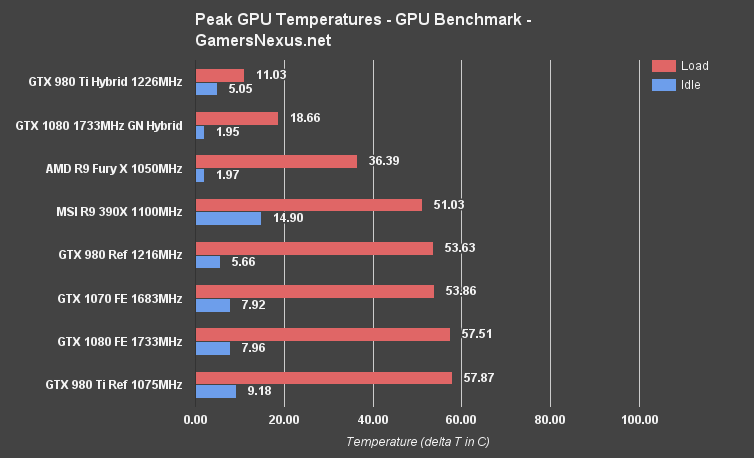
As shown, the GTX 1070 Founders Edition – equipped with the nVidia stock cooler – performs about equally to the GTX 980 reference with regard to thermals. The GTX 1070 sits at ~53.86C (delta tempearture over ambient); that's a fair bit cooler than the GTX 1080 FE, operating at 57.51C. Our custom-made version of the GTX 1080, the GN Hybrid, had an operating temperature of around 18.66C delta T, just for reference. AMD's liquid-cooled R9 Fury X runs at ~36.39C (with an impressively low idle temperature), but uses more expansive cooling than the “hybrid” solution – the Fury X has no VRM blower fan, and instead uses liquid to cool all of its components. This is in contrast to the “hybrid” solutions, which use a VRM blower fan and only liquid-cool the GPU proper.
The GTX 1070 is about 6.55% cooler than the GTX 1080.
GTX 1070 Thermals Over Time
Here's an over-time presentation of the data. The results from the above peak average load chart are pulled from the stabilized portion of this chart (what we sometimes call “equilibrium”). The data and test passes are the same, just stretched over time rather than displayed in easy-to-read bars.
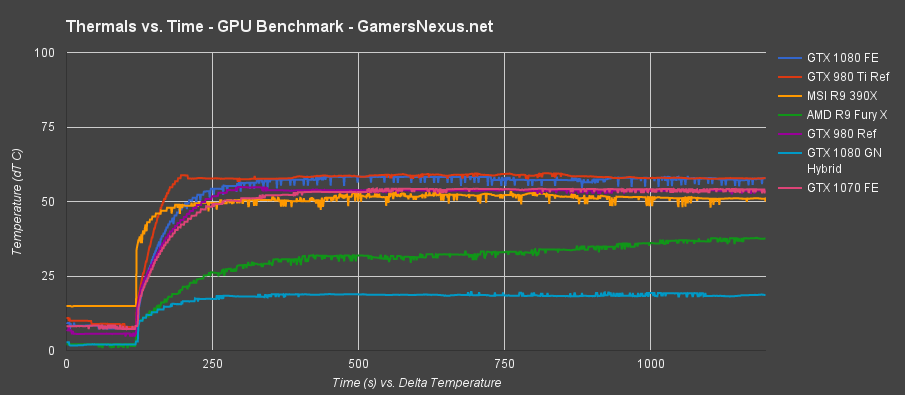
All cards begin heating at the same time, following a 120-second idle period. Our in-house test automation ensures that these lines align correctly.
The GTX 1080 and GTX 1070 follow a similar ramp curve. The GTX 1070, in pink, keeps a consistent temperature with few dips or raises, unlike some other cards on the bench.
The thermal performance for nVidia's “Founders Edition” cooler is reasonable. As we said with the GTX 1080, it's about what you'd expect from a “reference card” – or one made by the GPU supplier. AIB partner cards, like those from MSI, EVGA, Gigabyte, and others, will push lower temperatures as a result of more refined cooling solutions. It is sometimes the case that these devices cost more – like the EVGA Hybrid cards or Gigabyte Waterforce cards – but they often ship for about the same (or slightly lower) price as the reference design.
NVidia's GTX 1070 doesn't excite us from a thermal control standpoint. It does what it should – keeps the card at a reasonable temperature and with a VRM fan noise level just under 50dB (though not shown in this review, because of time issues from brushing up against the Taipei/Computex trip). The FE sets a benchmark for the AIB partner cards, for which we're most interested in performing thermal benchmarks.
GTX 1070 Thermals versus Frequency (And Thermal Throttling)
This endurance test was conducted over a (shorter than normally, due to constraints) 1-hour test period. We use real-world games to analyze performance and look for points of throttle during execution, usually coinciding with temperature spikes. This time, we used Metro: Last Light at 2560x1440 with Very High quality and High tessellation. This torture tests the card.
Temperature is represented as an absolute value, unlike our previous charts; it is not a delta value. This is to more clearly illustrate the point of clock throttling, should one exist.
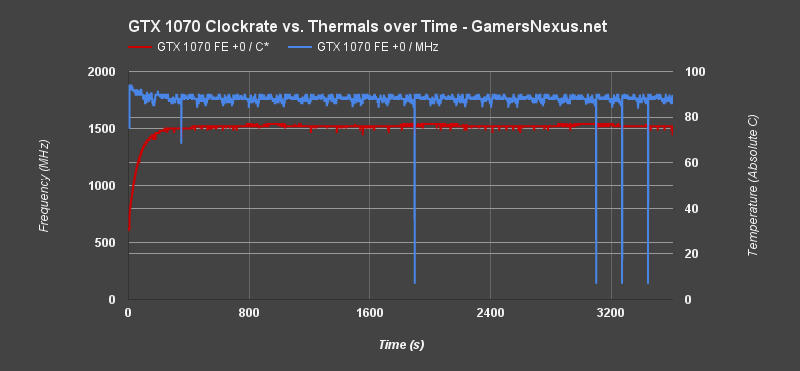
Of the hour-long period, four major dips occurred on the GTX 1070. The card fell down to the low hundreds for its frequency, but quickly shot back up. Regardless, these instances will create frametime latency spikes and can cause a user-observable “lag spike” in gameplay for a brief time. Four for an hour isn't bad, but this would be resolved by an AIB cooler. Each spike coincides with temperature jumps. Here is the excerpted data from the most noteworthy dip:
| Time (s) | Clock | Temp |
| 3268 | 1721 | 76 |
| 3269 | 1721 | 76 |
| 3270 | 1721 | 76 |
| 3271 | 1746.5 | 76 |
| 3272 | 1759 | 76 |
| 3273 | 1746.5 | 77 |
| 3274 | 139 | 73 |
| 3275 | 1759 | 74 |
| 3276 | 1797 | 76 |
| 3277 | 1771.5 | 76 |
Catch it? The clock only dips down for one second, but it's enough to recover an additional 4C from the GPU. That hard slam to 139MHz creates an observable “lag spike” in gameplay for less than one second of time. Whenever the GPU hits 77C, we observed this throttle.
More-or-less a non-issue, but most AIB coolers should not be hitting the same high temperatures. We'll see when they're out, though.
GTX 1080 Thermals versus Frequency (And Thermal Throttling)
Just for a look at our previous testing, here's the GTX 1080 excerpt:
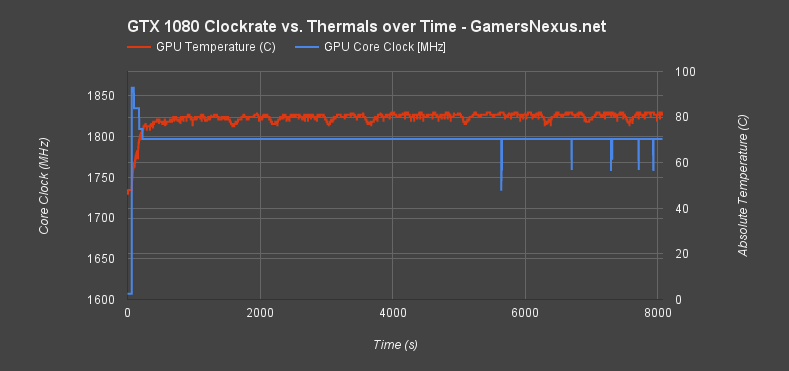
The frequency is fairly stable here, but shows dips in frequency which grow in consistency as the test continues. Let's zoom in on that data; the scale is a little wide to properly see what's going on. Here's a blown-up version of those spikes, truncating the data from ~5500s to ~7500s:
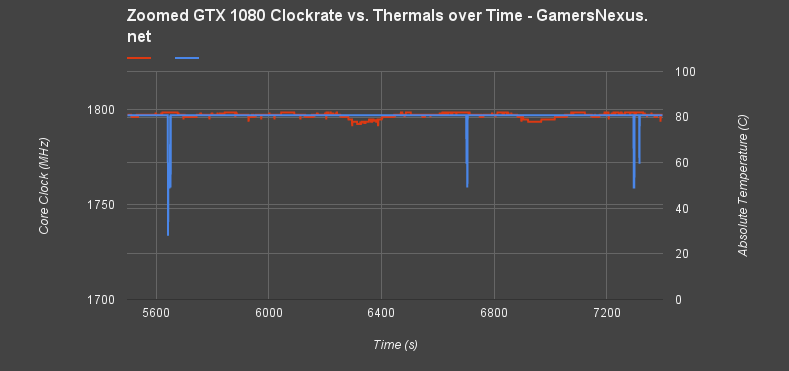
Frequency fluctuations show a range of approximately ~60MHz each time the GPU diode hits ~82C absolute. This can trigger a slight latency increase or framerate fluctuation at the exact moment of frequency fluctuation, but is basically imperceptible.
Here's a look at the most exaggerated spike:
| Time (s) | Core MHz | Abs. T. (C) |
| 5636 | 1797 | 82 |
| 5637 | 1797 | 82 |
| 5638 | 1797 | 82 |
| 5639 | 1797 | 82 |
| 5640 | 1797 | 82 |
| 5641 | 1797 | 82 |
| 5642 | 1733.5 | 82 |
| 5643 | 1759 | 82 |
| 5644 | 1771.5 | 82 |
| 5645 | 1759 | 82 |
| 5646 | 1759 | 82 |
| 5647 | 1759 | 82 |
| 5648 | 1771.5 | 82 |
| 5649 | 1771.5 | 82 |
| 5650 | 1797 | 82 |
A few hits later, the temperature falls pursuant to this frequency throttle (which is the point of the momentarily throttle):
| Time (s) | Core MHz | Abs. T. (C) |
| 5677 | 1797 | 81 |
| 5678 | 1797 | 81 |
| 5679 | 1797 | 82 |
| 5680 | 1797 | 81 |
| 5681 | 1797 | 81 |
| 5682 | 1797 | 81 |
| 5683 | 1797 | 81 |
| 5684 | 1797 | 81 |
| 5685 | 1797 | 81 |
| 5686 | 1797 | 81 |
| 5687 | 1797 | 81 |
| 5688 | 1797 | 81 |
| 5689 | 1797 | 81 |
| 5690 | 1797 | 81 |
| 5691 | 1797 | 81 |
| 5692 | 1797 | 81 |
| 5693 | 1797 | 81 |
| 5694 | 1797 | 81 |
| 5695 | 1797 | 81 |
| 5696 | 1797 | 81 |
| 5697 | 1797 | 79 |
With the frequency restored and the game continuing to crunch numbers and graphics, temperatures eventually return to 82C and drop again.
Read the GTX 1080 review, Page 3 for more information on this. For still more information on thermal and clock throttle points in the GTX 1080, view our GTX 1080 Hybrid experiment.
NVIDIA GTX 1070 FPS Benchmarks – Dx12 & Vulkan (& OpenGL) vs. Dx11
This page initiates our game benchmarking for the GTX 1070. We do not include any Dx11-only games on this page, but we do provide comparative data between Dx11, Dx12, and Vulkan (where present) for tested games. Some of this data is presented as a percent change value or other unique values, like ms latency. These charts provide insight as to async compute performance and overall acceptance of new APIs by the hardware.
OpenGL is also included through DOOM, freshly-launched.
OpenGL DOOM – GTX 1070 vs. GTX 970, Fury X, 390X, & 1080
DOOM is one of the few games where the GTX 1070 performs slower than the GTX 980 Ti in raw frame throughput. The two cards trade blows depending on game, and the 1070 often matches evenly or outmatches the GTX 980 Ti. Still, in specific resolution/settings scenarios or specific games – like DOOM – the GTX 980 Ti does retain its lead over the 1070.
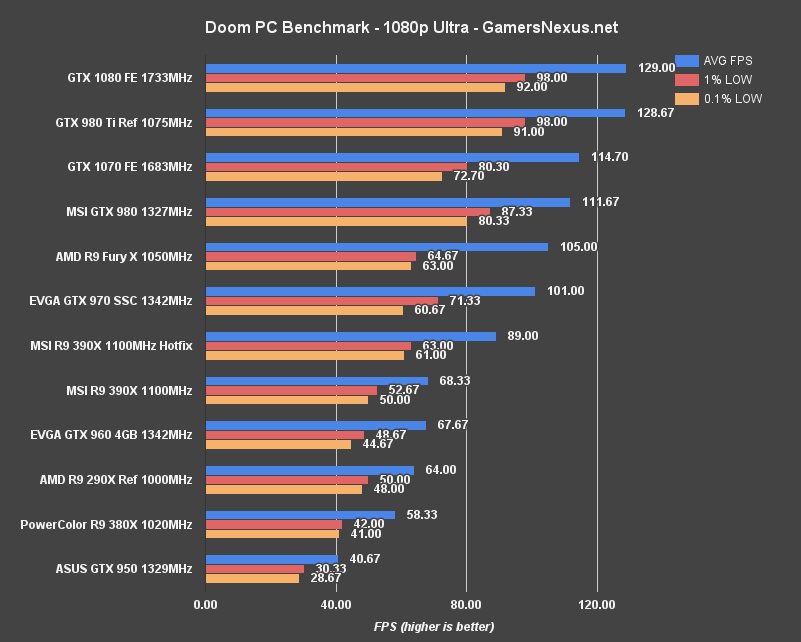
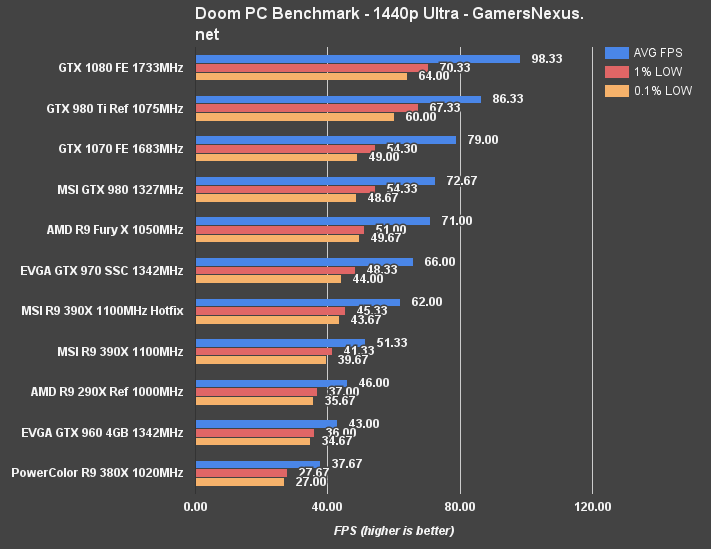

The GTX 980 Ti runs about 11.5% faster than the GTX 1070 in raw frame throughput, tallied at 1080p. At this same “low” resolution, the GTX 1080 ties with the 980 Ti only because we've hit a CPU bottleneck. The 1070 sits below the CPU throttle point, hitting nearly 115FPS average and with tightly timed 1% and 0.1% low frame metrics (80.3 & 72.7, respectively).
Against AMD's current high-end, single-GPU card, the GTX 1070 outperforms the R9 Fury X by 8.8% (114.7FPS on 1070 vs. 105.0FPS AVG on Fury X). Against the GTX 970, nVidia's successor 1070 pushes an additional 12.7% frames.
Note that the DOOM charts include two test metrics for the R9 390X, just to illustrate how much a driver update can do. The R9 390X received an important update after DOOM's initial launch, increasing the framerate upwards of 25% in some cases. Read more on that here.
Comparative Dx12 vs. Dx11 FPS in Ashes of Singularity – GTX 1070 vs. 1080, 970 Fury X
Ashes of the Singularity offers some of the most reliable and accurate testing data out of all our Dx12 API games. Ashes easily reproduces comparable metrics and provides data down to the number of batches being pushed through the pipe.

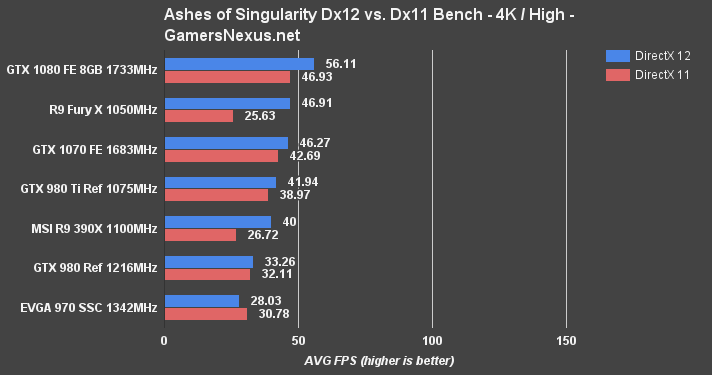
The above data is collected from the “Satellite Shot 2” part of the Ashes of Singularity benchmark. This part of the benchmark shoves batches down the pipe and chokes the GPU, and is therefore representative of a worst-case scenario for the cards tested.
NVidia's GeForce GTX 1070 Founders Edition lands in a firm second-place on the 1080p chart, with a ~10FPS disparity between the brand new, $700 GTX 1080 and the new device (14.27%). The GTX 970 runs approximately 35.17% slower (AVG FPS) than the GTX 1070, in DirectX 12 'mode.'
AMD's R9 Fury X pushes significantly lower framerates with DirectX 11, something we analyzed in this text from the GTX 1080 review:
“AMD's Fury X and R9 390X are still the most impressive when it comes to gains, though. These two cards are choking on some sort of Dx11 optimization issue – something that nVidia's good at, when it comes to circumventing bottlenecks with drivers – and are limited by Dx11 in the Satellite Shot 2 heavy benchmark. With Dx12, the cards can unleash their full potential and nearly double framerates – but they're still behind the GTX 1080.
In contrast to this, the GTX 980 Maxwell card ranked high among Dx11 performers, but falls to the bottom of the chart for Dx12.”
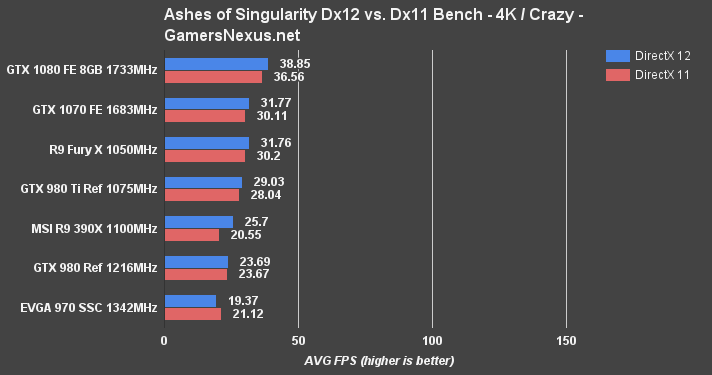
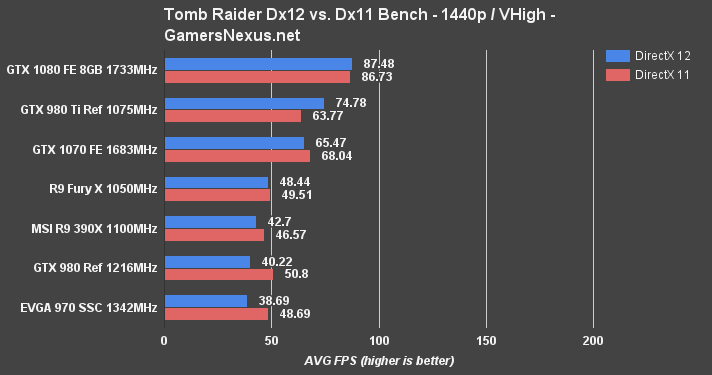
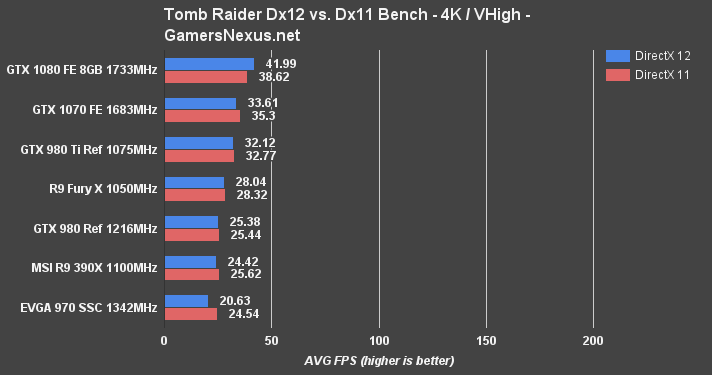
The Fury X eliminates the GTX 1070's lead once resolution is increased (likely a result of its large shader array) and manages to rank effectively identically to the GTX 1070. Performance at the point of 4K resolution tests falls more-or-less within margin of error.
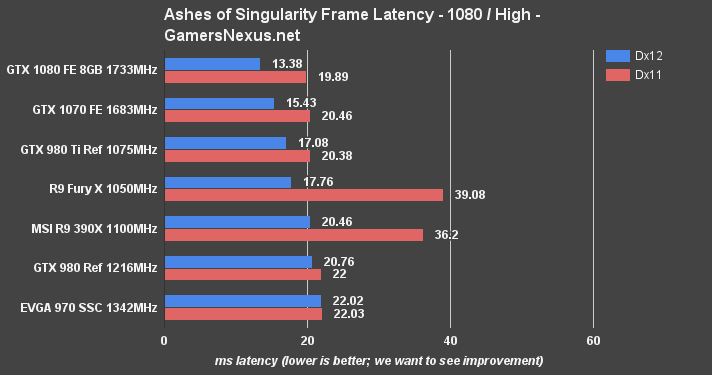
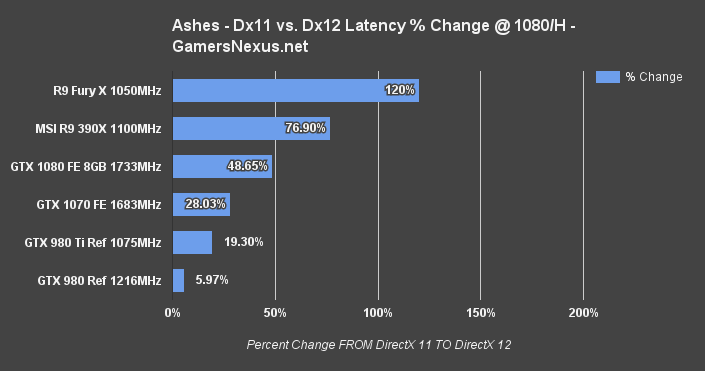
Here's a look strictly at the frametimes (latency between frames) for the Dx12 tests. What you're looking at is a comparative chart between Dx12 and Dx11, with the percentage gain displayed as a means to convey how architectures impact asynchronous computational performance.
NVidia does well with DirectX 11 performance – somewhere AMD can struggle with the Ashes Satellite Shot 2 benchmark – so it follows that the nVidia frametime reduction between DirectX 11 and DirectX 12 isn't quite as impressive looking as what's found on AMD hardware. The GTX 1080 saw significant gains over the Maxwell generation architecture with regard to Dx12 performance improvement, a jump of ~50% (against the GTX 980's ~6%). This gap between Maxwell and Pascal architecture is largely precipitated by compute preemption and other algorithmic improvements to asynchronous compute.
The GTX 1070 also benefits from the architectural changes, but not in a manner nearly as impressive as the GTX 1080. For the 1070, Dx12 frametime improvements measure at about 28.3% over Dx11 frametimes.
Comparative Vulkan vs. Dx11 in Talos Principle – GTX 1070 vs. 390X, 1080, 970
The Talos Principle is still the only game with a fully implemented Vulkan benchmark suite, but will (hopefully) soon be joined by id Software's DOOM. For now, though, the only way to get solid Vulkan gaming performance metrics is to run The Talos Principle.
Talos developers CroTeam have indicated that there is a known and expected performance disparity between Dx11 and Vulkan right now, where their game is still outperforming with Dx11. There should eventually be a switch-over point.
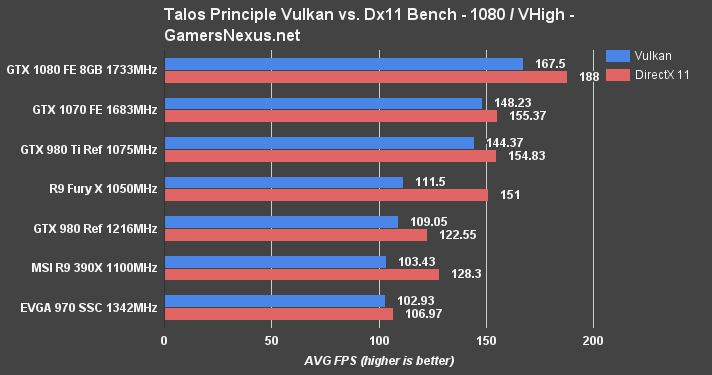
At 1080p, the GTX 1070 FE takes second place in our charts and manages to hit 148.23 FPS with Vulkan and 155.37FPS with Dx 11 (delta: 4.7%). Looking strictly at Vulkan performance stats at 1080p, ranked with the GTX 1070 at a baseline of 100%, here are the performance deltas between flanking cards:
GTX 1080 FE Stock: 112.2%
GTX 1070 FE Stock: 100%
GTX 980 Ti Ref Stock: 97.4%
AMD Radeon R9 Fury X: 71.72%
GTX 970 SSC: 63.93%
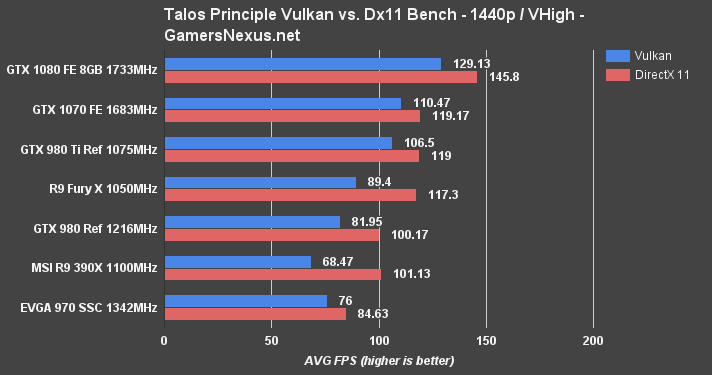
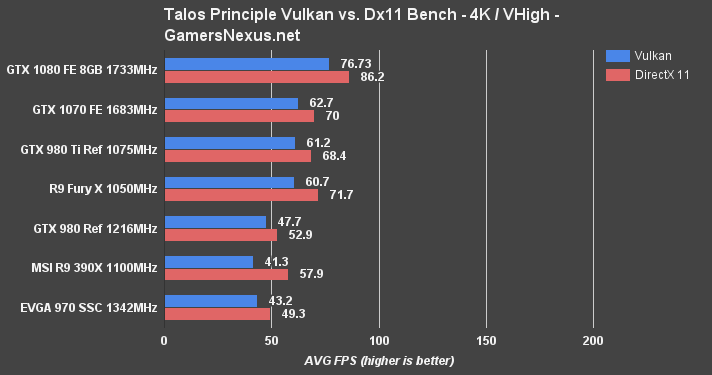
The Talos Principle is one of the games where tiered ranking of cards stays fairly consistent across resolutions. At 1440p, GTX 1070 performance still stands above the 60FPS mark – well above it, in fact, with ~110FPS on Vulkan and ~119FPS on Dx11 – and even manages to hold marginally above 60FPS performance at 4K.
Comparative Gains in Tomb Raider – Dx11 vs. Dx12 Performance on GTX 1070
Rise of the Tomb Raider is another of the split Dx11/Dx12 titles, offering both APIs for benchmarking and play. Still, the implementation is a little strange, and seems at times unstable or inefficient in its Dx12 execution.
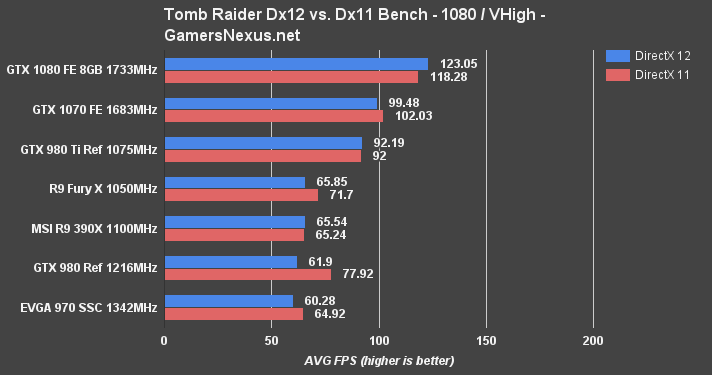
At 1080p, the GTX 1070 runs at nearly 100FPS with Dx12 and marginally exceeds 100FPS with Dx11 – more-or-less identical once considering general variance of RotTR. The GTX 1080 FE outperforms the GTX 1070 by approximately 21.18%, with the GTX 1070 then outperforming its predecessor by nearly 40 FPS (49%).
The Division Benchmark – GTX 1070 vs. 980 Ti, Fury X at 4K, 1440, & 1080
The Division has a built-in benchmark that varies in scene complexity throughout the test. Like with all Dx11 and OpenGL tests, we discard all data gathered by the official tool and instead use our own FPS logging tools (monitoring present). We use the first 30 seconds of the Division benchmark. Note that there's one instance after our test concludes where the camera flies through dense smoke and fire; in these few frames, framerate dips heavily as a result of the particle effects. We do not measure this part of the game. In that regard, if you make it a habit to wander through smoke, your framerates would take hits from what's presented below (but only when wandering through that smoke).
As we've gotten away from the Dx12 benchmarking, we can now look at 1% low and 0.1% low framerates. This gives a better idea of frametime pacing.


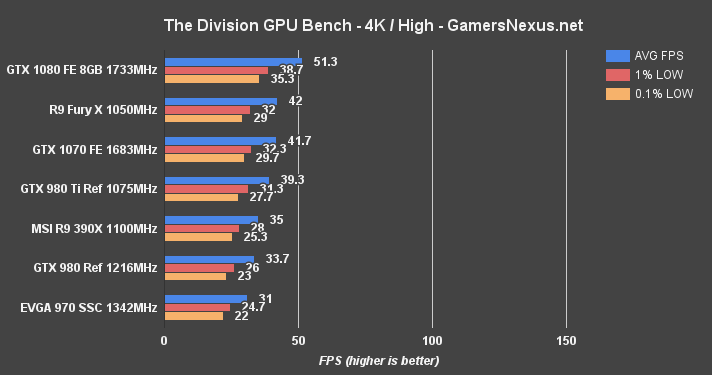
At 1440p – because 1080p appears to be an easy win for the GTX 1070 – the new card is outpaced by the Fury X marginally (though the Fury X loses at 1080p). The difference is insignificant, and the same is true for the 1% lows and 0.1% lows (where the GTX 1070 beats the Fury X – again, insignificantly). Against the GTX 1080, the GTX 1070 FE runs 18.4% 'below' in its tiering. The GTX 980 Ti is about 1FPS different from the GTX 1070 in average framerates. NVidia's GTX 970 sits at 55.7FPS, or 23.7% slower than the GTX 1070 at 1440p.
The GTX 1070 can't hit the same high framerates at 4K as the GTX 1080, but would be able to sustain 4K gameplay if settings were reduced closer to medium and low. These charts make it clear that the 1070 isn't the same high-end, 4K performer as the GTX 1080 – but it's still doing well, considering the price.
Black Ops 3 Benchmark – GTX 1070 vs. 980 Ti, 970, 390X at 4K, 1440, & 1080
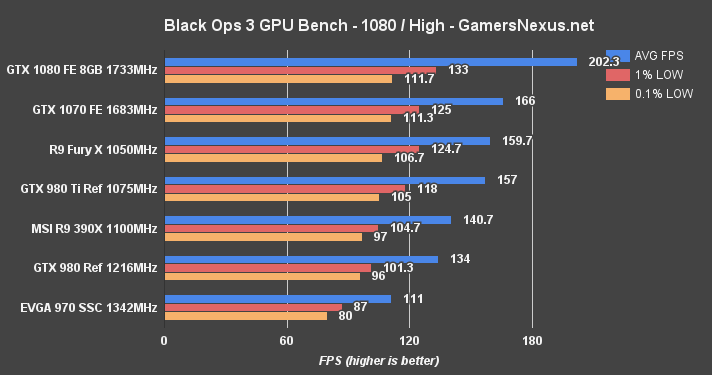
Although it runs about 19.7% slower than the GTX 1080 – which sustains 200+ FPS average at 1080p (useful for 144Hz or 200Hz competitive gamers) – the GTX 1070 still has equally tightly timed 1% and 0.1% lows. The 1070 outpaces the Fury X, a high performer with Call of Duty titles, and again outpaces the 980 Ti by ~5.6%.
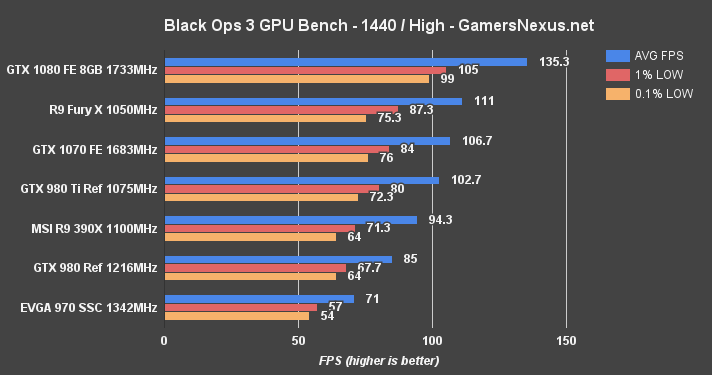
At 1440p, the GTX 1070 remains well above “playable” targets with its 106.7 FPS, though is marginally outpaced by the Fury X (3.95%). The GTX 980 Ti remains just below the GTX 1070 (3.82%). With some settings tweaks, the GTX 1070 would be able to sustain 120 FPS AVG at 1440p. Settings would not need to be massively reduced, either, as we learned here.
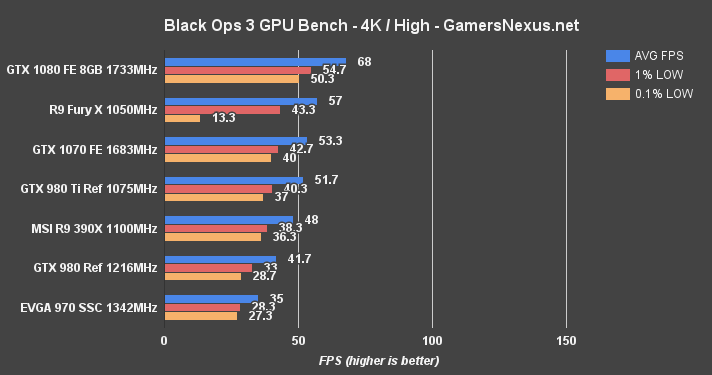
4K shows the tremendous strain of the Fury X's 4GB VRAM. The Fiji GPU manages to sustain nearly 60FPS average, but gets hit hard in 0.1% lows with its 13.3 FPS throughput. In this regard, the GTX 1070 FE is a better card for 4K with these bigger VRAM calls; the 1070 runs 6.7% slower in its averages, but 100.19% faster in its 0.1% low frames. Where the Fury X noticeably drops frames and introduces judder, the GTX 1070 runs OK. That said, neither is really perfect for 4K with BLOPS3. It'd make more sense to dip to 1440p (or drop settings).
GTA V Benchmark – GTX 1070 vs. 980 Ti, Fury X, 980 at 4K & 1080
GTA V remains one of the most intensive games on the bench, straining even the GTX 1080 when running a 4K resolution with Very High / Ultra settings.

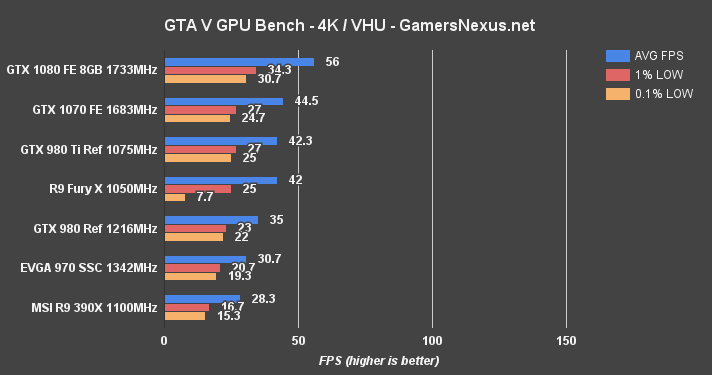
Short of a settings drop, the GTX 1070 (and GTX 980 Ti, for that matter – and especially the Fury X) are not particularly playable at 4K. The GTX 1070 sustains a 44.5FPS average, but dips below 30FPS for its lowest framerates. Moving to 1080p, the GTX 1070 FE holds fast at 120.3FPS, and keeps tightly timed 1% (85) and 0.1% (74.3) FPS lows – nearly matching the GTX 1080. The GTX 1070 steps past the 980 Ti's 106.7 FPS AVG by 11.98%.
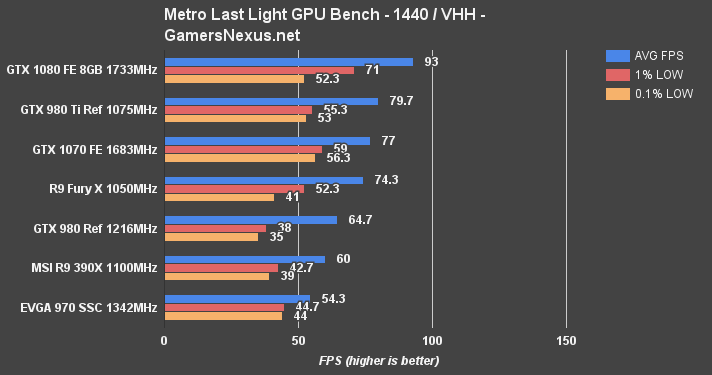
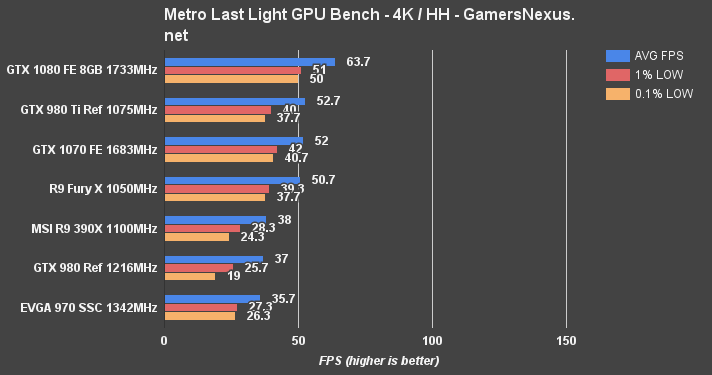
Metro: Last Light Benchmark – GTX 1070 vs. 980 Ti, Fury X at 4K, 1440, & 1080
Metro: Last Light remains the most repeatable and accurate game on our benchmark, despite its age.
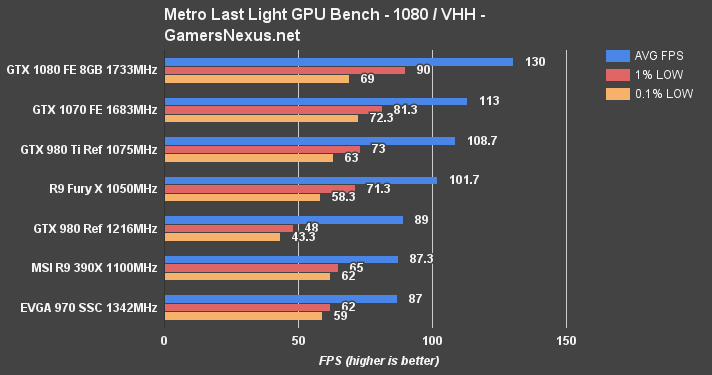
The GTX 1070 – again – outperforms demands at 1080p, pushing 113FPS AVG and sustaining reasonably high lows (though with a larger gap than in some other games, there is no user-perceptible frame dropping or judder). The GTX 970 is ~26% slower than the GTX 1070 FE.
At 1440p, the 980 Ti and GTX 1070 swap places (as seems to happen with these two cards and higher resolutions). The GTX 1080 dominates 1440p at 93FPS, the 980 Ti stands at 79.7FPS AVG, and the GTX 1070 FE pushes 77FPS average – a delta of 3.45% against the 980 Ti. The GTX 970 falls below 60FPS at these settings (Very high / High tessellation), a gap of 34.58% from the 1070 FE.
With a reduction in settings to high/medium, the GTX 1070 – like the 980 Ti and Fury X before it – would be able to hit ~60FPS AVG at 4K.
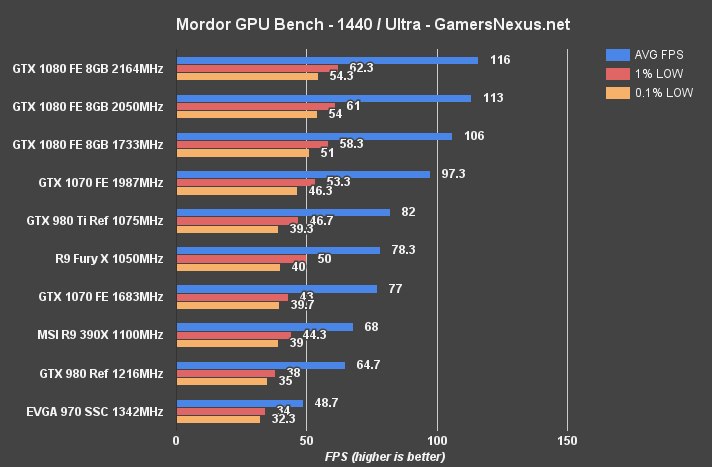
Shadow of Mordor Benchmark – GTX 1070 vs. 980 Ti, Fury X at 4K, 1440, & 1080
Shadow of Mordor, again, really has no issues at 1080p with the GTX 1070 – so we'll spend most our time discussing 1440p performance.

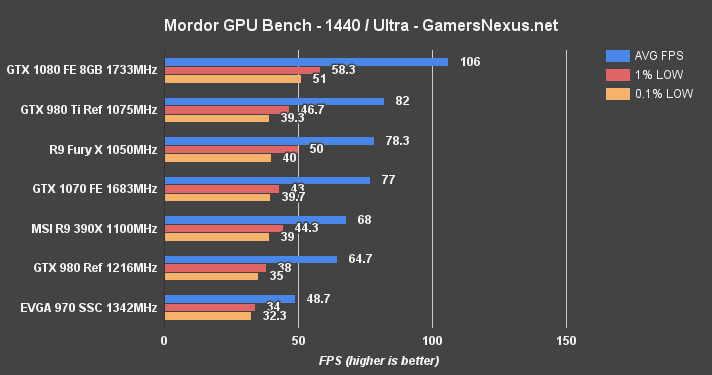

The GTX 1070 holds a strong second place (-17% from GTX 1080; +8.3% from 980 Ti) at 1080p, though gets switched around as resolution increases – a trend. 1440p establishes a massive lead on the ~$700 GTX 1080 – though at these framerates, it really becomes somewhat irrelevant until stepping into 4K – and pushes the 980 Ti & Fury X beyond the 1070. The GTX 1070 still sits at 77FPS, fully playable, and marks itself as an easily defined improvement over the GTX 970 (48.7FPS, or 45% different).
The GTX 1070 falls further down the rung at 4K, barely hitting 40FPS.
Continue to the next page for overclocking – it's worth a read.
How to Overclock the GTX 1070, Pascal GP104, & GTX 1080
Overclocking has changed with Pascal. It's gotten more advanced – but not more complex. The core functions of overclocking remain the same; we're still using manual stepping and sliders to achieve high, sustained overclocks, but a new auto OC tool (currently only with EVGA Precision) makes limit finding easier. In theory, anyway. We couldn't get it to work with our GTX 1080, but it seems that EVGA Precision's auto-OC (called “ScanOC”) is now functioning with the latest press drivers and installation package.
But we decided to keep going the manual route – it's just better for testing.
From our GTX 1080 review:
“GTX 1080 overclocking is revised heavily from previous generations. The GTX 1080 and GP104 move nVidia from GPU Boost 2.0 to GPU Boost 3.0. GPU Boost 3.0 and supporting applications from AIB partners will allow for frequency-voltage curve creation that fine-tunes voltages against various frequencies. Rather than functioning on a single slider for frequency, applications like Precision and Afterburner will now create a curve that fits your card's particular silicon.
Anyone who's overclocked knows that a high frequency may be sustainable in most games or for long stretches of time, but that some specific applications or use cases will crash the drivers resultant of the overclock. The obvious solution is to step-down the OC globally until something is stable across the board, but then we're losing OC room in the use cases that didn't originally trigger faults.
GPU Boost 3.0 supports scanners, which figure out the optimal frequency for each individual voltage point. If a particular voltage point is less stable, the frequency offset can be adjusted by the tool or by manual control. In EVGA Precision, a ScanOC tool finds the optimal setup and provides a baseline that allows enthusiasts to further tune their setup. Vendors can determine parameters for voltage-frequency curve determination by the OC scanner.”
GTX 1070 Overclocking Results
Here are the stepped results for our manual overclocking efforts with the GTX 1070:
| core clock | core offset | mem clock | mem offset | voltage | voltage offset | power target | 5m test | Endurance |
| 1771 | 0 | 4006 | 0 | 950mv | 0% | 100% | P | - |
| 1936 | 150 | 4151 | 300 | 1000mv | 30% | 112% (max) | P | - |
| 1974 | 200 | 4353 | 350 | 1000 | 30 | 112 | P | - |
| x | 250 | x | 400 | 1000 | 30 | 112 | F | - |
| 1974 | 200 | 4374 | 375 | 1000 | 30 | 112 | P | - |
| x | 250 | x | 375 | x | 30 | 112 | F | - |
| 2015 | 225 | 4374 | 375 | 1000 | 30 | 112 | F | - |
| 1974 | 200 | 4374 | 375 | 1000 | 30 | 112 | P | - |
| 1974 | 200 | 4404 | 400 | 1000 | 30 | 112 | P | - |
| 1974 | 200 | 4455 | 450 | 1000 | 30 | 112 | P | - |
| 1987 | 215 | 4498 | 500 | 1000 | 30 | 112 | P | - |
| 1987 | 215 | 4551 | 550 | 1000 | 30 | 112 | P | - |
| 1987 | 220 | 4551 | 550 | 1000 | 30 | 112 | F | - |
| 1987 | 215 | 4608 | 600 | 1000 | 30 | 112 | P | P |
| 1987 | 215 | 4704 | 700 | 1000 | 30 | 112 | artifacts | - |
We actually had trouble forcing the GTX 1070 to fail with our initial overclocks. Our ultimate clock-rate landed us at 1987MHz core, 4608MHz memory (GDDR5). Voltage never exceeded 1000mV, even if we went beyond a 30% voltage offset (VBIOS restriction for safety, as usual with all cards). Power percent target capped at 112% on our GPU. The final results operated under a 215MHz core offset and 600MHz memory offset.
GTX 1080 Overclocking Results
For reference, here are our GTX 1080 overclocking results:
| Core Clock (MHz) | Core Offset (MHz) | Mem CLK (MHz) | Mem Offset (MHz) | Power Target (%) | 5m Test | 60m Burn-in |
| 1733 | 0 | 5005 | 0 | 100 | Pass | Pass |
| 1880 | 150 | 5305 | 300 | 120 | Pass | - |
| 1974 | 171 | 5305 | 300 | 120 | Pass | - |
| 1987 | 190 | 5305 | 300 | 120 | Pass | - |
| 2025 | 210 | 5305 | 300 | 120 | Pass | - |
| 2050 | 230 | 5305 | 300 | 120 | Fail Driver Crash | |
| ~2030 | 220 | 5400 | 400 | 120 | Pass | Pass |
GTX 1080 Overclocking Results with GN DIY Hybrid Solution
| Core Clock (MHz) | Core Offset (MHz) | Mem CLK (MHz) | Mem Offset (MHz) | Power Target (%) | 5m Test | 60m Burn-in |
| ~2050-2072 | 225 | 5005 | 0 | 120 | Pass | - |
| ~2100-2138 | 250 | 5005 | 0 | 120 | Pass | - |
| 2164 | 275 | 5005 | 0 | 120 | Pass | - |
| 2164 | 275 | 5602 | 600 | 120 | Pass | Pass |
| 2189 | 300 | 5602 | 600 | 120 | Fail | - |
| 2189 | 300 | 4489 | -500 | 120 | Pass | Pass (But struggled – so would probably fail with longer burn-in; failed immediately when gaming / not synthetic load) |
| 2202 | 325 | 4489 | -500 | 120 | Pass | Fail |
| 2164 | 275 | 5602 | 600 | 120 | Pass | Pass |
GTX 1070 Overclocked FPS vs. Founders Edition, GTX 1080, etc.
And a look at FPS impact:

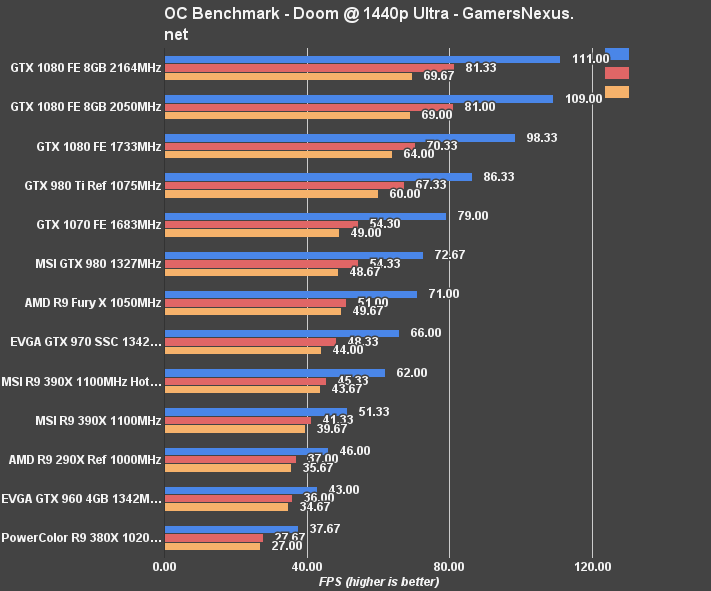
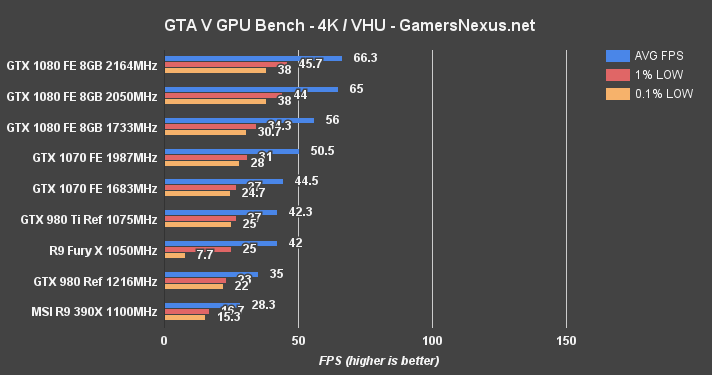
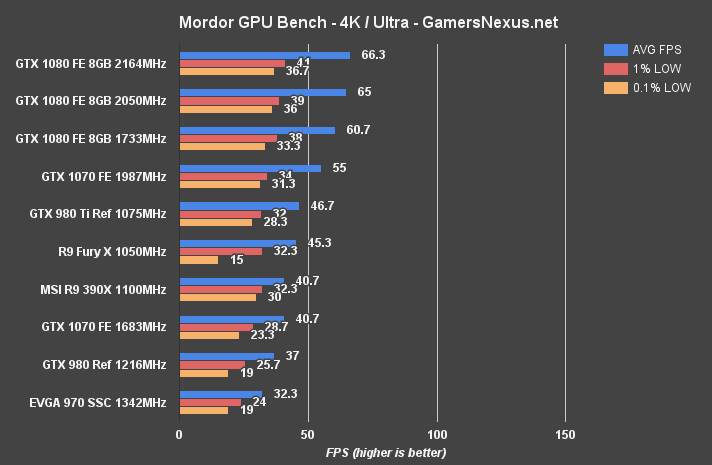
At 4K in GTA V, our GTX 1070 experiences a 12.6% performance hike in average FPS (GTX 1080 FE saw a 14.88% gain). Mordor at 4K benefits from a 29.9% performance gain – the game is fairly clock-intensive, and the GTX 1070 doesn't seem to be hitting the memory bottlenecks that we found on the 1080. At 1440p, Mordor gains ~23.3% over the stock clock. DOOM at 1080p shows a move into 120Hz range with our overclock, pushing 125.7 FPS against the 114.7FPS stock (+9.2%). At 1440p, that gain is 21.8%, with noteworthy gains in 1% and 0.1% low framerates.
Some games extracting an additional >20% from an overclock – especially with the stock cooler and PCB – is a tremendous boost to performance and a positive indication for the 1070's future. AIB partners will undoubtedly ship pre-overclocked versions, and user overclocking headroom is tremendous – and with real gains. We don't seem to be hitting some of the same concerns as with the GTX 1080, likely due to the slightly cooler nature of the chip.
Continue to the last page for the conclusion.
GTX 1070 Founders Edition Conclusion
NVidia's GTX 1070 Founders Edition card is an exceptionally strong overclocker, especially considering the limitations we encountered on the GTX 1080. This extra headroom is primarily resultant of a cooler chip overall, thanks to simplification of the die, but is also just because the clock runs lower stock.
The GTX 1070 trades spots with the reference 980 Ti in many instances, and would still hold a lead over AIB cards in a few cases. The gap between the 1070 and 1080 ranges 10% to 20% across the board. Against the previous gen GTX 970, gains are enough to push the GTX 1070 into an emergent class of card ready for ultra settings at 1440p, and can handle some games at 4K – though not nearly as well as the GTX 1080.

If you're running something like a GTX 970 and up, or R9 390X and up, on a 1080p display, there's really not much need to upgrade to the GTX 1070. The GTX 1070 primarily shines in multi-generational jaunts or with a move to higher resolutions. Where the 1080 establishes itself as the king of 4K gaming, the 1070 establishes itself in a similarly dominant position for 1440p gaming.
Now, as for the Founders Edition, we're taking the same stance we took with the GTX 1080: Buy an AIB card. They'll be way cooler – not that the 1070 is particularly hot, but it's got room for improvement – and will certainly fill-in the cheaper end of the market. $450 is the hidden cost of this card. Although MSRP allows cards to enter the market below $400, the Founders Edition will remain at $450 – and we think it makes more sense to buy the more effectively cooled AIB models instead.
As a GPU, though, GP104-200 is powerful and moves the bar for 1440p.
A big thanks to Mike Gaglione, Andie Burke, Keegan Gallick, and Andrew Coleman for pulling this content together while we've been traveling for Computex.
If you like what we do, please consider supporting us on Patreon.
Editorial, Test Lead: Steve “Lelldorianx” Burke
Sr. Test Technician: Mike “Budekai” Gaglione
Test Technician: Andie “Draguelian” Burke
Video Production: Keegan “HornetSting” Gallick
Photography: Andrew “ColossalCake” Coleman