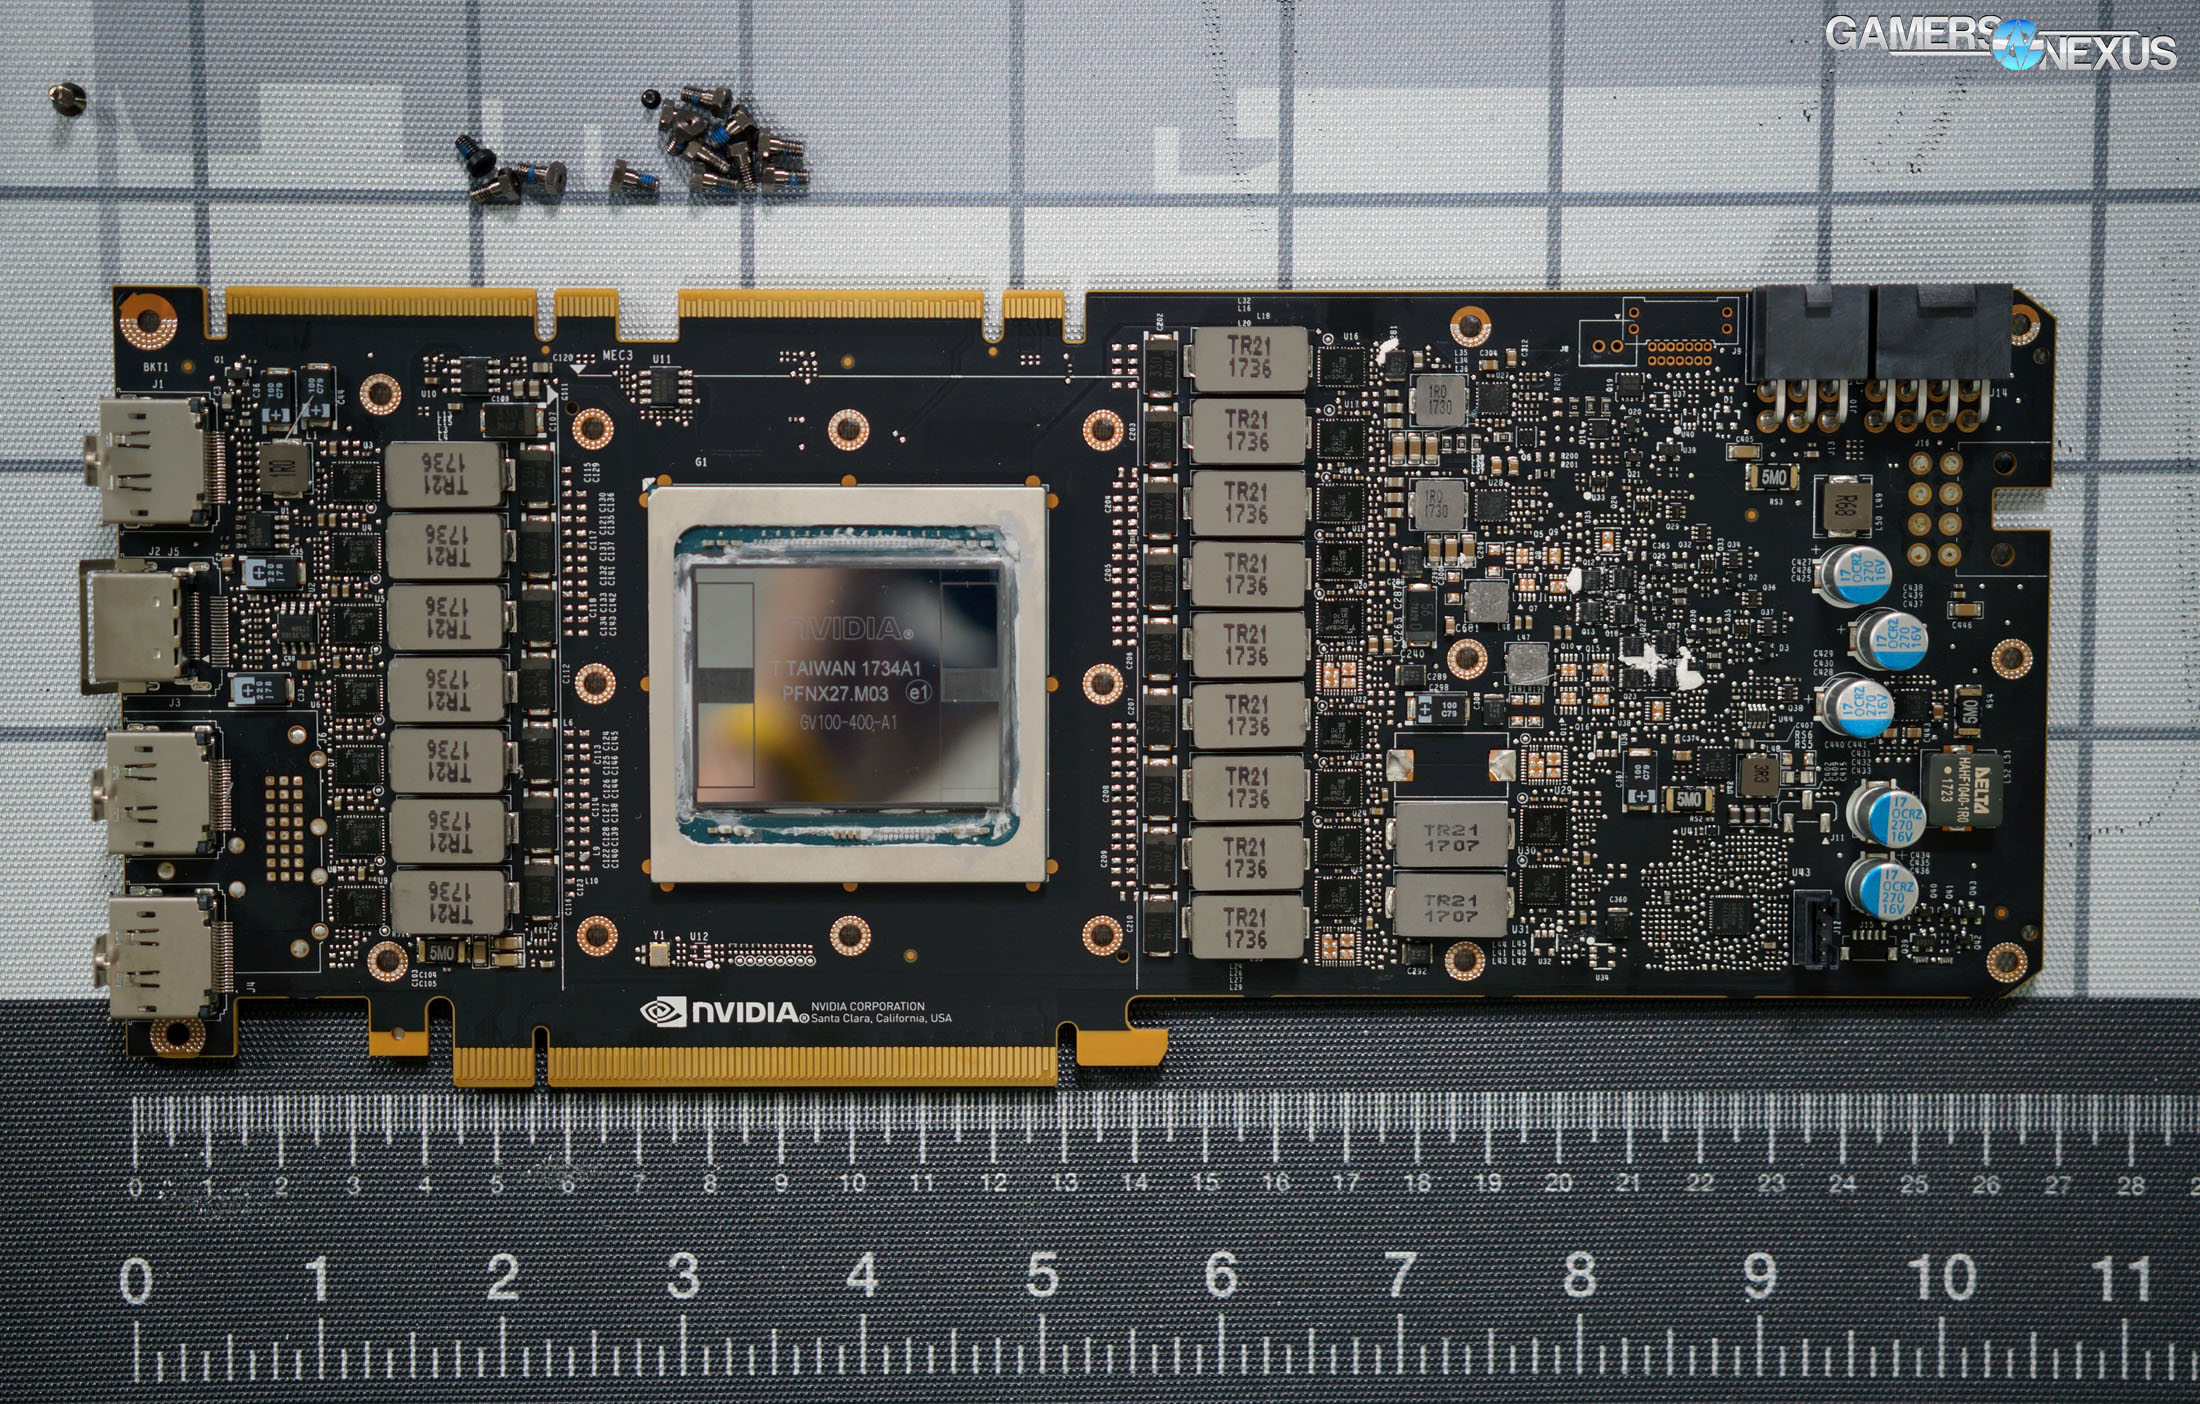
As we work toward our inevitable hybrid mod on the nVidia Titan V, we must visit the usual spread of in-depth thermal, power, and clock behavior testing. The card uses a slightly modified Titan Xp cooler, with primary modifications found in the vapor chamber’s switch to copper heatfins. That’s the primary change, and not one that’s necessarily all that meaningful. Still, the card needs whatever it can get, and short of a complete cooler rework, this is about the most that can fit on the current design.
In this Titan V benchmark, we’ll be looking at the card’s power consumption during various heavy workloads, thermal behavior of the MOSFETs and GPU core, and how frequency scales with thermals and power. The frequency scaling is the most important: We’ve previously found that high-end nVidia cards leave noteworthy performance (>100MHz boost) on the table with their stock coolers, and suspect the same to remain true on this high-wattage GPU.
Our previous Titan V content includes gaming benchmarks and a tear-down, if those interest you.
Thermal Testing Methodology
For thermal testing, we’re using GPU-z for core clock monitoring, we’re ignoring HBM (no sensors internally read to software, and using a tcouple would impact performance), and we’re using K-Types on the middle-right MOSFET and middle-left MOSFET. Our tests apply self-adhesive, 1/100th-inch thick (read: laser thin, does not cause "air gaps") K-type thermocouples directly to the PCB and to hotspot MOSFETs numbered 6 (right) and 4 (left) when counting from the bottom-up. The thermocouples used are flat and are self-adhesive (from Omega), as recommended by thermal engineers in the industry.
K-type thermocouples have a known range of approximately 2.2C. We calibrated our thermocouples by providing them an "ice bath," then providing them a boiling water bath. This provided us the information required to understand and adjust results appropriately.
Because we have concerns pertaining to thermal conductivity and impact of the thermocouple pad in its placement area, we selected the pads discussed above for uninterrupted performance of the cooler by the test equipment. Electrical conductivity is also a concern, as you don't want bare wire to cause an electrical short on the PCB. Fortunately, these thermocouples are not electrically conductive along the wire or placement pad, with the wire using a PTFE coating with a 30 AWG (~0.0100"⌀). The thermocouples are 914mm long and connect into our dual logging thermocouple readers, which then take second by second measurements of temperature. We also log ambient, and apply an ambient modifier where necessary to adjust test passes so that they are fair.
The response time of our thermocouples is 0.15s, with an accompanying resolution of 0.1C. The laminates arae fiberglass-reinforced polymer layers, with junction insulation comprised of polyimide and fiberglass. The thermocouples are rated for just under 200C, which is enough for any VRM testing (and if we go over that, something will probably blow, anyway).
To avoid EMI, we mostly guess-and-check placement of the thermocouples. EMI is caused by power plane PCBs and inductors. We were able to avoid electromagnetic interference by routing the thermocouple wiring right, toward the less populated half of the board, and then down. The cables exit the board near the PCI-e slot and avoid crossing inductors. This resulted in no observable/measurable EMI with regard to temperature readings.
The primary test platform is detailed below:
Thermal Bench
| GN Test Bench 2015 | Name | Courtesy Of | Cost |
| Video Card | This is what we're testing | - | - |
| CPU | Intel i7-5930K CPU 3.8GHz | iBUYPOWER | $580 |
| Memory | Corsair Dominator 32GB 3200MHz | Corsair | $210 |
| Motherboard | EVGA X99 Classified | GamersNexus | $365 |
| Power Supply | NZXT 1200W HALE90 V2 | NZXT | $300 |
| SSD | OCZ ARC100 Crucial 1TB | Kingston Tech. | $130 |
| Case | Top Deck Tech Station | GamersNexus | $250 |
| CPU Cooler | Asetek 570LC | Asetek | - |
Note also that we swap test benches for the GPU thermal testing, using instead our "red" bench with three case fans -- only one is connected (directed at CPU area) -- and an elevated standoff for the 120mm fat radiator cooler from Asetek (for the CPU) with Gentle Typhoon fan at max RPM. This is elevated out of airflow pathways for the GPU, and is irrelevant to testing -- but we're detailing it for our own notes in the future.
Game Bench
| GN Test Bench 2017 | Name | Courtesy Of | Cost |
| Video Card | This is what we're testing | - | - |
| CPU | Intel i7-7700K 4.5GHz locked | GamersNexus | $330 |
| Memory | GSkill Trident Z 3200MHz C14 | Gskill | - |
| Motherboard | Gigabyte Aorus Gaming 7 Z270X | Gigabyte | $240 |
| Power Supply | NZXT 1200W HALE90 V2 | NZXT | $300 |
| SSD | Plextor M7V Crucial 1TB | GamersNexus | - |
| Case | Top Deck Tech Station | GamersNexus | $250 |
| CPU Cooler | Asetek 570LC | Asetek | - |
BIOS settings include C-states completely disabled with the CPU locked to 4.5GHz at 1.32 vCore. Memory is at XMP1.
The above game bench is used for Firestrike scoring and all frequency monitoring during the clock vs. thermal testing, whereas the thermal bench is used for comparative thermal analysis between GPUs.
NVidia Titan V Clock vs. Thermals
Prior to diving into thermals, we can start by looking at baseline performance with auto settings, then our overclock, and then we’ll look at where thermal limitations are being encountered.
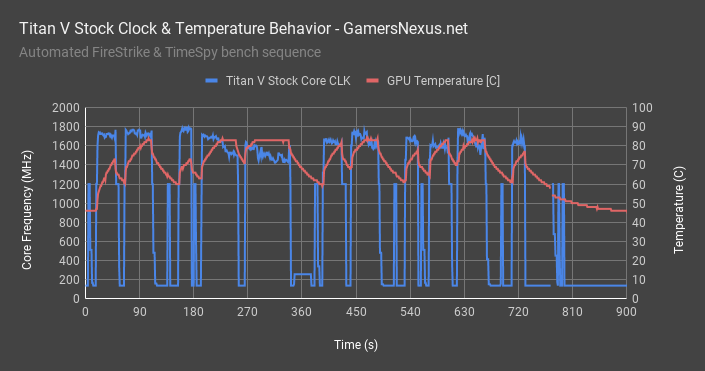
This chart shows frequency over time during an automated run of FireStrike Ultra, Extreme, and Normal, followed by Timespy. At stock, auto settings, the Titan V is operating a peak clock of about 1770MHz, and gradually diminishes throughout each test pass. If we begin to plot core temperature from the same benchmark, you’ll notice that our peaks to 84C drop clocks almost inversely proportional to temperature rise. These tests aren’t even that long – less than a minute each, in most cases – and we’re still slamming against the 84-degree wall that Pascal and Volta carry. The stock cooler is incapable of keeping up with the power load generated by the card when left to self-regulate.
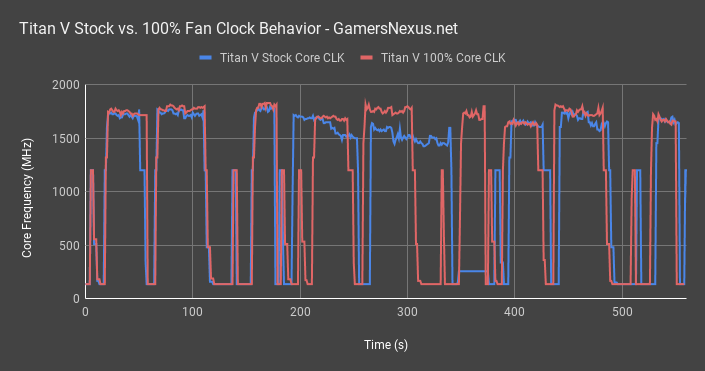
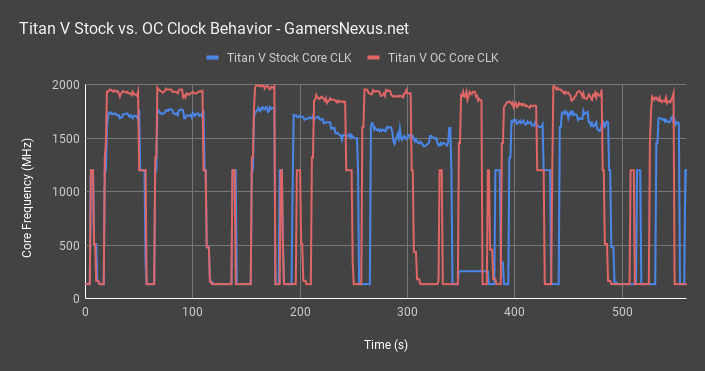
Let’s manually impose a 100% fan speed for the next round. This is primarily to understand performance, and is not sustainable in any real environment, as noise is at around 60dBA. Still, looking at a frequency chart between the auto and 100% fan curves with no overclock at all, we can see that the frequency picks-up considerably in a few of these tests. We see differences of 100MHz, in some instances. That’s a lot of performance left on the table.
These data points illustrate that we are throttling hard on thermals, well before we run into power limits – but those are the next limitation.
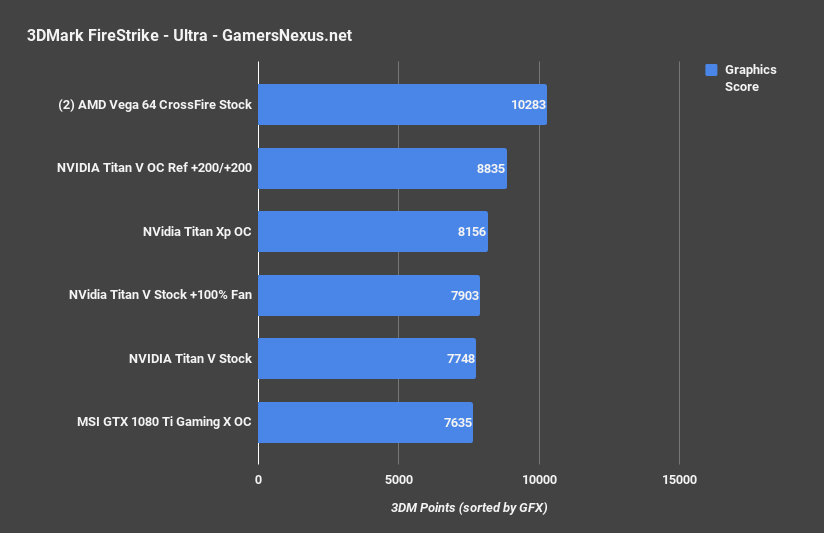
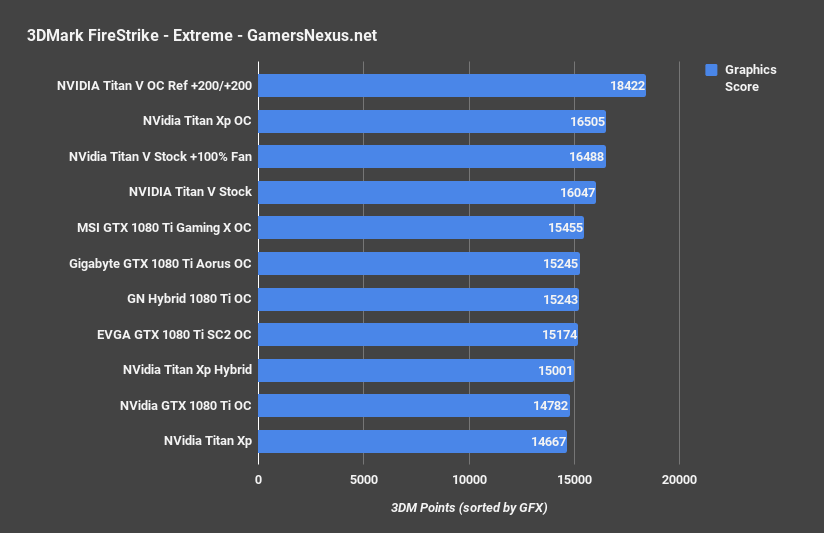
As for how that impacts performance, here are the Firestrike Ultra scores for the auto card, the 100% fan speed card, and the overclocked card: The stock card pushed a graphics score of 7748, while the stock card with a 100% fan speed resulted in 7903. The performance uplift from cooling improvement alone is 2%, with our fully overclocked card well beyond both of these numbers. Firestrike Extreme has the difference between the stock and 100% speed tests at 2.7%, as seen above.
Overclocked Titan V Thermals vs. Clocks
This next chart shows our overclock performance.
With a 200MHz core and HBM overclock, our core now pushes toward 2GHz at times, compared to the previous clocks that were 300MHz lower in the worst cases. This performance disparity is from three different factors: We’ve increased power budget, eliminating that concern, and have increased fan speed to 100%. We have also manually overclocked the card. All three of these produce the chart-topping performance numbers that we showed in our gaming benchmarks.
Looking at thermals, the fan speed increase helps prolong the time window before reaching clock limiters at 84C and beyond. Still, toward the end of the longer tests, we were getting up toward 87 degrees, resulting in clock drops over the duration of the test
Titan V vs. Titan Xp Thermals & Clocks
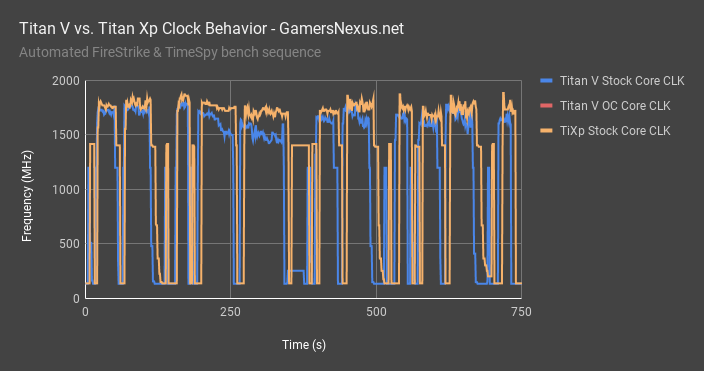
Just to demonstrate the previous generation, this chart shows stock Titan Xp versus stock Titan V scores. The Xp holds a higher clock when both are left to self-regulate, but is still beaten in some tests by the Titan V – you can learn more about those results in our previous Titan V gaming benchmarks video. This helps illustrate that the core count increase negatively impacts maximum stock clocks, but is made-up for in benchmarks that can leverage the cores. Timespy is a good example, and one which leverages lower level programming to distribute load more evenly across the additional cores.
Titan V MOSFET & GPU Temperature
Let’s move on to component temperatures.
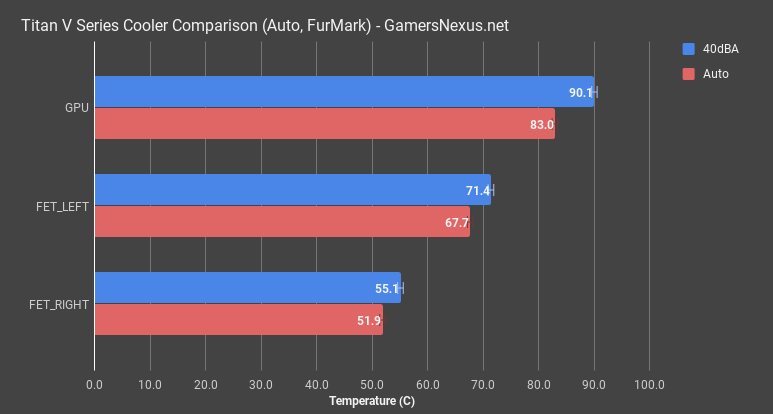
This chart shows the GPU temperature and two MOSFET case temperatures, measured by thermocouples that we mounted to the card. The left-side center MOSFET runs warmest, at 67.7 degrees, with the right-side middle MOSFET at 51.9 degrees Celsius. Both of these values are well within spec: These parts can take 125C without issue, and this follows the trend of nVidia Founders cards typically having more than adequate cooling for VRMs. We have seen this previously on the reference 10-series GPUs. MOSFET temperatures are completely controlled.
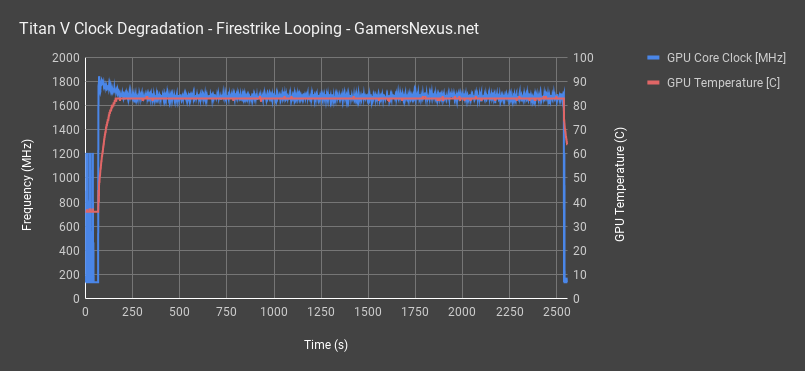
The GPU, however, isn’t. We are bumping against 84 degrees frequently, which means clock regulation over time. This frequency chart from our 30-minute FireStrike burn-in shows rapid clock degradation upon hitting the 84C wall, where the card’s stock configuration automatically regulates its clock speeds. This brings us down from 1837MHz to 1702MHz, and is another demonstration of why Titan V could be so much more powerful with a better cooler. We’ll be looking into that shortly.
Noise-Normalized 40dBA Testing on Titan V
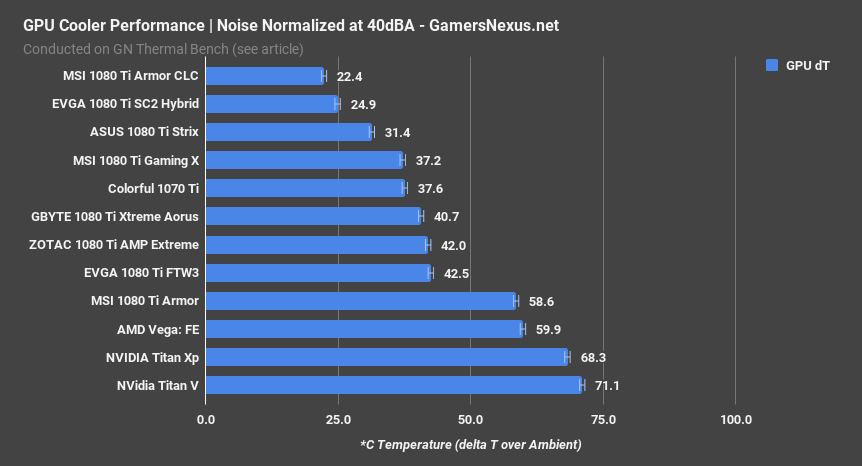
Note that we have switched to delta T over ambient for the X axis with comparative data versus other cards.
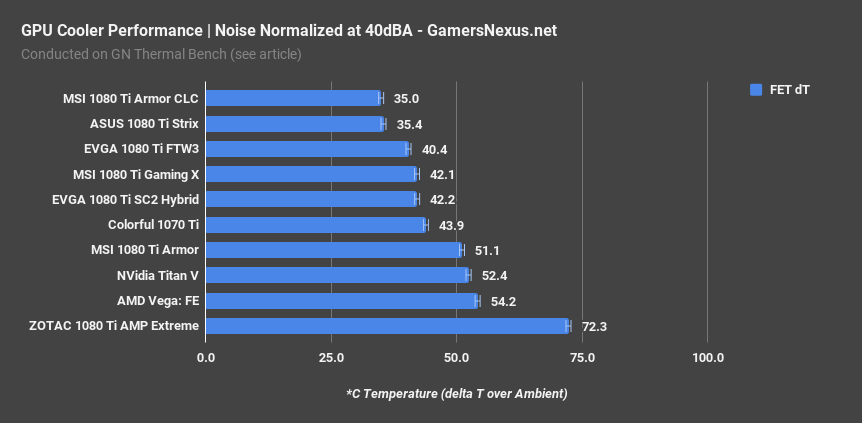
Looking at noise-normalized temperatures is almost pointless, as the Titan V just won’t be able to compete with the AIB partner models of lower-end hardware, even though “lower-end” in this instance is a relative reference to a 1080 Ti. Still, if you wanted to keep a 40-decibel operating noise level, the card would throttle down, and operate with GPU core temperatures of 90C and MOSFET hotspot temperatures of 71C. The MOSFETs are still fully within reason, but the core is throttling us hard. This card runs hot and runs loud.
NVidia Titan V Noise Levels
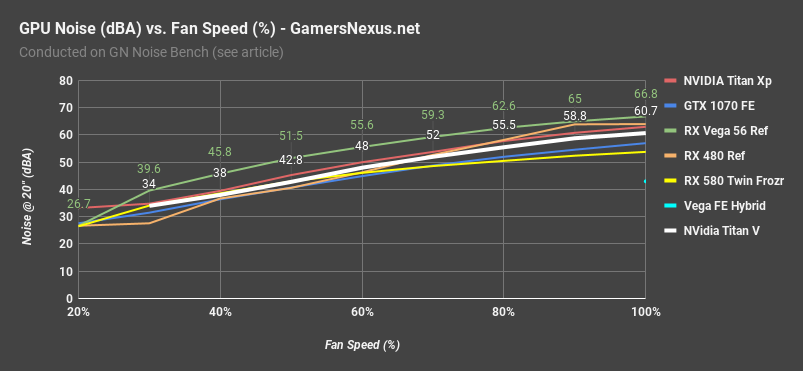
With the 40dBA tests, it helps to know our noise levels. The Titan V operates similar noise levels to other nVidia reference GPUs: We’re measuring about 31dBA idle, with the average fan speed under auto conditions placing us at around 48dBA. Going to 100% speed has us at 61dBA. Overall, it’s quieter than a reference Vega cooler, but is still ultimately inadequate as a cooling solution.
NVidia Titan V Power Consumption
This set of charts will show total system power consumption when under gaming workloads.
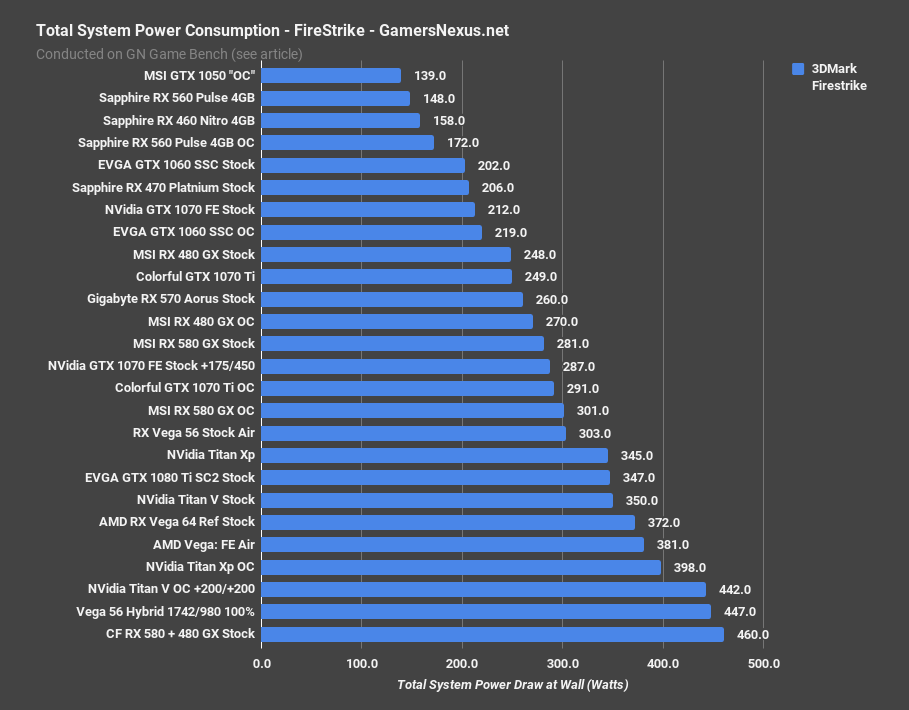
We’ll start with 3DMark Firestrike: In this test, the Titan V stock card system is drawing 350W from the wall. Comparing this to neighbors, we’re at 345W on the Titan Xp, 381W on the Vega: Frontier Edition – Air card, and 347W on the stock EVGA 1080 Ti SC2. The overclocked Titan V starts really pulling down power, pushing up to 442W total system draw in Firestrike. This puts us on-par with our powerplay table mod on Vega 56, which consumed 447W for the system. The difference is that we had a power target of 200% offset on the modded Vega card. Part of this inefficiency likely comes down to Volta not being a gaming-targeted architecture, with all these components on the die that go unused when gaming or benchmarking Firestrike.
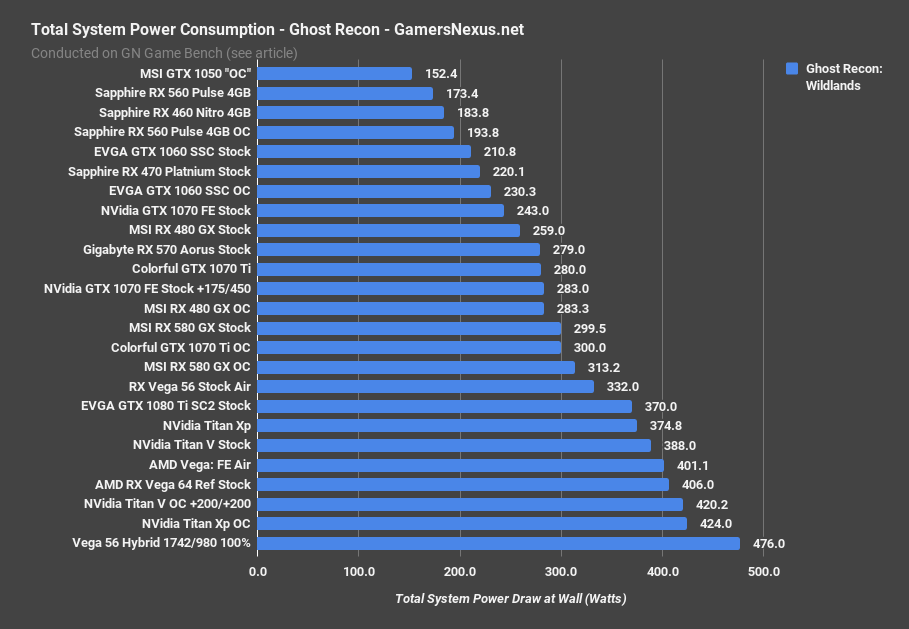
Moving to Ghost Recon: Wildlands, the Titan V system pulls 388W when stock, with the Titan Xp at about 375W stock. Remember, this is total system draw, not clamped draw. For a neighbor gaming comparison, the 1080 Ti demonstrates its performance efficiency at 370W for the EVGA SC2. Overclocking our Titan V without any mods gets it to 420W, right around where our overclocked Titan Xp landed. The powermodded Vega 56 card is the most power-hungry here, at 476W, as compared to its stock 332W total system consumption. The Titan V overclocked system is pulling 8.3% more power than the stock card.
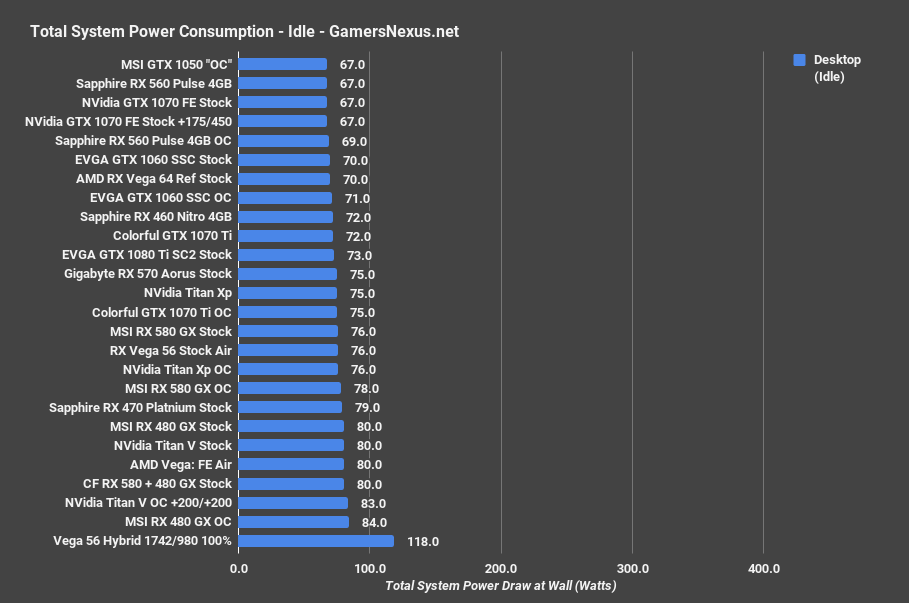
Idle power consumption has our complete system at around 80W, with the card just drawing enough to power the fan and some signaling.
Conclusion
This card is an interesting one: Given the scientific focus, the Titan V is not meant for most users in our core audience. Looking at thermals, then, we have to keep in mind potential use cases. One might be a rack-mount or box with high CFM fans dumping air into a multi-GPU array of Titan Vs. If that’s the case, these coolers can suffice – but we still think there’s room to improve the cooler while keeping the form factor.
For enthusiasts, although you are in an untargeted audience (aside from score-setting in Firestrike), you’ll want to mod the card with a better cooler or liquid cooler.
At $3000, it does feel like the cooler could be improved in bigger ways. The trouble is that this is a low-ish volume part, and that means retooling a new design would likely be prohibitively expensive. We’d hope it’d be seen as an investment for future FE cards.
Power consumption is comparatively high in gaming, but part of that is because the card is not using a gaming architecture. The Titan V has a lot of components which will never be accessed during gaming (like Tensor cores), and that takes up a lot of space, reducing the efficiency overall. We are curious to see how power consumption scales as nVidia moves to consolidate into a gaming architecture.
Editorial, Testing: Steve Burke
Video: Andrew Coleman