“Too Much Thermal Paste” – Benchmark of Thermal Paste Application & Quantity
Posted on
The “correct” method for applying thermal paste is still the subject of arguments, despite plenty of articles with testing and hard numbers to back them up. As we mentioned in our Threadripper paste application comparison, the general consensus for smaller desktop CPUs is that, as long as enough paste is applied to cover the IHS, every method is basically the same. The “blob” method works just fine. We have formally tested this for Threadripper (which cares about IHS coverage greatly) and X99 CPUs, but not for smaller desktop SKUs. Today debuts our formal thermal paste quantity testing -- not just method of application, but amount -- and looks specifically at the more common desktop CPUs. We are finally addressing the YouTube-wide comment of “too much” or “too little” paste, likely so prevalent as a result of everyone’s personal exposure to this one specific aspect of PC building.
Again, this isn’t really about whether an “X” or “dot” or thin spread is better (and none is superior, assuming all cover the IHS equally -- it’s just about how easily they achieve that goal). This is about how much quantity matters. See below example:
Paste Application Test Methodology
We settled on four paste applications to test: a normal blob appropriately sized for desktop chips, a blob we’d consider a little too large, a thin spread over the whole surface of the IHS, and finally a huge slathering of far too much paste. The variety of paste used for all of these tests was Thermal Grizzly Kryonaut. We debated over whether to use a more common product like Arctic MX-4, but part of the motivation for this test was to see whether our paste application method affects our tests, and we currently use Kryonaut for all of our tests that don’t specifically involve CPU temperature (we use a thin layer of Asetek paste for those). Tests were all done immediately after applying the paste. The performance of thermal paste can change over time as it cures, so the temperatures we measured should only be compared to each other, not other tests outside of this article.
We used a delidded 8086K clocked to 5.1GHz on a Maximus X board, using fixed voltages across the board, with uncapped current. The idea was to push temperatures into the 80-90C range without crashing or throttling, and to remove Intel’s thermal paste from the equation so any temperature fluctuations would be sharpened and magnified. The cooler used was a Kraken X62, tightened down in the same way each time, along with a Noctua NF-A12 pointed at the motherboard to blow some air over the VRM heatsinks.
To stress the CPU, we used Prime95 with 8Kx8K FFTs tested in-place with an FFT time of 30 minutes. Each test ran for half an hour with a current clamp around the CPU 8-pin cable, a temperature probe next to the bench to log ambient temperatures, and HWInfo64 running to log sensor data.
We tested with 100% fan speeds and left them fixed. They were not variable.
Bad Data and Tightening our Results
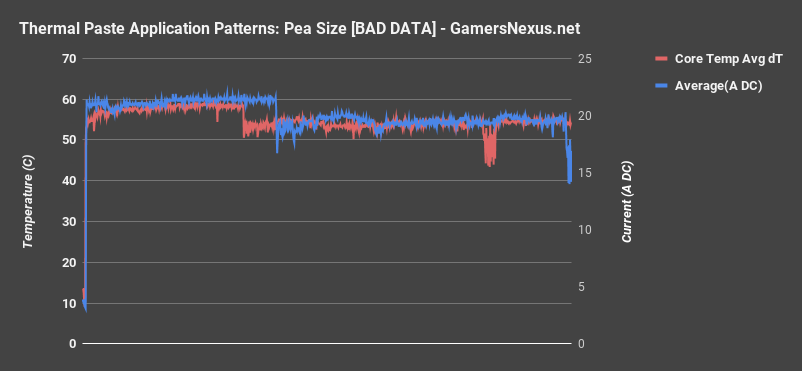
Windows was downloading updates in the background during the first two tests passes we attempted and both had to be scrapped. Normally we disable Windows updates and don’t connect to the internet during testing, and this is exactly why. As the charts show, current and temperatures vary throughout the tests as Windows diverts system resources away from Prime95. There’s also some desync between the current clamp’s numbers and the temperature logging, but that’s fine--they’re only plotted on the same graph for visualization, they’re not interdependent.
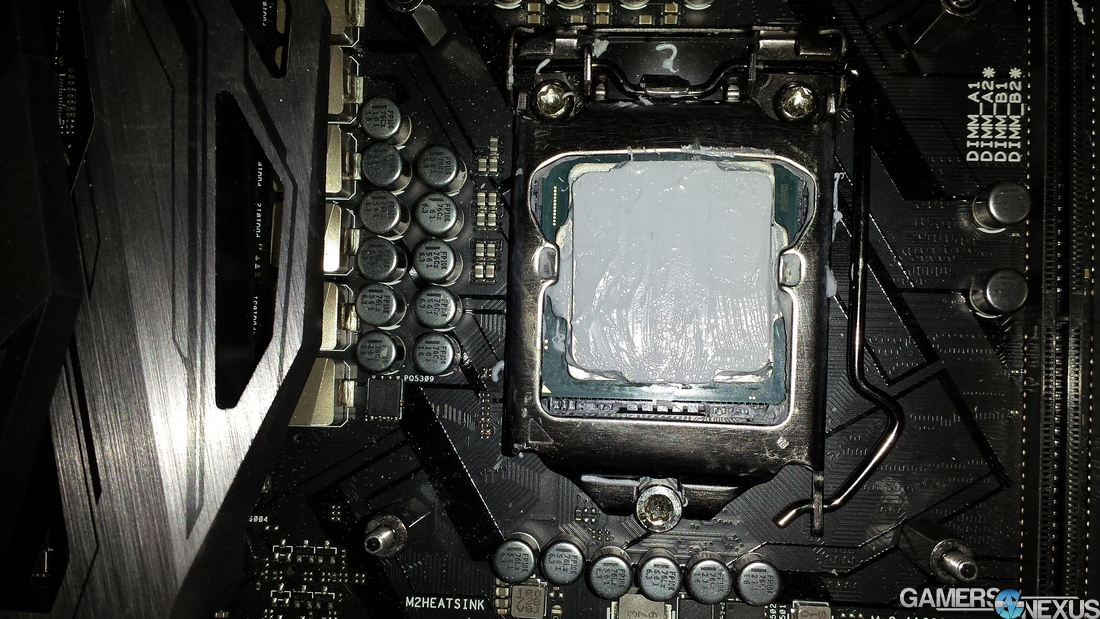
Big Blob - Best Thermal Paste Application Method
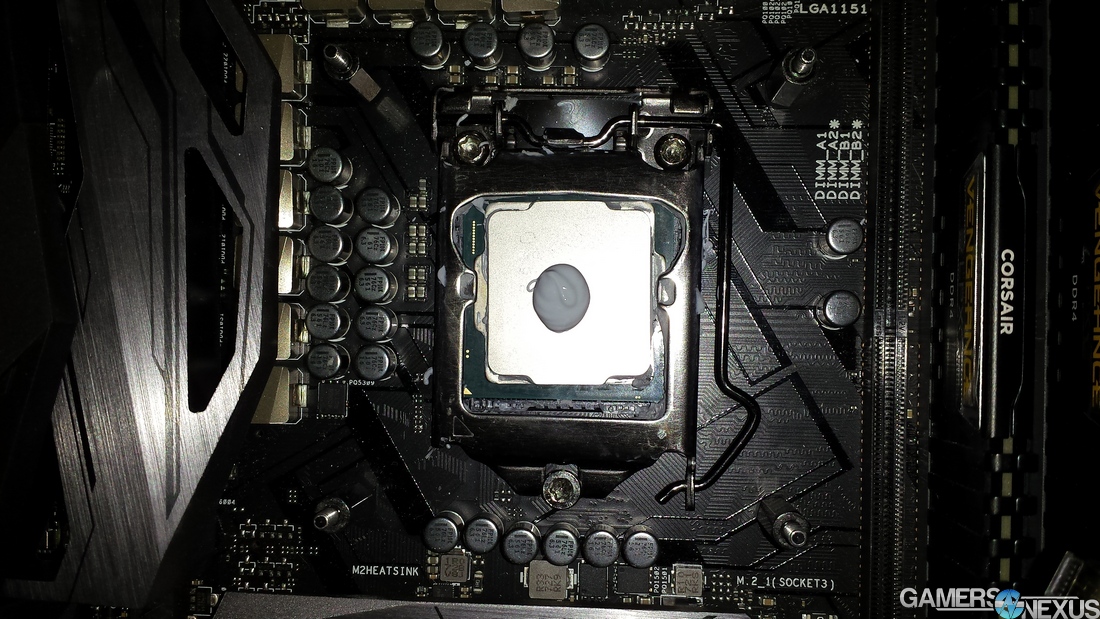
Dimensions (XYZ): 10.12mm x 12.22mm x 3.1mm
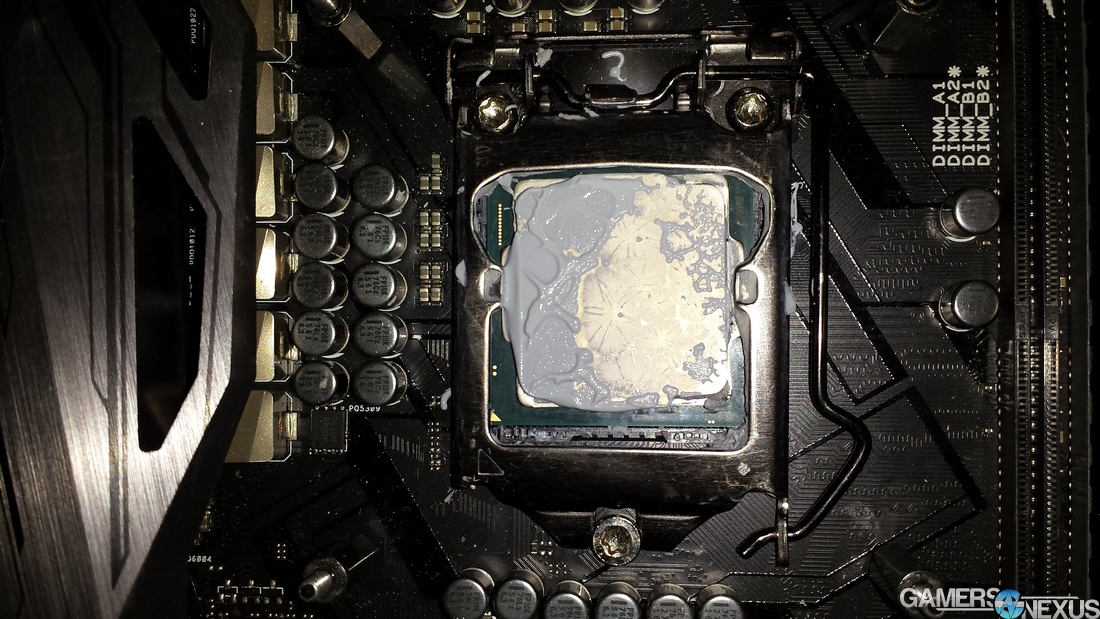
The “big blob” test was the first one with usable results. This is an excessive amount of thermal paste, but within the bounds of what a sane human might use. The blob measured at 10.12mm x 12.22mm x 3.1mm deep. With the cooler installed and tightened down, only a little paste squeezed out over the edges of the IHS, and there was a layer of paste that remained between the coldplate and the CPU. Conventional wisdom says that a really thick layer of paste is bad, since ideally the coldplate and IHS should be as close to each other as physically possible, but we’ll wait until the end of the article to compare temperature averages. Keep in mind that cooler tension forces the past out the sides when excessive, and that removing the cooler will relieve that surface tension. To clarify: The “after shots” do not show what the paste looked like when it was hidden under the coldplate, as the surface tension during cooler removal will suck the paste back up and inward, toward the middle of the coldplate.
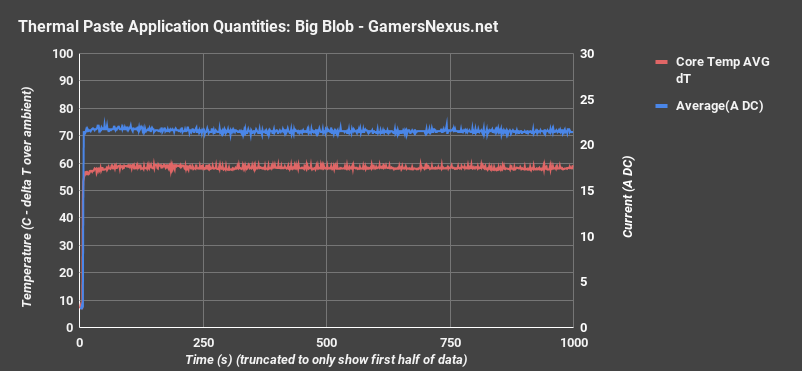
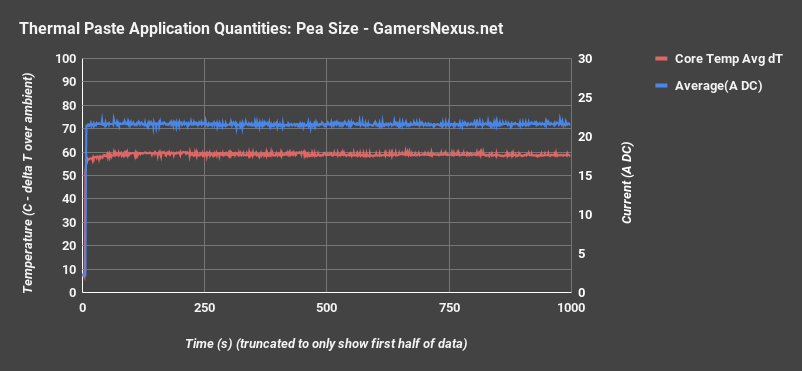
Here’s an over-time chart with data for the big blob. We’ll compare these results to the others at the end of the content. For now, we’re bouncing between 58 and 61 degrees Celsius delta T over ambient. We’ll average the results later. Current is around 21A, or about 250-256W at the 12V rails.
Thin Spread - Best Thermal Paste Application Method
Dimensions: full IHS coverage
This is the application method that we use for tests that specifically involve CPU testing. That’s partly because this is the “best” method according to ancient PC building tradition, and partly because the Asetek paste we often use comes in big tubs and there’s no other way to apply it. The idea is that spreading a thin layer ensures maximum contact between the coldplate and the IHS, and thinning it out makes the gap between the two as small as possible. Whether or not that actually helps is internet argument fodder. One worry with this method is that the uneven surface could trap air bubbles when the coldplate is pressed against it, but there’s no indication that this was a problem.

Here’s our over-time chart of performance. It’s worth mentioning that, regardless of thermal performance, a thin layer of paste is really easy to deal with. There’s less danger of uneven coverage, it uses a minimal amount of paste, and it’s easy to clean up. There’s also the peace of mind that comes from knowing with 100% certainty that the IHS is fully covered without taking the cooler off.
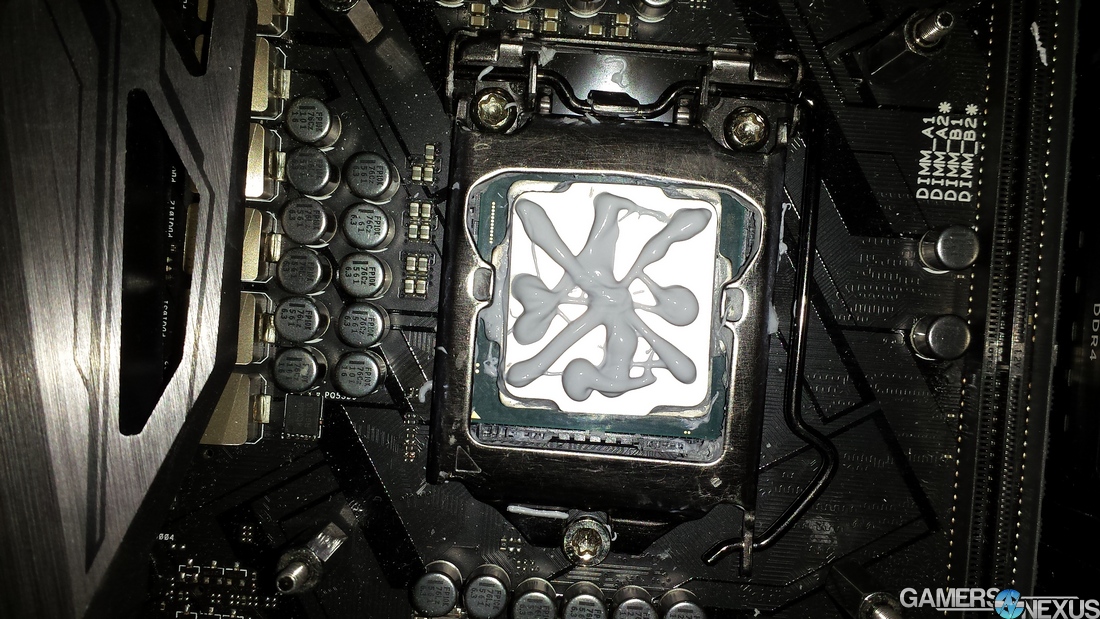
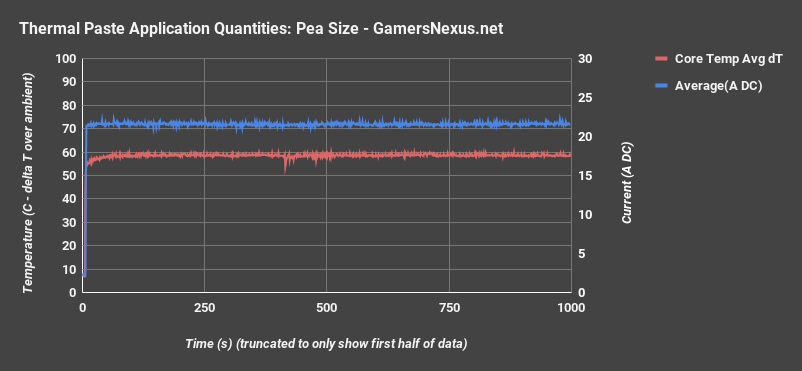
Pea-Sized Dot - Best Thermal Paste Application Methods

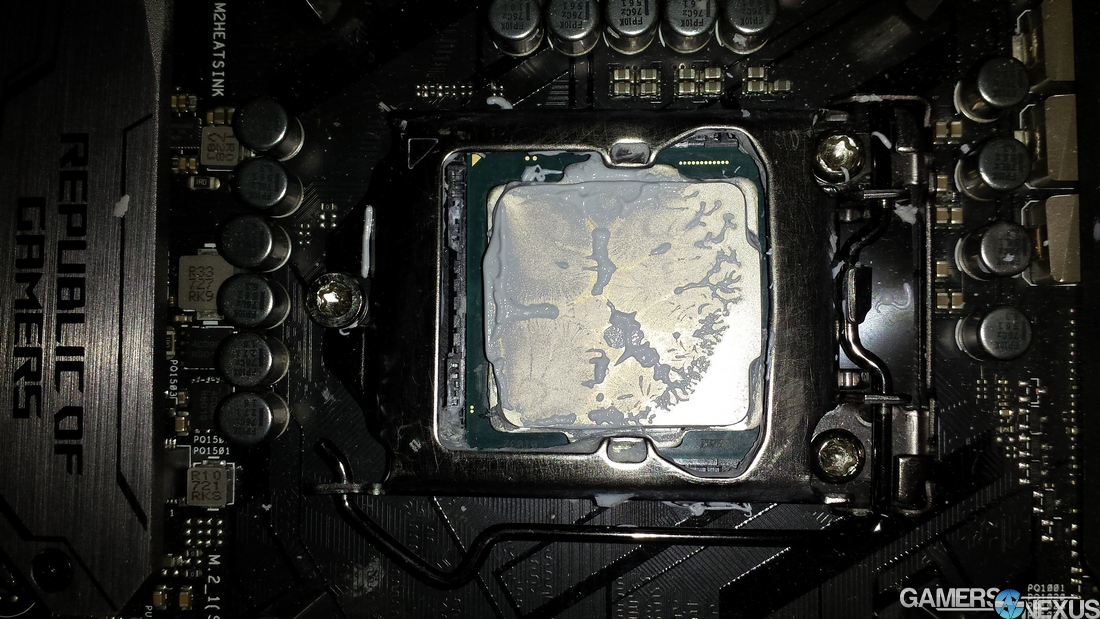
Dimensions (XYZ): 9.16mm x 8.76mm x 2.97mm
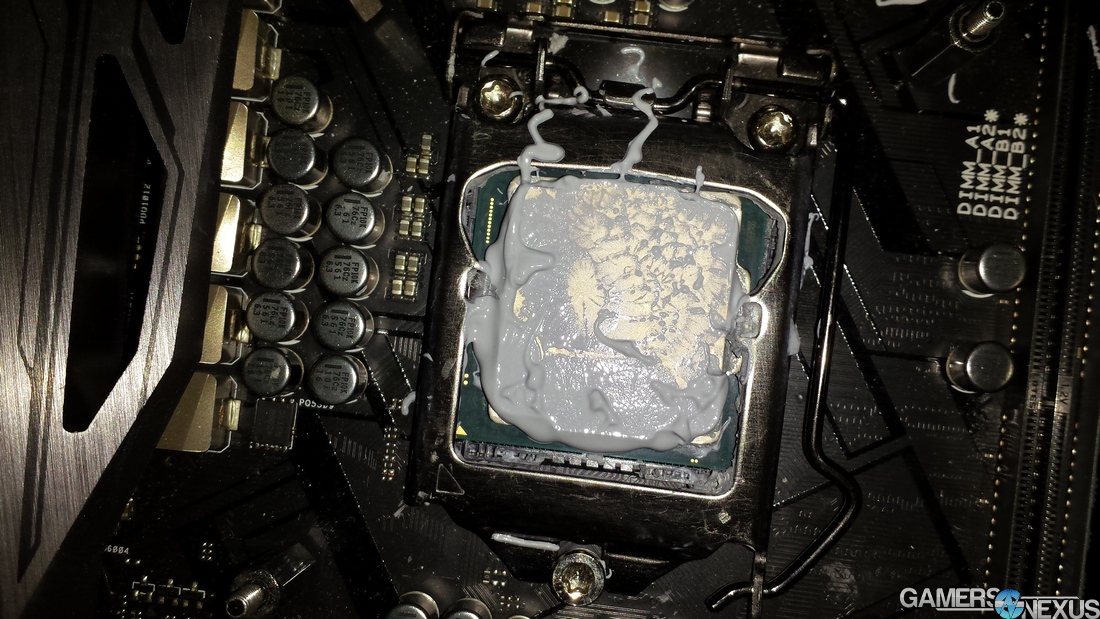
Next is the pea-sized dot method. This is the method we use for tests where CPU temperatures aren’t vital, like building a new Windows OS or just testing to see if all the components work. It’s extremely fast and repeatable: that may not matter much to the average user, but we swap out multiple CPUs and coolers every day and convenience really matters. The first photo showed the dot, but after photo reveals one of the downsides of just doing a blob of paste, which is that extra care is needed to put even pressure on the cooler when tightening it down. The hotspot over the die was covered, but one corner of the IHS was left dry. That’s something we avoid in normal testing, but in this test, it’s an important variable that we want to account for. This is a potentially real user result, and so we tested under these conditions. Our over-time chart, thus far, reveals mostly similar results – but we’ll have to look at the averaged results at the end for a conclusive analysis. As a note, that pea-sized dot was 9.16mm x 8.76mm x 2.97mm deep.
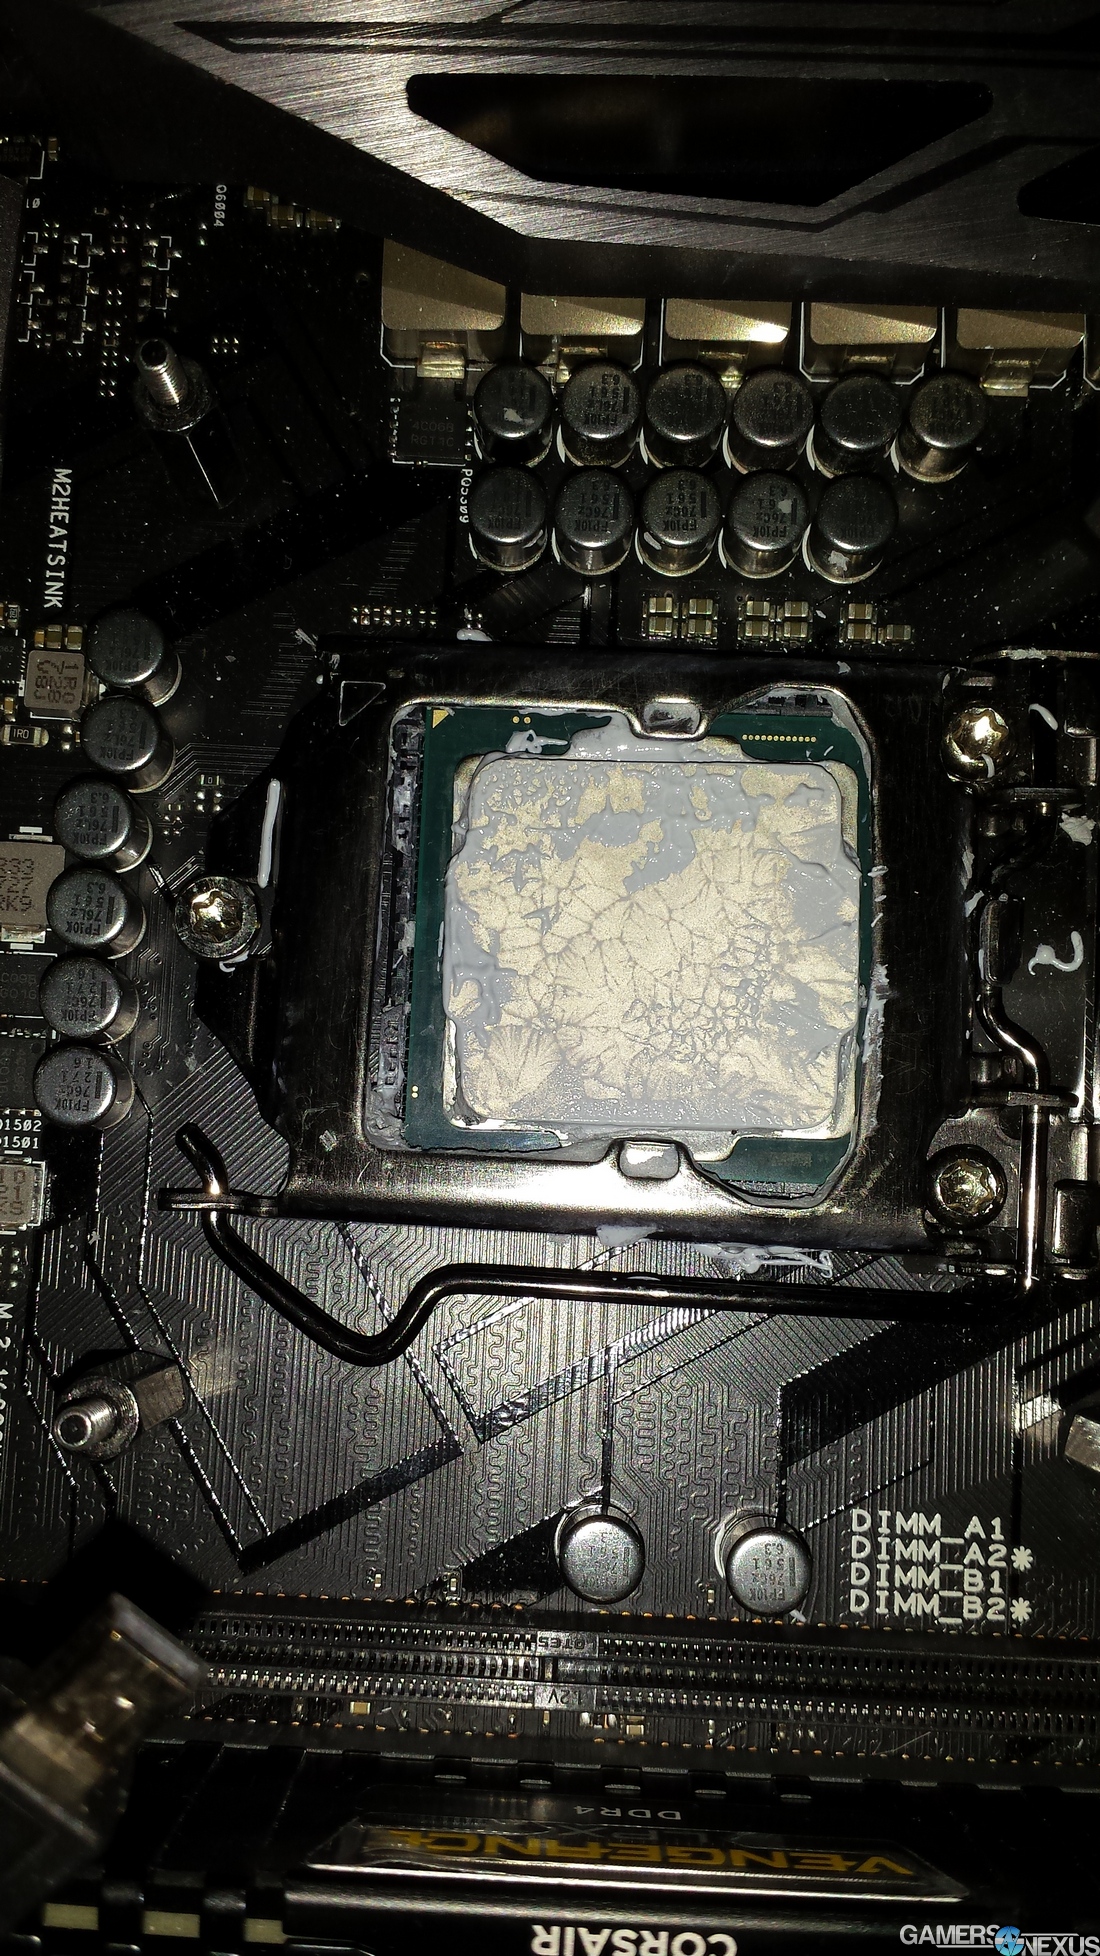
Too Much Thermal Paste
Dimensions: full IHS, roughly 1.76mm height
This method is one that we simply dubbed “TOO MUCH.” It’s 50% of the comments on YouTube about thermal paste, with the other 50% being “too little.” In this instance, we really did apply way too much, objectively, just to make absolutely sure that there’s no question this is a wasteful amount of paste. Even regardless of performance, even in a scenario where performance is the same, this is clearly just plain wasteful and annoying to clean up.
Dimensions are immeasurable, but basically the entire IHS with 1.76mm height at the peak.
Here’s our over-time plot. This is just too much paste. The Kryonaut paste we used isn’t conductive, but some pastes are, and even when they aren’t, it’s still no fun to clean gunk out of a CPU socket. As seen in the picture, not only did the paste ooze out over the edges of the CPU, it also dripped out over the socket cover and motherboard when the cooler was removed.
Thermal Paste Benchmark: Manual Spread vs. Dot
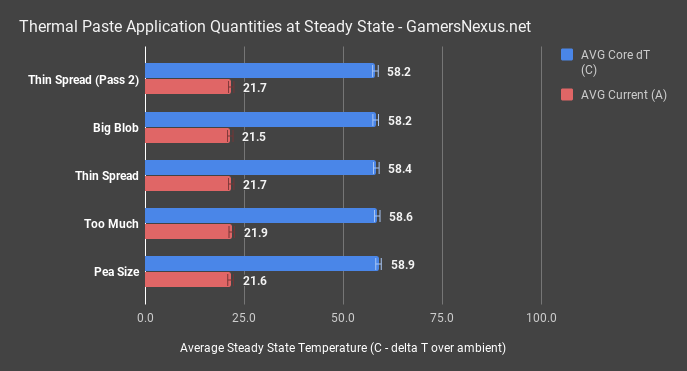
Now that we’ve looked at each test individually, the before and after photos, and ensured the current provision is the same, we should compare all of these tests on one chart. We’ll look at average core temperature at steady state, including the current for each test. This will help illustrate that power consumption was the same. Remember: Current * Voltage gives your power, and we’re on a 12V rail, so that puts our average power as around 256W.
All results land at about 58 degrees delta T over ambient, +/- 0.46C from the median. Average current as clamped at the 12V rails was 21.5A, with only marginal differences within variance. Test conditions remained the same, room ambient and HVAC were controlled and monitored each second, and the liquid cooler was permitted to reduce water temperature to steady state idle in between each test pass. We feel confident in our data on this CPU. Remember, this is a 256W load with a delidded CPU using liquid metal, so this is one of the most likely scenarios where you’d see a difference in the quantity of paste impacting results. We are producing a ton of heat, which means the conditions of the thermal interfaces are stressed, thus creating an environment that would yield differences, should any exist. It doesn’t seem like they do.
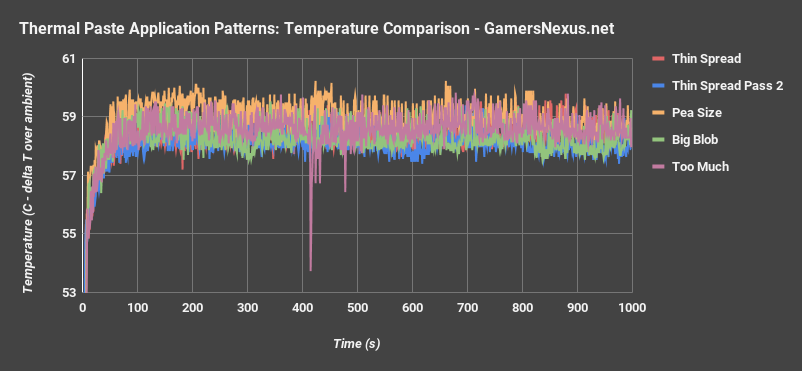
This last graph is a mess, but that’s intentional. Let’s walk through it.
The graph above includes the temperature logs for each of the valid tests, but zoomed in to a range of eight degrees. Almost every data point within the test period falls within a two degree range, 58-60 degrees C dT. The reason the graph is hard to read even at this scale is that the temperatures are all almost exactly the same.
This graph includes the temperature logs for each of the valid tests, but zoomed in to a range of eight degrees. We know the scale is insane, but that’s the point. Almost every data point within the test period falls within a two-degree range, and that range is 58-60 degrees C dT over ambient. The reason the graph is hard to read even at this scale is that the temperatures are all almost exactly the same.
Our testing agrees with what many other tests have shown over the years, including our own, and even Luke’s from ages past: as long as there’s enough paste to cover the IHS, or at least the part directly over the dies, there’s a negligible difference between application methods. We put a moderately sized blob in the middle of the IHS for almost every non-thermally-sensitive test we do because it’s fast, it works as well as any other method, and it’s easy to replicate. We manually spread for easy replication between multiple staff working on the same test, but only when doing thermal benchmarks. Even though the “pea size” test was the only one that left a spot uncovered on the IHS, the average dT was still less than a degree different from the other tests. In fact, the full range of results from best to worst was less than one degree.
Putting too much paste on a socket generally won’t hurt thermal performance, because the act of tightening down the cooler squeezes out the excess. Too little paste is bad, but anything above the minimum threshold will have the same effect once the cooler is tightened down. The problem with excess isn’t thermals, it’s the danger of shorting components with conductive paste, or just making a huge mess. It’s also possible that with lower quality paste applying large quantities would hurt thermals more, but again, this test covers our own methodology, and we use Kryonaut.
Let’s recap some older coverage just to illustrate that this can be highly situational, despite our results being relatively conclusive for Intel desktop parts.
Threadripper Recap
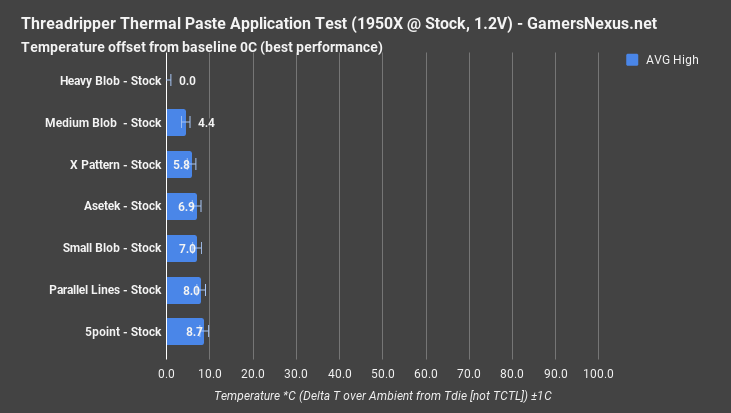
As a recap, we previously conducted similar testing for the AMD Threadripper CPUs, published one year ago. The testing conclusively demonstrated that the biggest consideration, particularly with a multi-chip module like Threadripper, is that all dies need to be covered. You can see in our TR4 paste application thermal chart that full IHS coverage also helps, something we demonstrated again in our Noctua full coverage plate Threadripper benchmarks. We illustrated this yet again in our Enermax CLC benchmarks, where the small Asetek cooler coldplates struggled to keep up.
The difference with Threadripper, again, is that we’re working with a multi-chip module and a massive CPU package. This is the opposite of a small K-SKU Intel CPU, and although similar in multi-die approach to Ryzen, the desktop AMD CPUs are still significantly smaller.
Coldplate Recap

Finally, our most recently testing of this kind involved the Asetek-made Corsair H100i Pro, where we demonstrated that manual application improved cooling performance in a meaningful way. We spread paste out over the entire heatspreader, as opposed to using the stock Asetek circular application that only covered a central portion of the X99 IHS. There is one key difference here: That testing involved an X99 CPU. It was actually producing less heat than our 8086K we tested with today, but the significantly larger IHS meant there was more to be gained from covering the rest of it. The Asetek circle neglected about 25% of the heatspreader’s surface area, whereas the 8086K application methods never left more than 10-15% of the spreader uncovered.
Conclusion: What is the Best Way to Apply Thermal Paste?
So again, the bigger goal is to cover the IHS. Once that’s accomplished, assuming you’re using a non-insane amount of paste, like an entire tube of TG, it really doesn’t matter how big the blob is. If you’re using conductive thermal paste, be mindful of shorting SMDs and small components. Also be mindful of cleanup later on. Beyond these non-thermal considerations, the biggest goal is not doing “too little.” The pressure from the cooler will take care of the rest.
Editorial: Patrick Lathan & Steve Burke
Testing: Patrick Lathan & Steve Burke
Video: Andrew Coleman