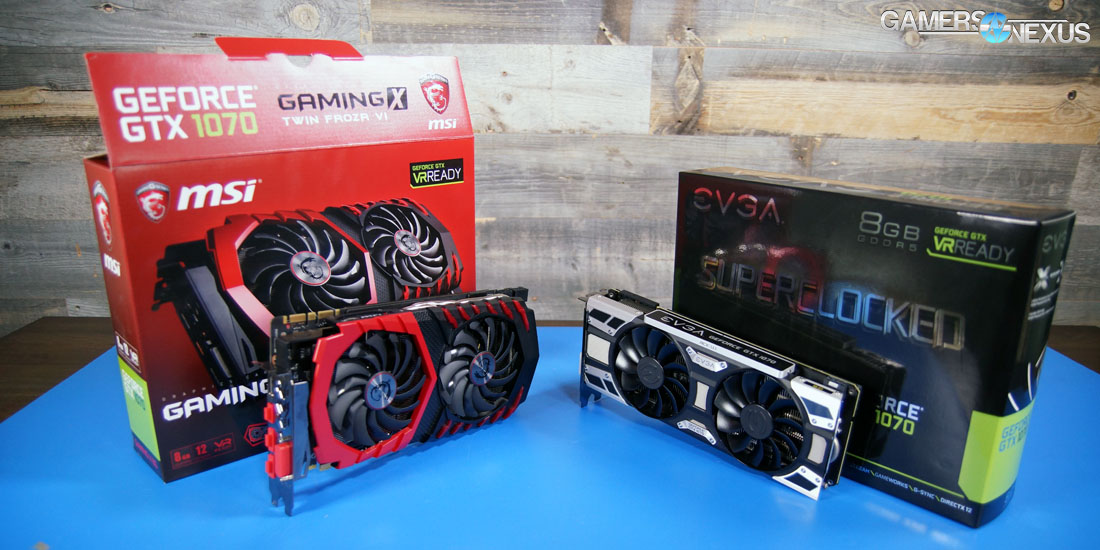
EVGA's GTX 1070 SC introduces the company's ACX 3.0 air cooler, an update we detailed in our Computex coverage of EVGA's GTX 1080 FTW, Hybrid, and Classified cards. The 1070 SC is part of EVGA's “SuperClocked” family, which is the most affordable pre-overclocked card that the company sells. The vertical will likely later add an SSC card, or Super SuperClocked, with non-OC cards falling below SC in price. The GTX 1070 SC has an MSRP of $440, or $10 below the $450 Founders Edition that we reviewed, and is one of EVGA's first 1070s to market.
This review of the EVGA GTX 1070 SC looks at thermals, FPS, noise, and overclocking. We compare the EVGA 1070 SC vs. the MSI GTX 1070 Gaming X and NVIDIA GTX 1070 Founders Edition cards.
GTX 1070 & Pascal Architecture Content
To catch-up on the GTX 1080 & GTX 1070:
EVGA GTX 1070 SC Overclocking [Video Review]
NVIDIA GTX 1070 Specs
| NVIDIA Pascal vs. Maxwell Specs Comparison | ||||||
| Tesla P100 | GTX 1080 | GTX 1070 | GTX 980 Ti | GTX 980 | GTX 970 | |
| GPU | GP100 Cut-Down Pascal | GP104-400 Pascal | GP104-200 Pascal | GM200 Maxwell | GM204 Maxwell | GM204 |
| Transistor Count | 15.3B | 7.2B | 7.2B | 8B | 5.2B | 5.2B |
| Fab Process | 16nm FinFET | 16nm FinFET | 16nm FinFET | 28nm | 28nm | 28nm |
| CUDA Cores | 3584 | 2560 | 1920 | 2816 | 2048 | 1664 |
| GPCs | 6 | 4 | 3 | 6 | 4 | 4 |
| SMs | 56 | 20 | 15 | 22 | 16 | 13 |
| TPCs | 28 TPCs | 20 TPCs | 15 | - | - | - |
| TMUs | 224 | 160 | 120 | 176 | 128 | 104 |
| ROPs | 96 (?) | 64 | 64 | 96 | 64 | 56 |
| Core Clock | 1328MHz | 1607MHz | 1506MHz | 1000MHz | 1126MHz | 1050MHz |
| Boost Clock | 1480MHz | 1733MHz | 1683MHz | 1075MHz | 1216MHz | 1178MHz |
| FP32 TFLOPs | 10.6TFLOPs | 9TFLOPs | 6.5TFLOPs | 5.63TFLOPs | 5TFLOPs | 3.9TFLOPs |
| Memory Type | HBM2 | GDDR5X | GDDR5 | GDDR5 | GDDR5 | GDDR5 |
| Memory Capacity | 16GB | 8GB | 8GB | 6GB | 4GB | 4GB |
| Memory Clock | ? | 10Gbps GDDR5X | 4006MHz | 7Gbps GDDR5 | 7Gbps GDDR5 | 7Gbps |
| Memory Interface | 4096-bit | 256-bit | 256-bit | 384-bit | 256-bit | 256-bit |
| Memory Bandwidth | ? | 320.32GB/s | 256GB/s | 336GB/s | 224GB/s | 224GB/s |
| TDP | 300W | 180W | 150W | 250W | 165W | 148W |
| Power Connectors | ? | 1x 8-pin | 1x 8-pin | 1x 8-pin 1x 6-pin | 2x 6-pin | 2x 6-pin |
| Release Date | 4Q16-1Q17 | 5/27/2016 | 6/10/2016 | 6/01/2015 | 9/18/2014 | 9/19/2014 |
| Release Price | TBD (Several thousand) | Reference: $700 MSRP: $600 | Reference: $450 MSRP: $380 | $650 | $550 | $330 |
EVGA GTX 1070 SC Specs
EVGA's GTX 1070 SC is one of the more affordable cards in the company's stack. The “SC” cards (or “SuperClocked”) are hierarchically tiered lower than SSC and FTW cards, with only a few flagship GPUs receiving Classified or K|NGP|N cards.
This is an SC card. Its clock-rate is natively configured to 1594MHz / 1784MHz (base/boost), which is increased roughly 100MHz over the GTX 1070 Reference (“Founders Edition”) clock-rate of 1506MHz / 1683MHz. EVGA's shipping its 1070 SC with an effective memory clock of 8008MHz – the same as the GTX 1070. All GTX 1070 video cards will use GDDR5 memory, not the GDDR5X (“G5X”) debuted on the GTX 1080.
Dimensionally, the EVGA GTX 1070 SC is more workable than some of MSI's newest video cards, like the MSI 1080 Gaming X we just reviewed (and the MSI 1070 Gaming X, which uses the same size PCB). EVGA's SC card runs the same height as the expansion slot – ~4.376”, or 111.15mm – and uses exactly two expansion slots. There is no “2.5” slot setup, here. Its 10.5” length is fully saturated with fans and an aluminum heatsink.
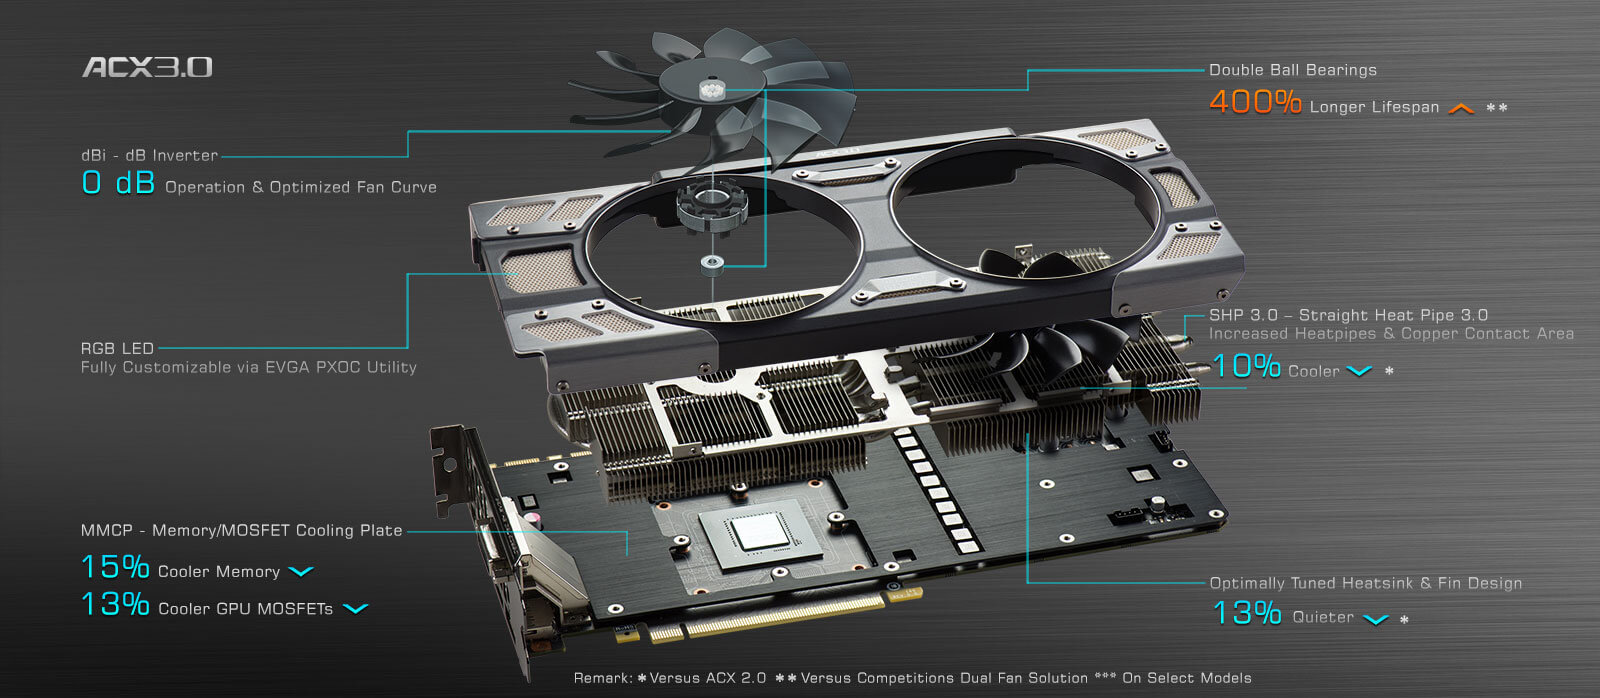
New coolers accompany nearly every generational jaunt. EVGA's longest-standing cooling solution falls under the “ACX” brand name (“Active Cooling Xtreme”). The company updated to ACX 3.0 with the Pascal launch, something we detailed with great specificity in our Computex 2016 coverage of EVGA.
The ACX 3.0 cooler has been updated in a few ways which EVGA claims to be critical to its performance gains. Of note, the fan blades in the ACX 3.0 fans are now marginally thicker than on ACX 2.0. Theoretically, this reduces noise levels by reducing turbulence between the blades, thereby reducing vibration and its resulting 'whirr.' The fans use double-ball bearings, which is somewhat common in these coolers.
Like most vendors, EVGA's ACX cooler also spins down to 0RPM when the card is under limited power draw or thermal demand (through a built-in fan curve). This means the card generates effectively 0dB when under idle loads or lightweight gaming loads, e.g. DOTA2.
ACX 3.0 also makes changes to heatpipes. Unlike MSI, who have resorted to squared heatpipes toward the coldplate, EVGA is sticking with rounded heatpipes that have a “filling” in the corners between the heatpipe and heatsink. When we asked if that filling is copper, we were told “something like that, yeah.”
The two fans are mounted atop a somewhat standard aluminum finned heatsink. The heatsink then sits atop a baseplate, which uses thermal pads to cover the VRAM and MOSFETs/VRM components.
As far as visuals, EVGA's updated the face of its ACX graphics cards. ACX 3.0 is accompanied with LED backlighting for the meshed locations on the card. Some cards use RGB LEDs, but the SC sticks with white LED backlights.
Continue to Page 2 for test methodology.
Game Test Methodology
We tested using our GPU test bench, detailed in the table below. Our thanks to supporting hardware vendors for supplying some of the test components.
The unreleased AMD drivers (16.6.1) were used for testing. NVidia's latest drivers were used for game (FPS) testing (368.39). Game settings were manually controlled for the DUT. All games were run at presets defined in their respective charts. We disable brand-supported technologies in games, like The Witcher 3's HairWorks and HBAO. All other game settings are defined in respective game benchmarks, which we publish separately from GPU reviews. Our test courses, in the event manual testing is executed, are also uploaded within that content. This allows others to replicate our results by studying our bench courses.
Windows 10-64 build 10586 was used for testing.
Each game was tested for 30 seconds in an identical scenario, then repeated three times for parity. Some games have multiple settings or APIs under test, leaving our test matrix to look something like this:
| Ashes | Talos | Tomb Raider | Division | GTA V | MLL | Mordor | BLOPS3 | Thermal | Power | Noise | |
| NVIDIA CARDS | |||||||||||
| GTX 1080 | 4K Crazy 4K High 1080 High Dx12 & Dx11 | 4K Ultra 1440p Ultra 1080p UltraVulkan & Dx11 | 4K VH 1440p VH 1080p VHDx12 & Dx11 | 4K High 1440p High 1080p High | 4K VHU 1080 VHU | 4K HH 1440p VHH 1080p VHH | 4K Ultra 1440p Ultra 1080p Ultra | 4K High 1440p High 1080p High | Yes | Yes | Yes |
| GTX 980 Ti | 4K Crazy 4K High 1080 High Dx12 & Dx11 | 4K Ultra 1440p Ultra 1080p UltraVulkan & Dx11 | 4K VH 1440p VH 1080p VHDx12 & Dx11 | 4K High 1440p High 1080p High | 4K VHU 1080 VHU | 4K HH 1440p VHH 1080p VHH | 4K Ultra 1440p Ultra 1080p Ultra | 4K High 1440p High 1080p High | Yes | Yes | Yes |
| GTX 980 | 4K Crazy 4K High 1080 High Dx12 & Dx11 | 4K Ultra 1440p Ultra 1080p UltraVulkan & Dx11 | 4K VH 1440p VH 1080p VHDx12 & Dx11 | 4K High 1440p High 1080p High | 4K VHU 1080 VHU | 4K HH 1440p VHH 1080p VHH | 4K Ultra 1440p Ultra 1080p Ultra | 4K High 1440p High 1080p High | Yes | Yes | Yes |
| AMD CARDS | |||||||||||
| AMD R9 390X | 4K Crazy 4K High 1080 High Dx12 & Dx11 | 4K Ultra 1440p Ultra 1080p UltraVulkan & Dx11 | 4K VH 1440p VH 1080p VHDx12 & Dx11 | 4K High 1440p High 1080p High | 4K VHU 1080 VHU | 4K HH 1440p VHH 1080p VHH | 4K Ultra 1440p Ultra 1080p Ultra | 4K High 1440p High 1080p High | Yes | Yes | No |
| AMD Fury X | 4K Crazy 4K High 1080 High Dx12 & Dx11 | 4K Ultra 1440p Ultra 1080p UltraVulkan & Dx11 | 4K VH 1440p VH 1080p VHDx12 & Dx11 | 4K High 1440p High 1080p High | 4K VHU 1080 VHU | 4K HH 1440p VHH 1080p VHH | 4K Ultra 1440p Ultra 1080p Ultra | 4K High 1440p High 1080p High | Yes | Yes | Yes |
Average FPS, 1% low, and 0.1% low times are measured. We do not measure maximum or minimum FPS results as we consider these numbers to be pure outliers. Instead, we take an average of the lowest 1% of results (1% low) to show real-world, noticeable dips; we then take an average of the lowest 0.1% of results for severe spikes.
| GN Test Bench 2015 | Name | Courtesy Of | Cost |
| Video Card | This is what we're testing! | - | - |
| CPU | Intel i7-5930K CPU | iBUYPOWER | $580 |
| Memory | Corsair Dominator 32GB 3200MHz | Corsair | $210 |
| Motherboard | EVGA X99 Classified | GamersNexus | $365 |
| Power Supply | NZXT 1200W HALE90 V2 | NZXT | $300 |
| SSD | HyperX Savage SSD | Kingston Tech. | $130 |
| Case | Top Deck Tech Station | GamersNexus | $250 |
| CPU Cooler | NZXT Kraken X41 CLC | NZXT | $110 |
For Dx12 and Vulkan API testing, we use built-in benchmark tools and rely upon log generation for our metrics. That data is reported at the engine level.
Video Cards Tested
- EVGA GTX 1070 SC ($440)
- MSI GTX 1070 Gaming X
- NVIDIA GTX 1080 Founders Edition ($700)
- NVIDIA GTX 980 Ti Reference ($650)
- NVIDIA GTX 980 Reference ($460)
- NVIDIA GTX 980 2x SLI Reference ($920)
- AMD R9 Fury X 4GB HBM ($630)
- AMD MSI R9 390X 8GB ($460)
Thermal Test Methodology
We strongly believe that our thermal testing methodology is the best on this side of the tech-media industry. We've validated our testing methodology with thermal chambers and have proven near-perfect accuracy of results.
Conducting thermal tests requires careful measurement of temperatures in the surrounding environment. We control for ambient by constantly measuring temperatures with K-Type thermocouples and infrared readers. We then produce charts using a Delta T(emperature) over Ambient value. This value subtracts the thermo-logged ambient value from the measured diode temperatures, producing a delta report of thermals. AIDA64 is used for logging thermals of silicon components, including the GPU diode. We additionally log core utilization and frequencies to ensure all components are firing as expected. Voltage levels are measured in addition to fan speeds, frequencies, and thermals. GPU-Z is deployed for redundancy and validation against AIDA64.
All open bench fans are configured to their maximum speed and connected straight to the PSU. This ensures minimal variance when testing, as automatically controlled fan speeds will reduce reliability of benchmarking. The CPU fan is set to use a custom fan curve that was devised in-house after a series of testing. We use a custom-built open air bench that mounts the CPU radiator out of the way of the airflow channels influencing the GPU, so the CPU heat is dumped where it will have no measurable impact on GPU temperatures.
We use an AMPROBE multi-diode thermocouple reader to log ambient actively. This ambient measurement is used to monitor fluctuations and is subtracted from absolute GPU diode readings to produce a delta value. For these tests, we configured the thermocouple reader's logging interval to 1s, matching the logging interval of GPU-Z and AIDA64. Data is calculated using a custom, in-house spreadsheet and software solution.
Endurance tests are conducted for new architectures or devices of particular interest, like the GTX 1080, R9 Fury X, or GTX 980 Ti Hybrid from EVGA. These endurance tests report temperature versus frequency (sometimes versus FPS), providing a look at how cards interact in real-world gaming scenarios over extended periods of time. Because benchmarks do not inherently burn-in a card for a reasonable play period, we use this test method as a net to isolate and discover issues of thermal throttling or frequency tolerance to temperature.
Our test starts with a two-minute idle period to gauge non-gaming performance. A script automatically triggers the beginning of a GPU-intensive benchmark running MSI Kombustor – Titan Lakes for 1080s. Because we use an in-house script, we are able to perfectly execute and align our tests between passes.
Continue to Page 3 for thermals & noise.
EVGA GTX 1070 SC Thermal Benchmark vs. Founders, MSI Twin Frozr
Thermal benchmarks remain a mainstay of our testing, backed by validation from thermal chambers in a previous exhibition. AIB partner cards distance themselves from reference designs by implementing significantly more advanced cooling solutions, coincidentally aiding in allowing higher pre-overclock configurations.
The EVGA and MSI GTX 1070s (SC and Gaming X, respectively) both use a dual-fan setup, each with push fans directly mounted to aluminum heatsinks. The reference design (“Founders Edition”) uses a single blower fan at the very end of the card, with a finned heatsink right-aligned on the PCB. This pulls air in from the case and exhausts it out of the expansion slot. Push fans will trap cool air in the heatsink, but eventually exhaust it into the case for extraction. Some of the air still escapes through the rear expansion slot.
This configuration is fine for the vast majority of gaming PC builds, as those often use mid-tower (or larger) cases. Specific HTPC or SFF builds may be better cooled by a blower fan, which will help remove hot air from other components within the confined space.
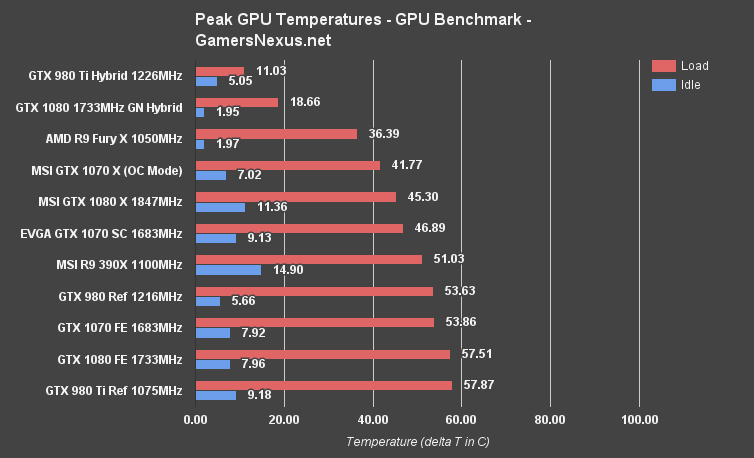
That aside, here's a look at peak GPU temperatures during load and idle times:
The GTX 1070 Reference card with FE heatsink rests at 53.86C load (Delta T over ambient) with its 1683MHz stock clock. MSI's new GTX 1070 Gaming X card, leveraging the Twin Frozr VI cooler, sees a 25.29% difference in thermals against the FE card. This plants MSI at 41.77C dT even when in the pre-assigned “OC Mode” (~1797MHz). EVGA's ACX 3.0 cooler lands it between the MSI and FE devices, at 13.84% different from FE (46.89C vs. 53.86C).
The MSI cooler pulls ahead of EVGA by nature of sticking a massive heatsink (with naturally larger fans) to the PCB. MSI's PCB is also taller than the expansion slot – somewhat annoyingly, as we've written – but the trade-off is greater cooling ability. The EVGA card performs well. It's a few degrees warmer than MSI's (46.89C vs. 41.77C), but still within a range of being largely “unnoticeably different” for most users. Overall cooling performance is greatly improved over the FE card.
EVGA GTX 1070 SC Thermals Over Time
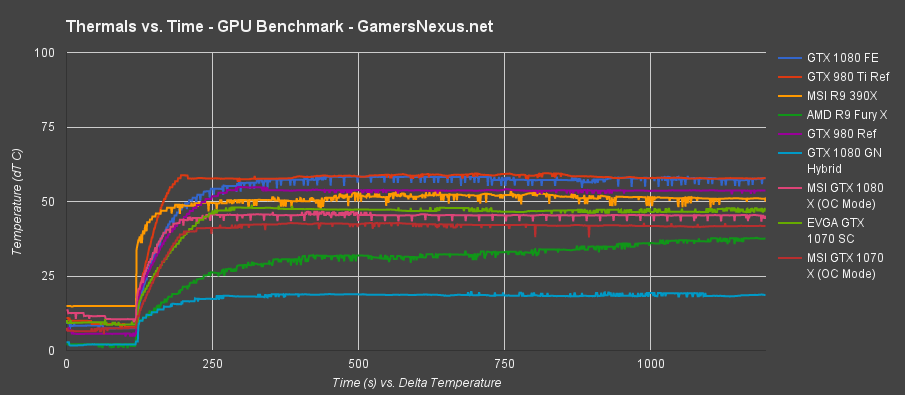
Here's a look at the same data set, but projected versus time:
Burn-in begins at 120 seconds in this chart, at which point it's a race to the peak thermals. Cards eventually asymptote / flat-line and stabilize in their thermals. The GTX 1070 SC sits between the GTX 1080 Gaming X and MSI R9 390X.
EVGA GTX 1070 SC Noise Levels vs. Founders Edition, MSI 1070
We've simplified our decibel analysis charts. The charts will no longer show the “noise print” test, which runs prior to our test execution when the system is off, and will instead use the below logarithmic formula to create delta dB values:
![]()
The numbers can now be directly compared. Each of the four main values (Idle, Auto, Fan 50%, Fan 100%) can be directly compared/contrasted against one another. This allows a quick way to look at which video card is quietest.
Note that we do not subtract the system noise itself, only the environment noise. To this end, the values are still representative of total system noise (similar to how power tests are total system power draw). The quietest possible dB value will be capped by the system operating noise.
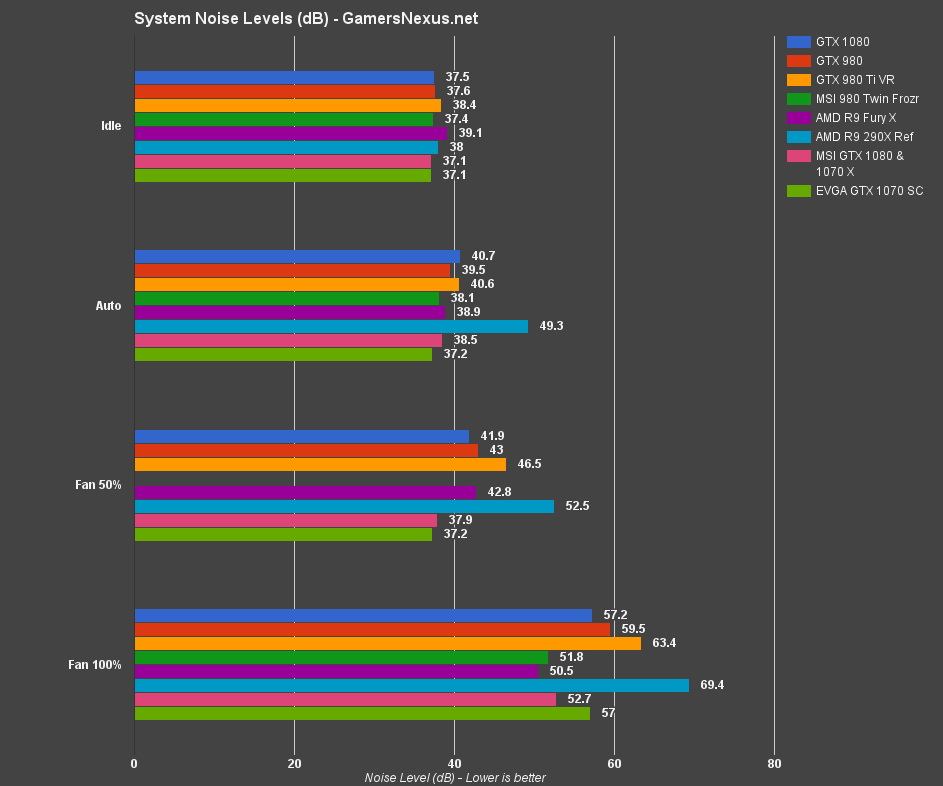
Idle produces the number we'd expect – an identical value between the MSI and EVGA GTX 1070 cards. Both cards operate at an effective 0RPM when under idle loads, so shy of any idle electrical whine, the values should be identical. This places the system noise at 37.1dB.
Using the auto fan curve and after 5 minutes of burn-in, the AIB partner 1070s land at 37.2dB (EVGA) and 38.5dB (MSI). The reference GTX 1070 and reference GTX 1080 operate at 40.7dB.
With 50% fan speeds, we see the EVGA 1070 stick around its 37.2dB value (the auto fan curve had us at ~50%, so that fits the performance), with MSI at 37.9dB (auto ran over 50%, in some instances).
At 100% fan speed, the EVGA GTX 1070 SC operates at 57dB, reasonably louder than MSI's GTX 1070 Twin Frozr at 52.7dB. The reference cards are at 57.2dB – just slightly louder than the EVGA card. That said, these devices should almost never hit 100% fan speeds. This often only occurs when the user manually configures such a high speed, as the auto settings will keep RPM closer to 50%.
Continue to the next page for Dx12, Vulkan vs. Dx11 Benchmarks.
EVGA GTX 1070 SC FPS Benchmarks – Dx12, Vulkan vs. Dx11
This page explores performance using the new DirectX 12 and Khronos Group Vulkan APIs, leveraging a few game/benchmark titles to compare metrics versus DirectX 11. Comparative testing between Dx12 and Vulkan uses only average FPS (as opposed to our OpenGL & Dx11 tests, which use AVG, 1% low, and 0.1% low frametimes). We're able to simplify charts for a more head-to-head comparison in this regard, and we then produce separate charts (see: Ashes) for frame latency differences.
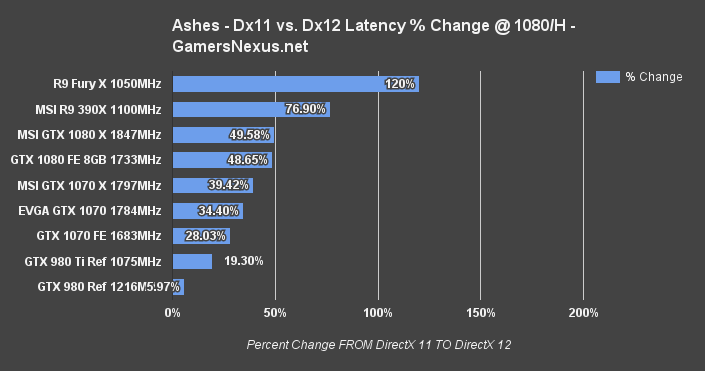
Some of this data is shown as percent change or ms latency, so it is not all just straight FPS. The charts help us look at async compute performance and acceptance of new APIs.
Comparative Dx12 vs. Dx11 FPS in Ashes of Singularity – EVGA 1070 SC vs. FE
Ashes of the Singularity is still one of the best-built Dx12 games. Ashes has supported Dx12 ground-up, which means that it's more than a mere wrapper.
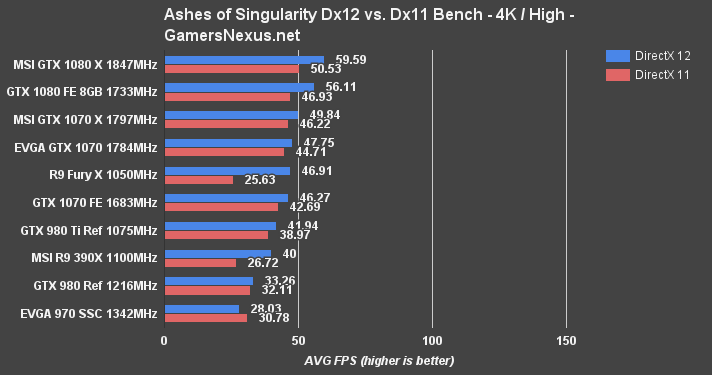
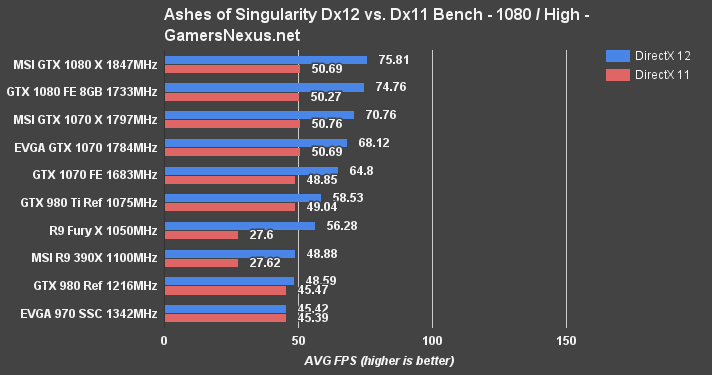
Ashes of Singularity serves as one of the new API benchmark games on our test platform. At 1080/high, we see similar tiering as before: The MSI 1070 is marginally ahead of the EVGA 1070 SC, which is slightly ahead of the reference card. Between the MSI 1070 and Reference card, there's a more noteworthy gap of 8.79%. The MSI GTX 1070 and EVGA GTX 1070 are separated by just 3.8%.
4K High posts similar results. The MSI card runs at 49.84FPS average in Dx12, with EVGA running at 47.75FPS average. The reference card sits at 46.27FPS average.
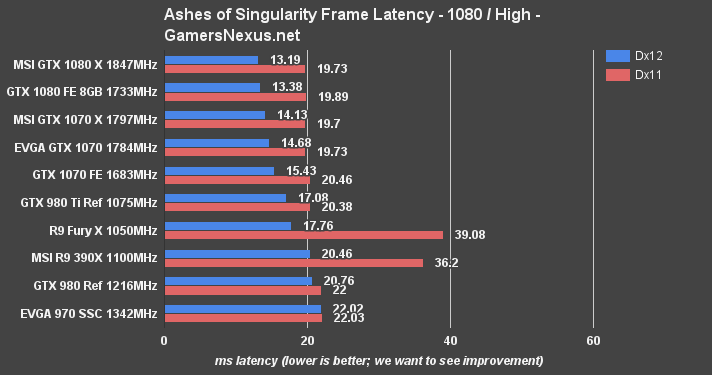
EVGA and MSI post effectively identical average frame latencies in Ashes, both around 19.7ms for Dx11 and 14-15ms for Dx12. Nothing exciting here, as is somewhat expected. The clock-rate increase produces the marginal gain over nVidia's reference card.
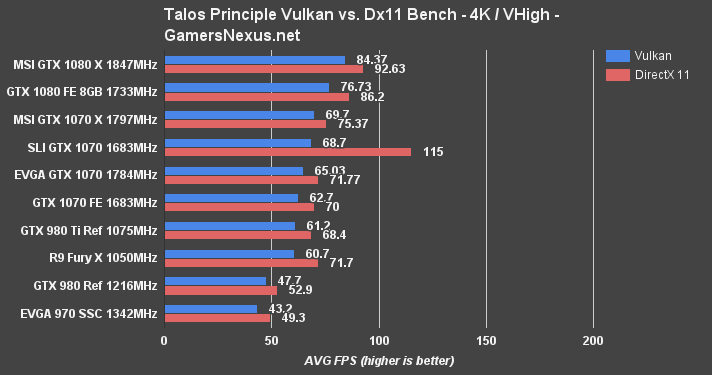
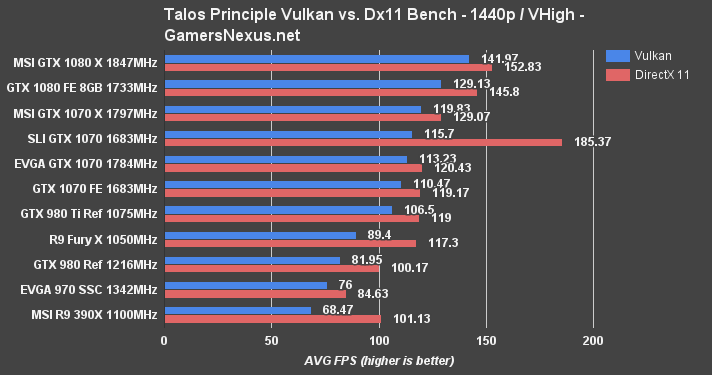
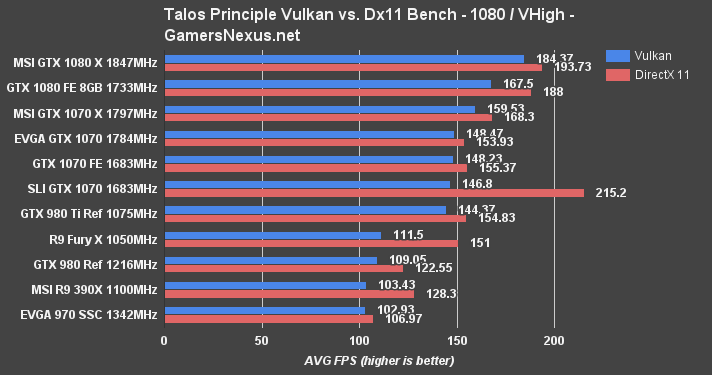
Comparative Vulkan vs. Dx11 in Talos Principle – EVGA 1070 SC vs. MSI 1070
As expected, we're seeing identical tiering as in every other test: the MSI 1070 outputs higher FPS than EVGA's 1070 (6.9% in Vulkan), and EVGA's 1070 SC is slightly faster than the FE (10.57%) at 4K. The delta values are more exaggerated in less clock-sensitive tests, shown well in the 1440p test with an 8.2% gap between the 1070 FE and 1070 Gaming X.
Overall, though, performance is effectively the same.
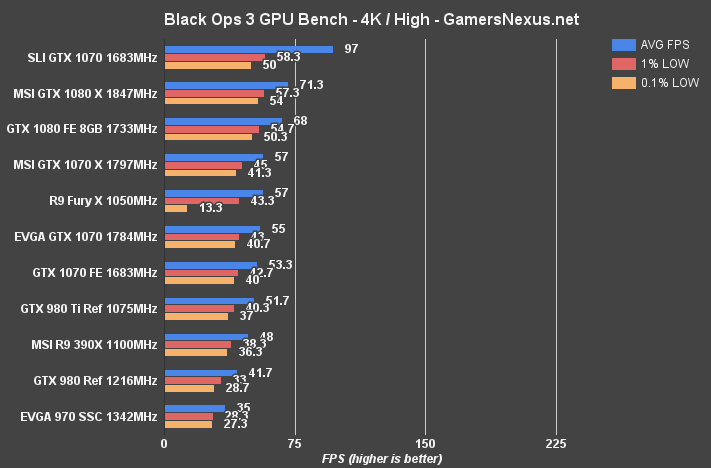
Black Ops 3 Benchmark – EVGA 1070 SC vs. 1070 FE, MSI 1070, Fury X
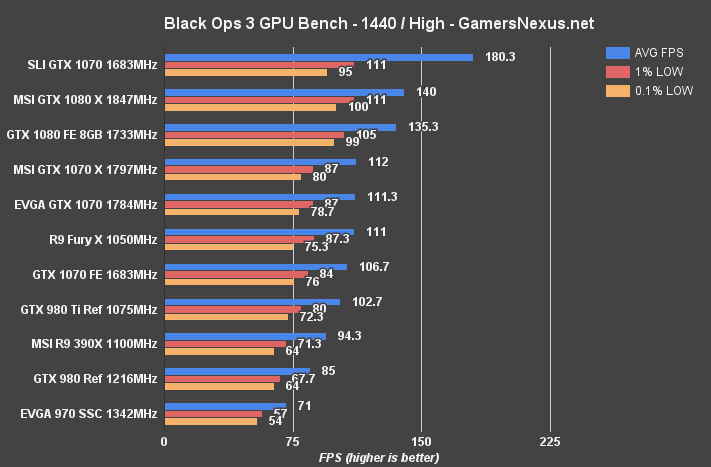
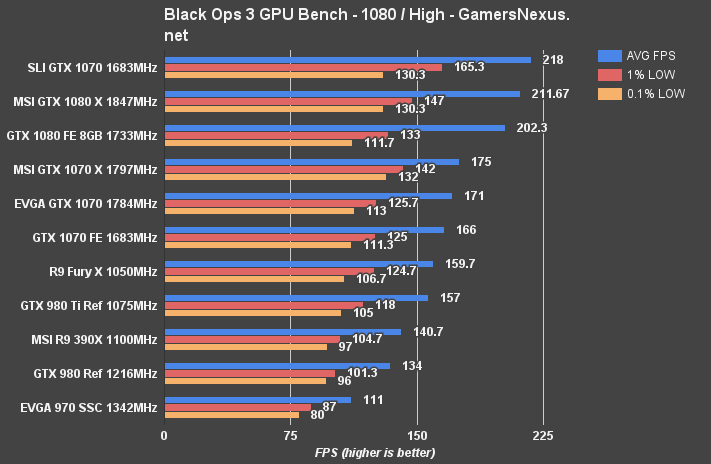
Black Ops III at 1080p shows the MSI GTX 1070 at 175FPS AVG and the GTX 1070 SC at 171FPS AVG, with the MSI card sustaining generally higher 1% and 0.1% low values as a result of its stable clock-rate. Granted, that doesn't mean they're noticeable at this high framerate. The Founders Edition card sits at 166FPS, or a difference of 2.97%.
Moving to 1440p, we see the EVGA GTX 1070 SC and MSI GTX 1070 Gaming X are effectively tied, with the MSI version of the card leading by just 0.7FPS – completely imperceptible to the user. The cards are, for all intents and purposes, identical in performance. There is a slight gain of 4.2% when moving from the reference 1070 to the EVGA 1070 SC.
At 4K, the EVGA GTX 1070 performs at 55FPS AVG and sustains tightly-timed 1% and 0.1% lows at 43FPS and 40.7FPS, respectively. These are superior to the Fury X, which looks fine in its averages, but fails massively in the 0.1% low department as a result of its low VRAM. The MSI GTX 1070 Gaming X runs at 57FPS average, or a gain of 3.57% over the EVGA card. The reference card sits at 53.3FPS. They're all pretty close at 4K, mostly because it's such an abusive setting.
Mirror's Edge Catalyst Benchmark – EVGA 1070 SC vs. MSI 1070, 1070 SLI, 390X
Our initial Mirror's Edge Catalyst GPU benchmark can be found here, including information on the game's overall performance.
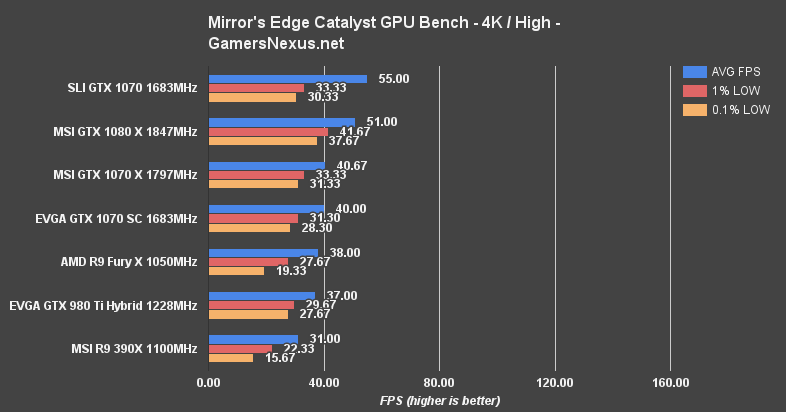
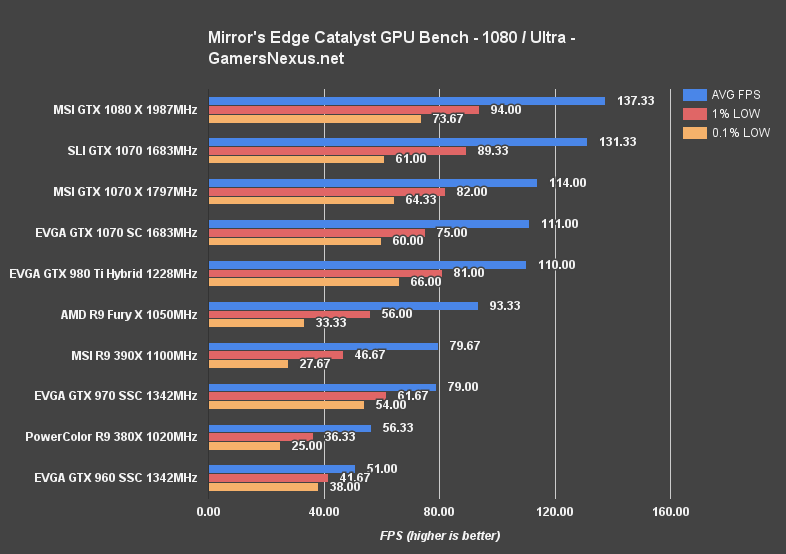
Running at 4K, the GTX 1070 SC is about equal with the MSI GTX 1070 Gaming X, both of which run ~10FPS below the 1080 Gaming X (22.5% difference).
The Division Benchmark – EVGA 1070 SC vs. MSI 1070 Gaming X
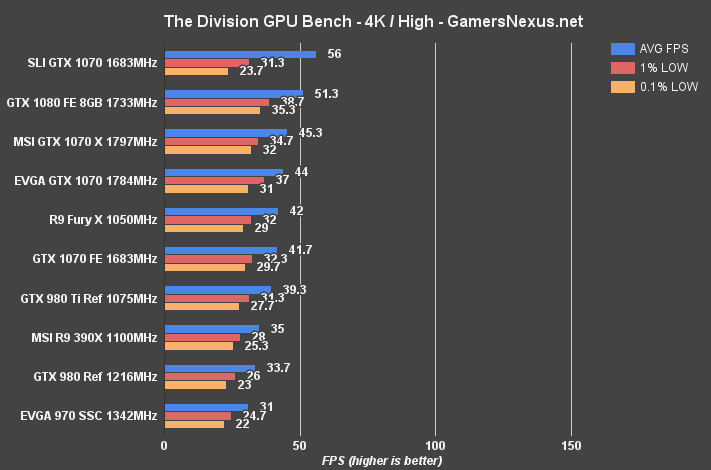
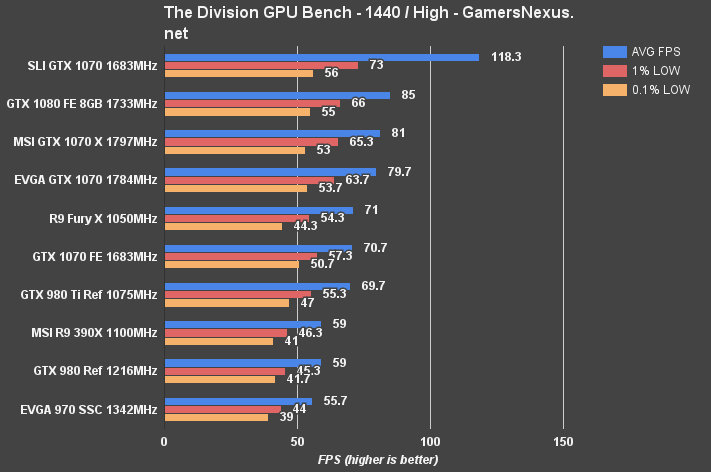
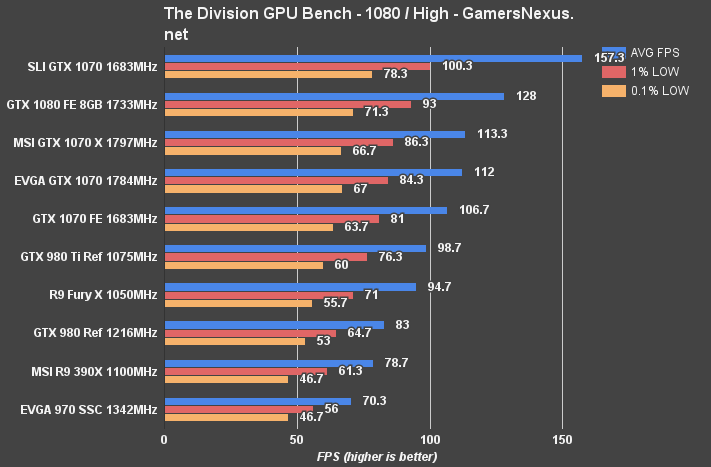
The Division is relatively punishing – evident in part by its mass exodus of players. The GTX 1070 Gaming X runs 1.3FPS faster than the EVGA GTX 1070 SC (2.9%), and the SC runs 8.23% faster than the FE card at 4K. At 1440p, all three cards easily maintain 100+ FPS, with the tiering stacked similarly to 4K.
GTA V Benchmark – EVGA 1070 SC vs. 1070 FE, MSI 1070 X, 390X, 380X
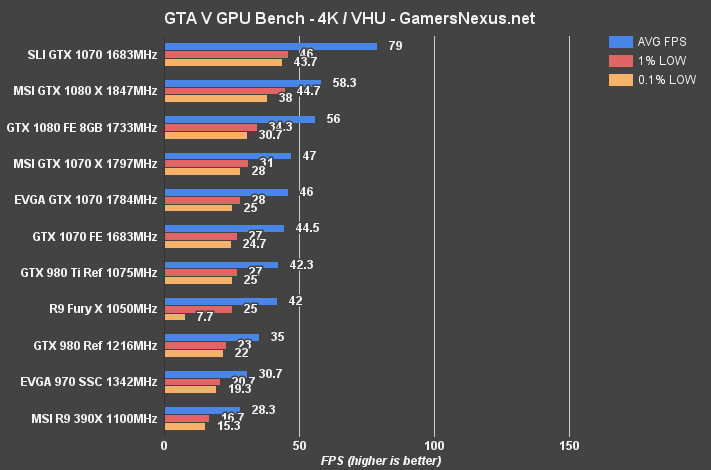
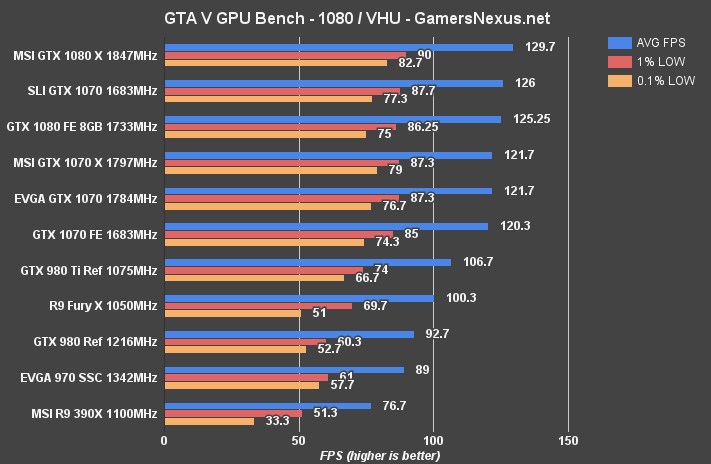
GTA V shows almost identical performance between the EVGA and MSI GTX 1070 cards, with the FE card only marginally behind. At 1080p with Very High and Ultra settings, the EVGA 1070 SC runs at 121.7FPS average and 87.3FPS 1% low. That's identical to what the MSI card is outputting with its 13MHz speed difference. The 0.1% lows are the only location we see a difference, where the MSI card leads by a bit over 2FPS.
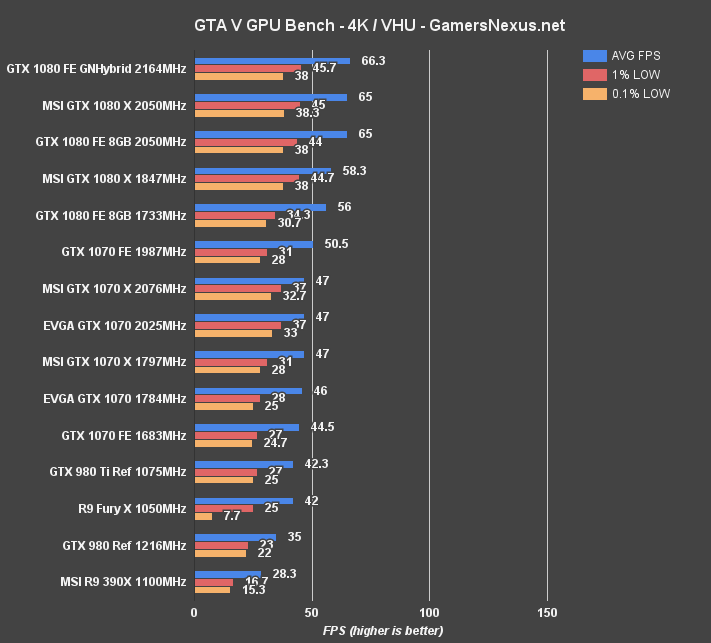
At 4K, similar results are netted – MSI leads by 1FPS average, EVGA leads the 1070 FE by about 1.5FPS. Not very exciting, but somewhat expected.
Metro: Last Light Benchmark – EVGA 1070 SC vs. MSI 1070 Gaming X
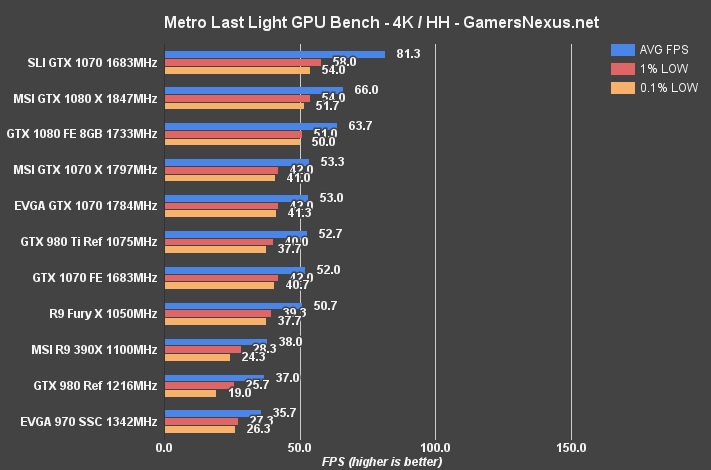
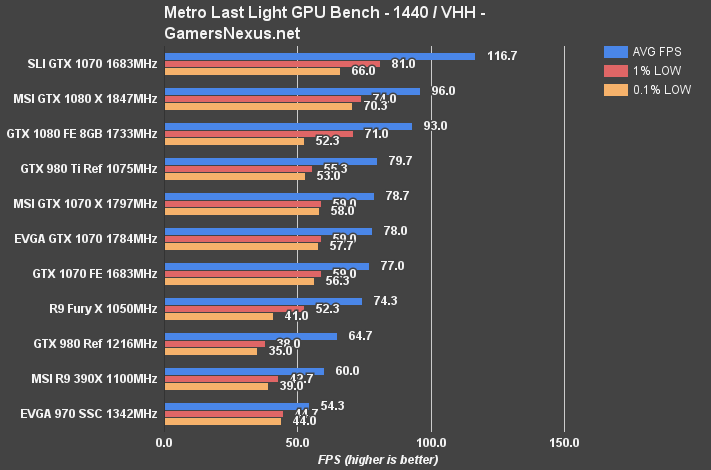
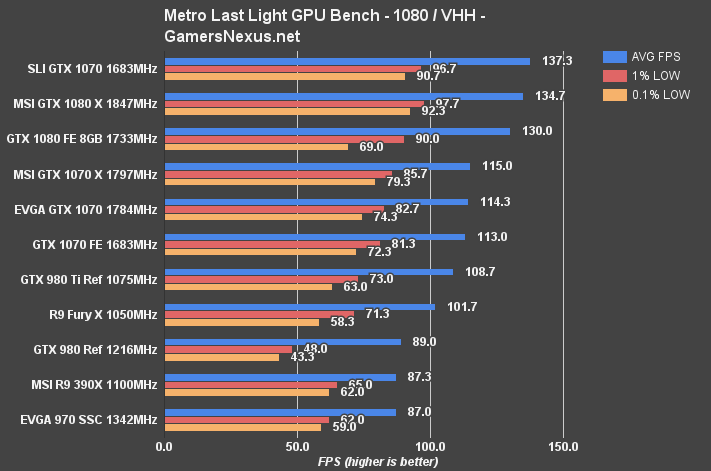
Metro: Last Light positions the GTX 1070s in a neat stack, not even 1FPS (AVG) apart at 4K. We're seeing performance results that mostly match the GTX 1070 FE review posted.
Shadow of Mordor Benchmark – EVGA 1070 SC vs. MSI 1070 Gaming X
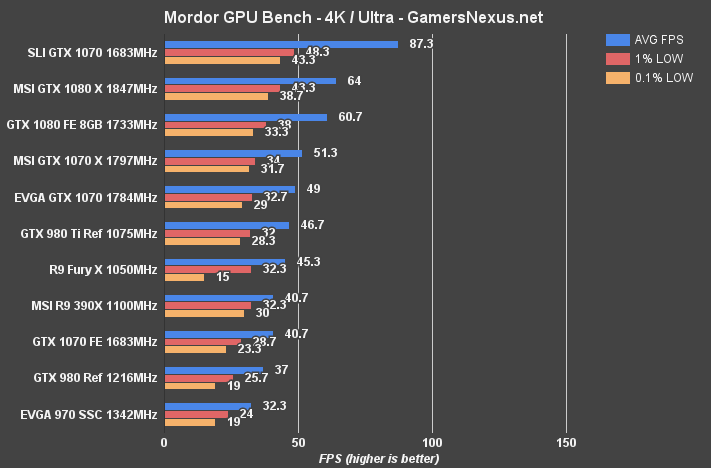
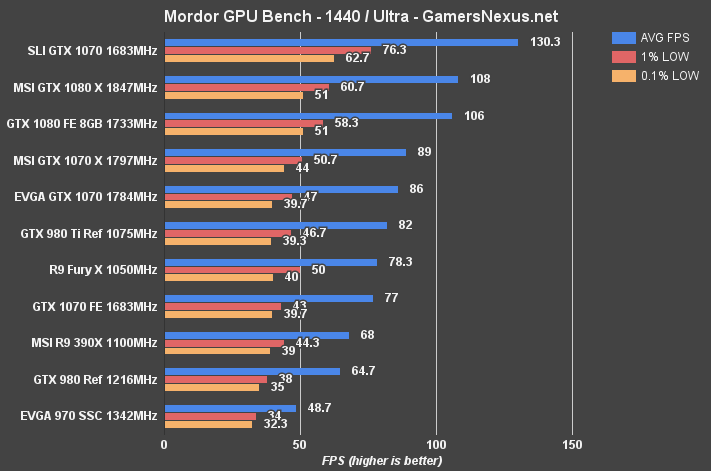
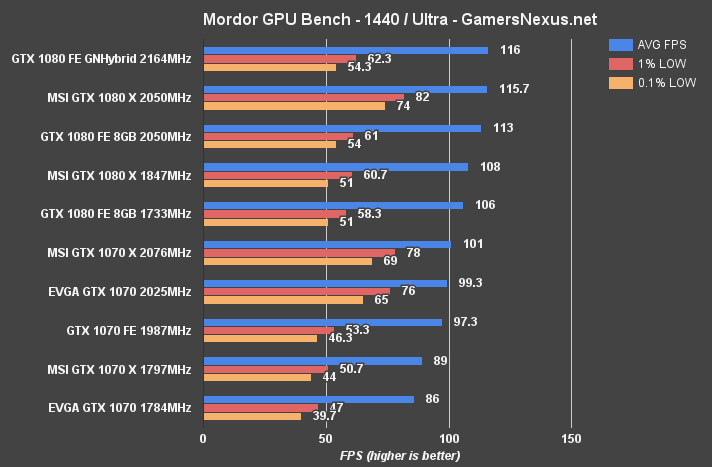
Shadow of Mordor puts the EVGA GTX 1070 at 121.7FPS, just 1FPS behind the MSI 1070 and about 1FPS ahead of the reference 1070. At 1440p, we see the gap marginally widen between the aftermarket cards, which sit at 86FPS for EVGA and 89FPS for MSI. That's a 3.43% difference. The Founders Edition card is at 77FPS, which is actually noticeably slower than the AIB partner versions. In fact, that's 14.46% slower than MSI and 11% slower than EVGA. This result coincides with our original GTX 1070 FE overclocking results, showing that Mordor is sensitive to clock-rate.
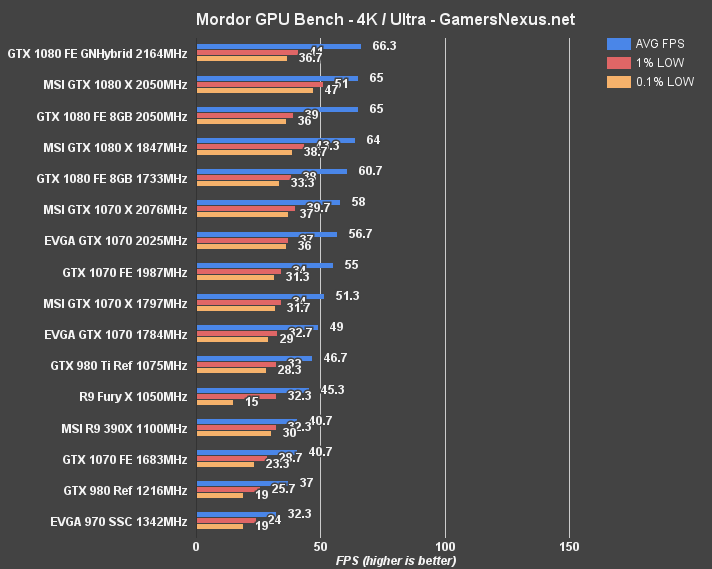
Mordor at 4K shows the EVGA 1070 SC at 49FPS, with MSI at 51.3FPS and the FE card at 40.7FPS – noticeably slower than both. That's an 18.5% lead for EVGA over the FE card.
How to Overclock the GTX 1070
Overclocking has changed with Pascal. It's gotten more advanced – but not more complex. The core functions of overclocking remain the same; we're still using manual stepping and sliders to achieve high, sustained overclocks, but a new auto OC tool (currently only with EVGA Precision) makes limit finding easier. In theory, anyway.
Our OC methodology uses manual stepping. We increment the clock-rate and other settings as the card continues to exhibit stability, stopping only once artifacting or driver crashes appear. At that point, we tweak various other settings (power allowance, vCore, memory clock). You can find all that stepping below.
EVGA GTX 1070 SC Overclocking Results
The below table shows our stepped overclock progression attempts when using the EVGA GTX 1070 SC:
| Core Clock (MHz) | Core Offset (MHz) | Mem CLK (MHz) | Mem Offset (MHz) | Power Target (%) | Voltage | vCore Offset | 5m Test | Endurance |
| 1847 | 0 | 4006 | 0 | 100 | 1.05 | 0 | P | P |
| -- | 100 | 4006 | 0 | 112 | 1.05 | 0 | F | - |
| 1987 | 50 | 4006 | 0 | 112 | 1.05 | 0 | P | - |
| -- | 80 | 4006 | 0 | 112 | 1.05 | 0 | F | - |
| -- | 80 | 4006 | 0 | 112 | 1.062 | 25 | F | - |
| 1987 | 50 | 4006 | 0 | 112 | 25 | P | - | |
| 1987 | 50 | 4404 | 400 | 112 | 25 | P | - | |
| 1999.5 | 75 | 4404 | 400 | 112 | 1.043 | 30 | P | F |
| 2037.5 | 75 | 4404 | 400 | 112 | 1.075 | 60 | P | F |
| 2025 | 50 | 4404 | 400 | 112 | 1.075 | 60 | P | P |
| 2025 | 50 | 4498 | 500 | 112 | 1.075 | 60 | P | P |
| 2025 | 50 | 4608 | 600 | 112 | 1.075 | 60 | P | P |
| 2025 | 50 | 4704 | 700 | 112 | 1.075 | 60 | P | F |
We used EVGA's newest Precision X iteration for overclocking. Voltage was choking our OC at earlier stages in the process, so we eventually increased voltage to its maximum limit on the card – 1.075V. The clock-rate stabilized at ~2025MHz after making this change, with the memory clock pushing 4608MHz (+600MHz offset). EVGA's GTX 1070 SC has a power limit of 112% and uses a single 6-pin power connector, pointing toward a lower theoretical max OC limit than what MSI's dual-header card offers.
2025MHz core / 4608MHz memory is a pretty strong OC for reference power design. The Founders Edition card, plotted further down, output 1987MHz core and 4608MHz memory – so that's the same memory OC, but a slight (~2%) increase in clock-rate.
MSI GTX 1070 SC Overclocking Results
Here's a table with the MSI 1070 OC progression:
| Core Clock (MHz) | Core Offset (MHz) | Mem CLK (MHz) | Mem Offset (MHz) | Power Target (%) | Voltage | vCore Offset | 5m Test | Endurance |
| 1999.5 | 0 | 4050 | 0 | 100 | 1.062 | 0 | P | P |
| 2012 | 50 | 4050 | 0 | 126 | 1.05 | 0 | P | - |
| 2012 | 50 | 4050 | 0 | 126 | 1.05 | 30 | P | - |
| 2012 | 50 | 4050 | 0 | 126 | 1.075 | 60 | P | - |
| 2037.5 | 75 | 4050 | 0 | 126 | 1.075 | 60 | P | - |
| 2062.5 | 100 | 4050 | 0 | 126 | 1.075 | 60 | P | - |
| 2062.5 | 100 | 4455 | 400 | 126 | 1.075 | 60 | P | - |
| 2088 | 125 | 4455 | 400 | 126 | 1.075 | 60 | F | - |
| 2062.5 | 100 | 4455 | 400 | 126 | 1.075 | 60 | P | P |
| 2075.5 | 110 | 4455 | 400 | 126 | 1.075 | 60 | P | P |
| 2075.5 | 110 | 4552 | 500 | 126 | 1.075 | 80 | P | - |
| 2075.5 | 110 | 4658 | 600 | 126 | 1.075 | 80 | P | - |
| 2075.5 | 110 | 4752 | 700 | 126 | 1.075 | 80 | P | - |
| 2075.5 | 110 | 4860 | 800 | 126 | 1.075 | 80 | F Black Flickering | - |
| 2075.5 | 110 | 4799 | 750 | 126 | 1.075 | 80 | P | P |
MSI goes hard with overclocking. The MSI GTX 1070 we've got is pushing 2075.5MHz core and 4799MHz memory. That's an extra 50MHz or so on the core that we're getting, with an additional 200MHz memory overclock. MSI's using a custom PCB with a 10+1-phase power design and an extra 6-pin power header, both of which contribute to this gain. Despite using a custom VBIOS, the card is still stuck at 1.075V vCore.
GTX 1070 Founders Edition Overclocking Results
And here's a look at our GTX 1070 Founders Edition results (from here):
| core clock | core offset | mem clock | mem offset | voltage | voltage offset | power target | 5m test | Endurance |
| 1771 | 0 | 4006 | 0 | 950mv | 0% | 100% | P | - |
| 1936 | 150 | 4151 | 300 | 1000mv | 30% | 112% (max) | P | - |
| 1974 | 200 | 4353 | 350 | 1000 | 30 | 112 | P | - |
| x | 250 | x | 400 | 1000 | 30 | 112 | F | - |
| 1974 | 200 | 4374 | 375 | 1000 | 30 | 112 | P | - |
| x | 250 | x | 375 | x | 30 | 112 | F | - |
| 2015 | 225 | 4374 | 375 | 1000 | 30 | 112 | F | - |
| 1974 | 200 | 4374 | 375 | 1000 | 30 | 112 | P | - |
| 1974 | 200 | 4404 | 400 | 1000 | 30 | 112 | P | - |
| 1974 | 200 | 4455 | 450 | 1000 | 30 | 112 | P | - |
| 1987 | 215 | 4498 | 500 | 1000 | 30 | 112 | P | - |
| 1987 | 215 | 4551 | 550 | 1000 | 30 | 112 | P | - |
| 1987 | 220 | 4551 | 550 | 1000 | 30 | 112 | F | - |
| 1987 | 215 | 4608 | 600 | 1000 | 30 | 112 | P | P |
| 1987 | 215 | 4704 | 700 | 1000 | 30 | 112 | artifacts | - |
On our FE card, we were able to hit the very same 4608MHz memory clock as on the EVGA 1070 SC – which makes sense, since they're basically the same hardware. FE has a slightly lower 1987MHz core clock. Some of that difference can be chalked-up to silicon lottery, some of it can be attributed to the superior cooler on the EVGA card that's helping to stabilize clock-rate over time.
EVGA GTX 1070 SC Overclocked FPS Benchmarks
Results charts below:
FPS results show differences of a couple percentage points in most games (1.8% - 5%, or thereabouts), but some games are more sensitive to clock-rate changes and exhibit greater gains as a result. Shadow of Mordor is one of those games.
EVGA's GTX 1070 SC performs mostly where the reference card falls when it comes to framerates, but there's a lot more to it than that. Noise levels are reduced to effectively 0dB added when idle, which is most of a GPU's usage, and thermals are cut by 14% load. That puts us at 46.89C when under peak load, versus 53.86C for the reference design. Certainly an improvement – and that's at 100MHz faster and at a slightly cheaper price of $440.
MSI does outperform EVGA when it comes to overclocking, but the practical impact of that in non-production scenarios is minimal. You're talking about a frame or two in most games, to put it into perspective. The MSI card does have a better power design, PCB, and cooler, but it's also priced higher than reference at $460.
The EVGA GTX 1070 SC is a huge step-up from the FE card when it comes to the thermal performance. Noise is similar, FPS is similar, and overclocking is pretty close – but the EVGA card, overall, is a much better buy than reference. MSI puts some pressure on EVGA, though does have a disadvantage in the form factor department – it's much taller than an expansion slot – and in its $20 extra cost. The FPS gains are marginal and not noteworthy, but MSI's cooler is better than EVGA's as a result of its taller form factor.
We think the price of these cards should fall more before making a purchase. The EVGA GTX 1070 SC is in a good place to compete, it just feels like it should be closer to the $400 to $420 mark.
Note: At the time of this review, the GTX 1070 and GTX 1080 were still exceptionally hard to find. Price-gouging runs rampant in such times, and so MSRP is often unrealistic until time is provided for the market to cool down. The Pascal chips should become more available in July.
Editorial, Test Lead: Steve “Lelldorianx” Burke
Video Production: Andrew “ColossalCake” Coleman
Sr. Test Tech: Mike “Budekai?” Gaglione
Test Tech: Andie “Draguelian” Burke
Test Tech: Patrick “Mocalcium” Stone
