Coffee Lake returns to the bench for its third review, with benchmarks now focusing on the Intel i3-8350K unlocked 4C/4T CPU. The 8350K (on Amazon here) essentially usurps the market of the previous i5-7600K, but is potentially squelched by CFL brethren i5-8400 CPUs, planting the 8350K in the same price/performance positioning as the 7350K in January.
The 7350K was a good idea, but the wrong launch price. Pricing later fell by ~$30 and made more sense, but the initial ~$180 retail availability was far too high to be worthwhile. Now, with the gap between an i5 and an i3 emphasized with 6C i5 CPUs, those differences become more noteworthy. The i5-8400, ignoring the absence of sensible partner boards, is priced at around the same target as the 8350K (+/-$10). Again, assuming you can find any – and assuming retailers can stick to one price. The R5 CPUs are also more appropriate comparisons against the i3-8350K, despite the i3/R3 naming equivalence. In terms of price, the R3s target a completely different market, and are not an appropriate price-to-price comparison for the 8350K.
As a reminder before getting started, we deployed a new testing methodology with Coffee Lake (our 8700K review), and have not yet fully re-populated our CPU charts.
Overclocking the i3-8350K
We’re still using the Gigabyte Ultra Gaming Z370 motherboard, which isn’t our favorite for overclocking, but gets the job done. Some load-line calibration tuning and volt-frequency tests later, we found the 8350K to be stable at 1.375VCore with a 4.8GHz core, using an AVX offset of 2 for Blender/Prime-type applications. We pushed voltage up to 1.42 and attempted 4.9-5.0GHz, but could not achieve stability.
Test Platform
All of the new (non-legacy) CPU tests were conducted with 3200MHz CL16 memory. A GeIL EVO X kit was used across the board, with some exceptions made for a GSkill RGB Trident Z kit that had been reconfigured to match the GeIL timings. We’ve also moved to a 1080 Ti FTW3 from the 1080 FTW1, making for a stark difference in GPU bottlenecking headroom between the legacy and new tests. Part of this means updating drivers to version 385.69, with Windows now updated to Creator’s Update (game mode disabled) for new CPU benchmarks and reviews. An EVGA SuperNOVA T2 1600W PSU was used as the primary power supply, with a Kraken X62 (max pump + fan speeds) used for the cooler on all benches.
Previous platform and test methodology information can be found in more recent CPU reviews, but we are updating in big ways for CL onward. We’ll detail the test method updates in a separate content piece in the future, as this content is presently being written while the writer is falling asleep for microseconds, hours ahead of embargo.
Civilization VI Turn Time Benchmark – i3-8350K Overclocked vs. R5, i5-8400
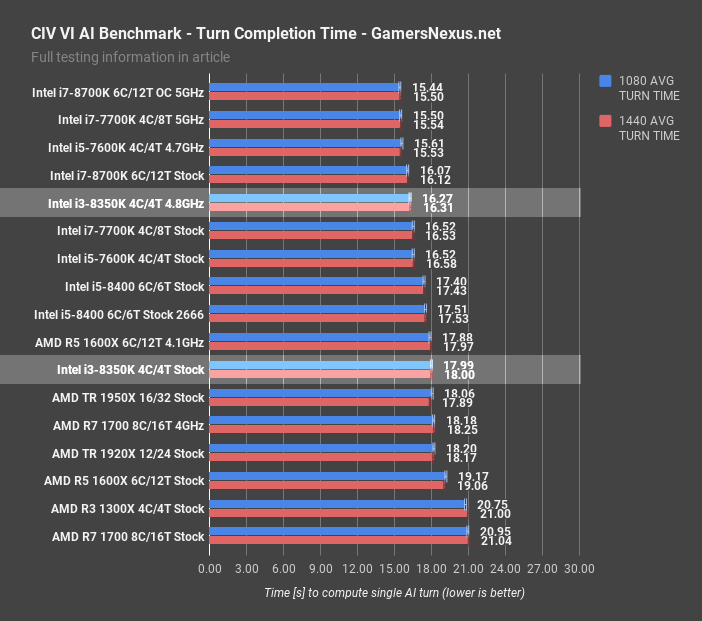
Civilization VI is a frequency-intensive benchmark, and has proven that turn time is less dependent on cores. Note also that the Civ AI benchmark should not be used to test FPS, as worse CPUs will score higher framerates as a result of spending more time on static screens.
Somewhat unsurprisingly, the i3-8350K performs about where the R5 1600X (1600 non-X on Amazon here) at 4.1GHz performs, showing the frequency importance for this title. The 8350K completes each turn in 18 seconds, totaling 90 seconds for all 5 turns. The R5 1600X finishes in 17.9 seconds at 4.1GHz, or 19.2 seconds stock. Intel’s i5-8400 completes the turns in roughly 17.5 seconds, depending on memory frequency.
Overclocking the 8350K to 4.8GHz reduces turn time requirements by 9.6%, tying the CPU with the stock 8700K.
GTA V CPU Benchmark – i3-8350K Stock vs. OC, R5 1600X, i5-8400

GTA V at 1080p and with custom settings plots our i3-8350K at 123FPS AVG, marking it about on-par with the i5-7600K stock CPU and i5-8400 stock CPU. The i3-8350K runs about 13% faster than our fastest Ryzen CPU on this bench, the overclocked 1700, and about 4.5% faster than the i5-8400 with 2666MHz memory. Scaling upward, the stock 7700K leads the 8350K stock by 6.7%, with the overclocked 8350K outperforming the stock 7700K by about 3.6%. This leapfrogs upward, with the overclocked 7700K ultimately winning out, and with the 8700K predictably leading the charts. From top-to-bottom, the 8700K stock CPU leads the 8350K stock CPU by 18.1%. As for R3 CPUs, the R3 1300X at $130 operates at 86FPS AVG, putting it predictably behind the R5 1500X and R7 1700.
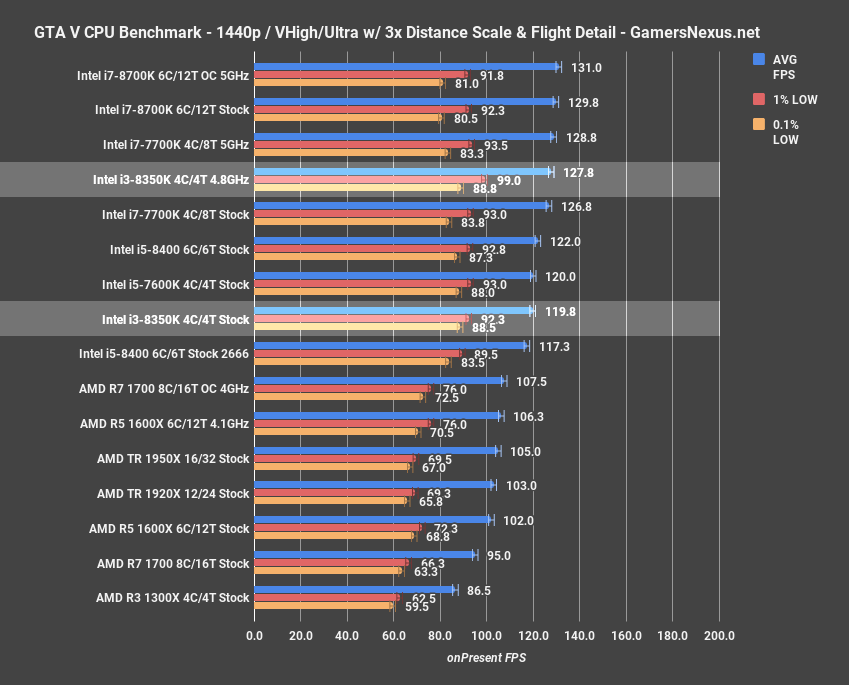
At 1440p, the gap closes as we encounter GPU limitations. The overclocked 8700K now encounters a GPU bottleneck, falling to 131FPS and establishing our new ceiling. The 8350K still lines-up in the same spot in the stack, keeping its positioning right around the stock 7600K or OC performance at between the 7700K and 5GHz 7700K.
Total Warhammer CPU Benchmark – i3-8350K vs. R3, R5, i5, i7

Total Warhammer at 1080p/High lands the stock 8350K at 145FPS AVG, right between the stock 7600K and overclocked R5 1600X at 4.1GHz. The 8400 performs about 3.3% ahead of the stock 8350K when the 8400 runs slower memory, or 7.3% ahead when at the same memory speed.
Overclocking the 8350K to 4.8GHz puts it about on-par with the 8400 using 3200MHz memory, and behind the stock 7700K with its 8 threads. The top-to-bottom difference between the 8700K and 8350K is about 22% leadership for the i7.
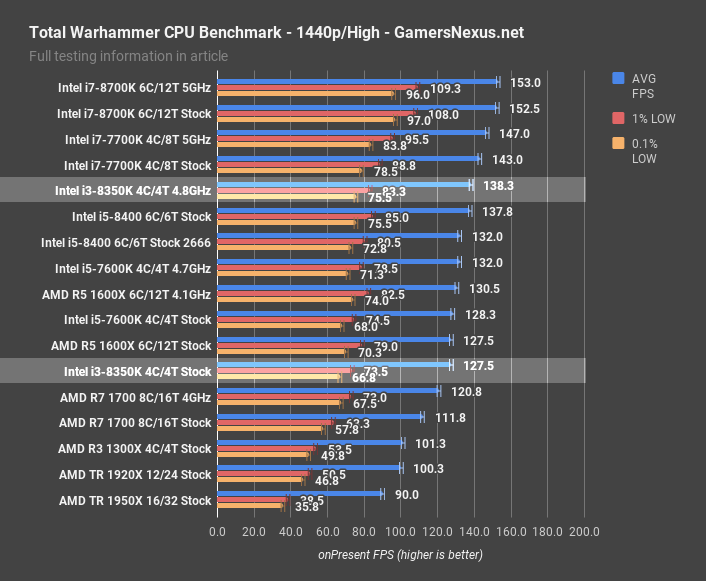
At 1440p, the 8350K stock CPU operates at 128FPS AVG, planting it ahead of the overclocked R7 1700 and about tied with the R5 1600X. Frametime performance at the low-end is also roughly equal, and we are again about tied with the 7600K.
The 8400 carries a strong lead with both memory configurations, but loses that lead once we overclock the 8350K to 4.8GHz.
Destiny 2 CPU Benchmark – i3-8350K
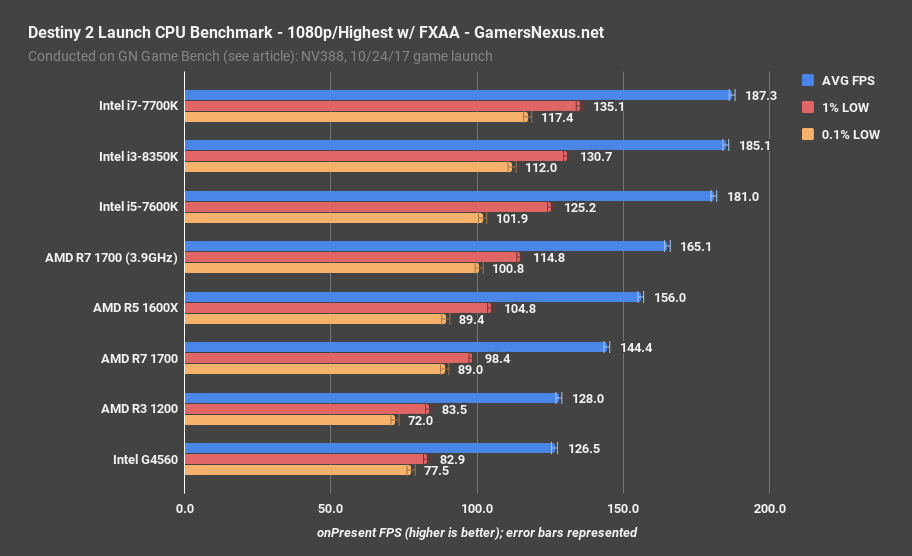
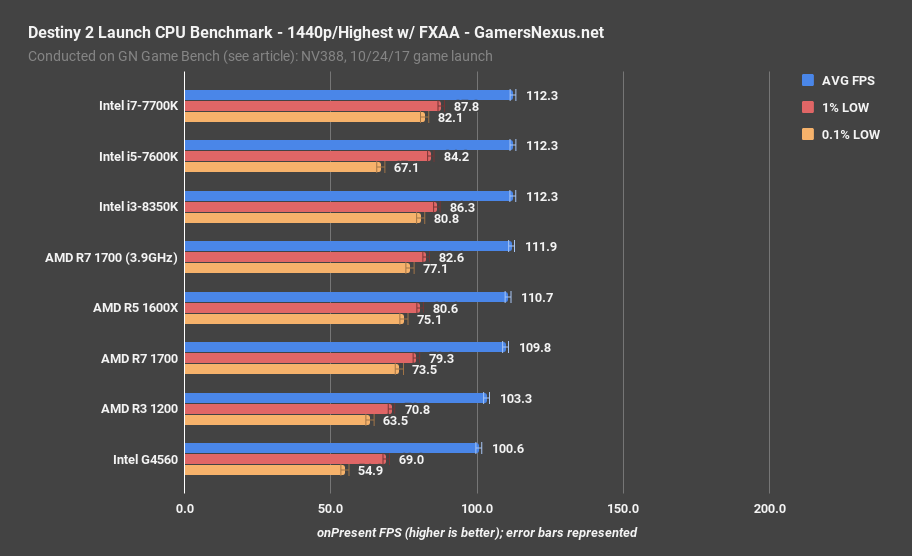
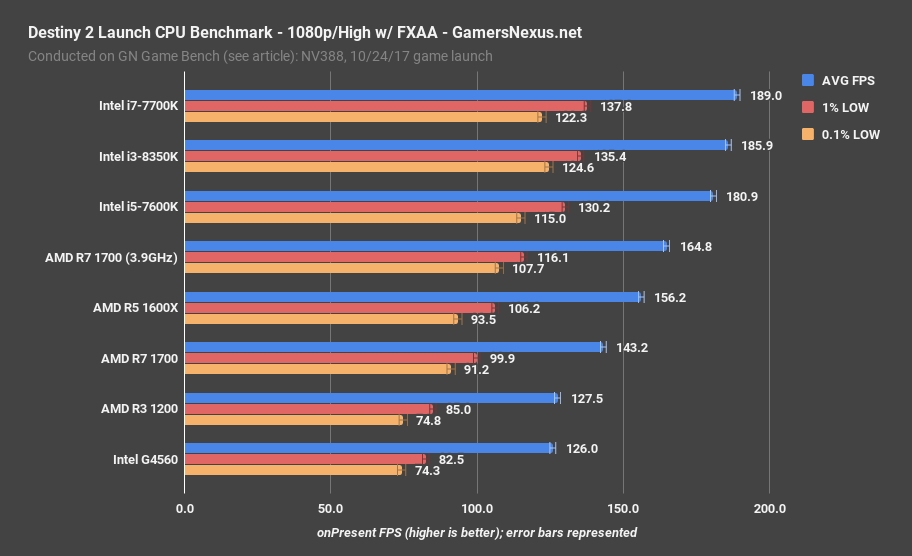
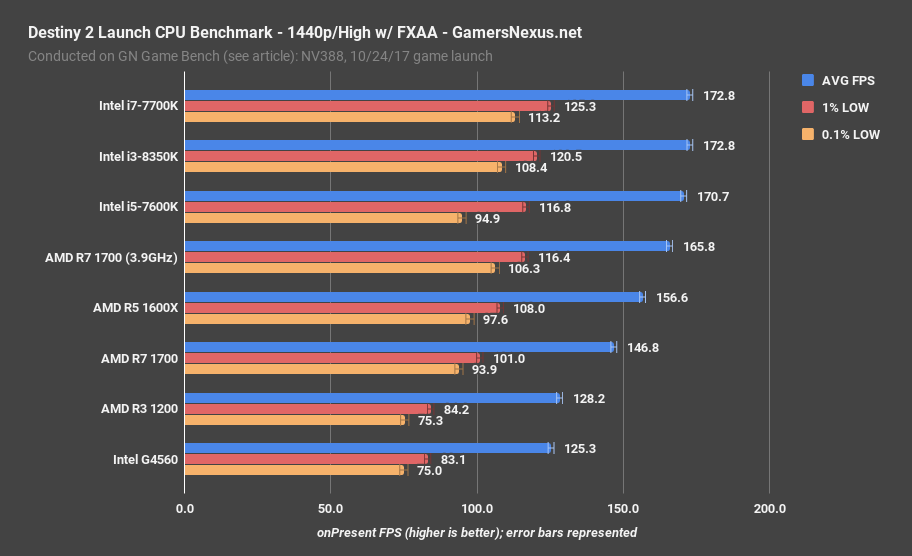
These are from our Destiny 2 CPU benchmark. Learn more about these results over here.
Watch Dogs 2 CPU Benchmark – i3-8350K vs. R5, i7, R7
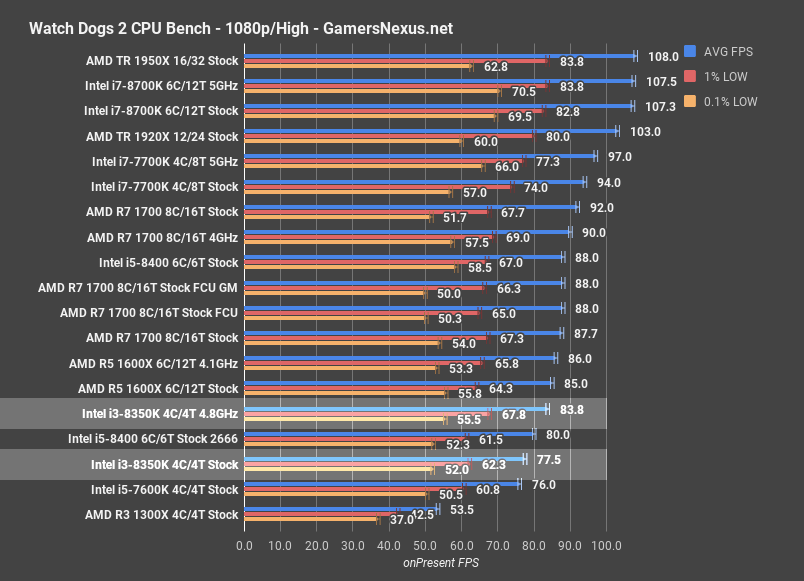
Watch Dogs 2 tends to actually like threads, unlike most games on the market. This game positions the overclocked 8350K at 84FPS AVG, with lows at 68FPS 1% and 56FPS 0.1% lows. The stock 1600X is roughly tied with the overclocked 8350K, carrying a lead of 2.7% when both are overclocked. As for the stock 8350K, that’s left behind with the 7600K stock CPU, demonstrating the core and thread advantage in Watch Dogs 2.
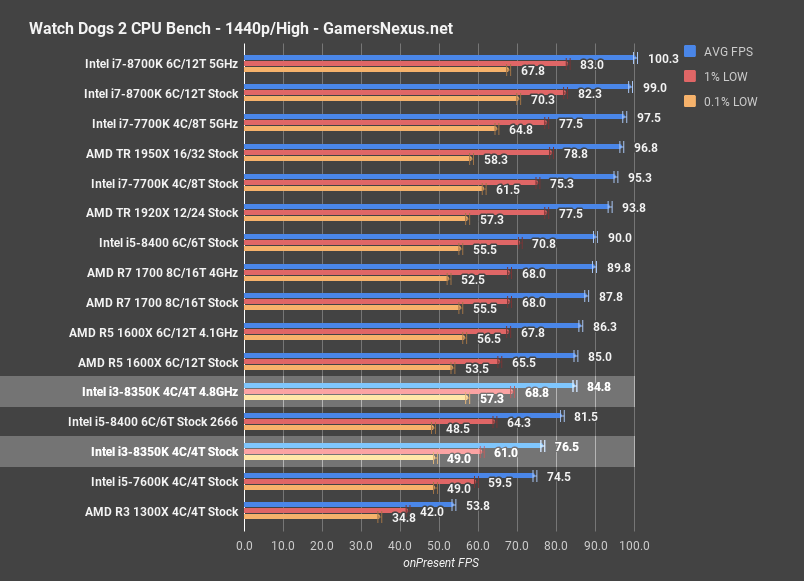
1440p keeps mostly the same scale, within test variance and error, and shows that the 8350K remains about tied with the previous 7600K.
Ashes of the Singularity: Escalation – i3-8350K Benchmark
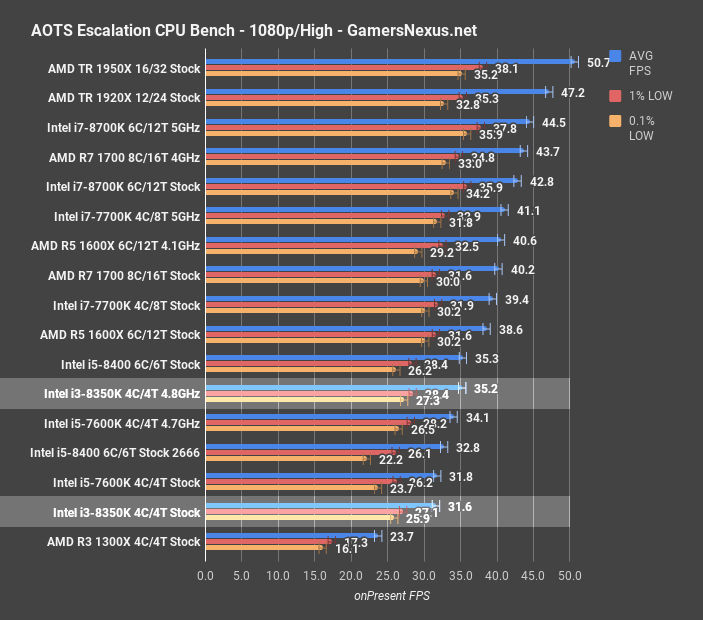
Ashes of the Singularity is our final game, and also one that is thread-limited. Ashes plots the 8350K at the very bottom of the list, roughly tied with the 7600K, and makes for an unimpressive display. The R5 1600X stock CPU is 22% ahead of the stock 8350K CPU, a difference which squarely lands on the thread advantage. The i3-8350K doesn’t keep up quite as well in this test.
Continue to the next page for power consumption.
Blender Power Consumption – i3-8350K Test
As a reminder, our power testing is done at the EPS12V cables rather than at the wall, so these numbers are basically CPU power consumption numbers, as measured entering into the board.
The stock i3-8350K consumes about 47W when rendering our Blender scene, putting it within error margins of the overclocked R3 1200 CPU at 3.9GHz, and watts away from the 1300X stock CPU. This also plants the 8350K right around where the previous 7350K was when at 5GHz, but note that the difference in motherboards means we’re not taking VRM loss into account.
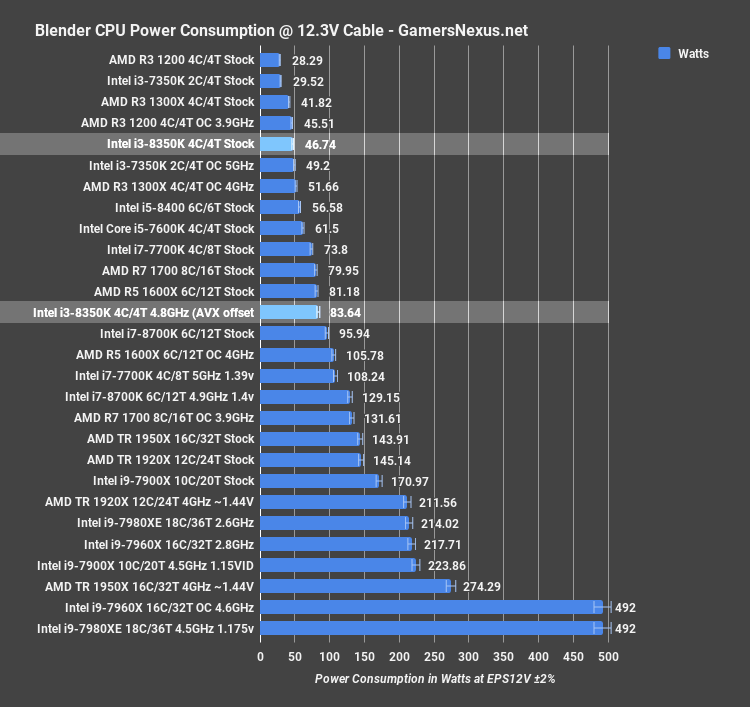
Overclocking the 8350K to 4.8GHz, though using an AVX offset of 2 for Blender, we land at 84W with our 1.375VCore. This puts us near the stock 1600X, and not too distant from the 96W of the stock 8700K.
FireStrike Power Consumption

3DMark’s FireStrike measures the 8350K at 34W, or a 27% higher power consumption than where we measured the R3 1200, with the R3 1300X at 11% higher than the stock 8350K. Overclocking the 8350K to 4.8GHz at 1.375V puts us up to 1600X stock levels of power consumption, and not far from the 8700K stock CPU.
Total War Power Consumption
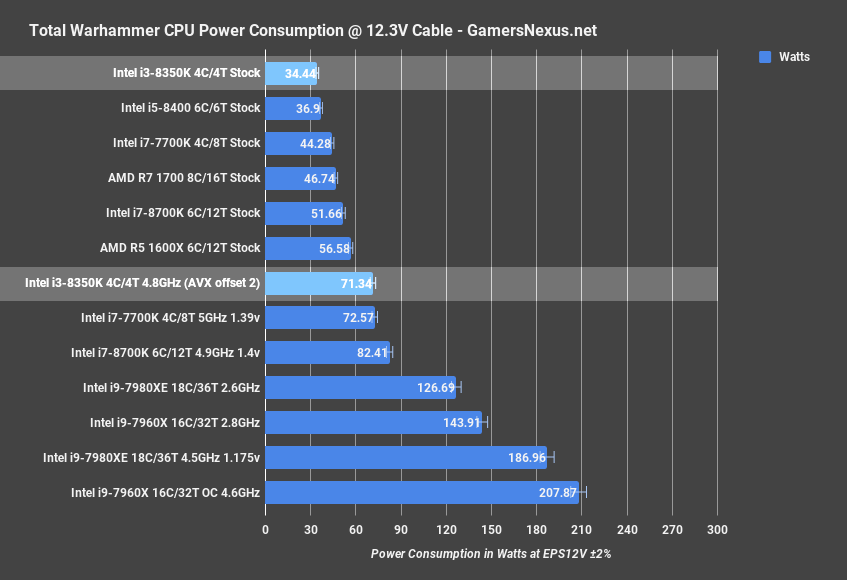
Using Total War as a gaming workload, for which we haven’t yet added the R3 CPUs, the i3-8350K consumes about 34W stock, or 71.3W when overclocked. Respectively, that puts us either below everything or between the AMD R5 1600X Stock and i7-7700K at 1.39VCore, with the overclocked 8700K reasonably more power hungry at 82W.
Prime95 29.2 8K FFT Power Benchmark
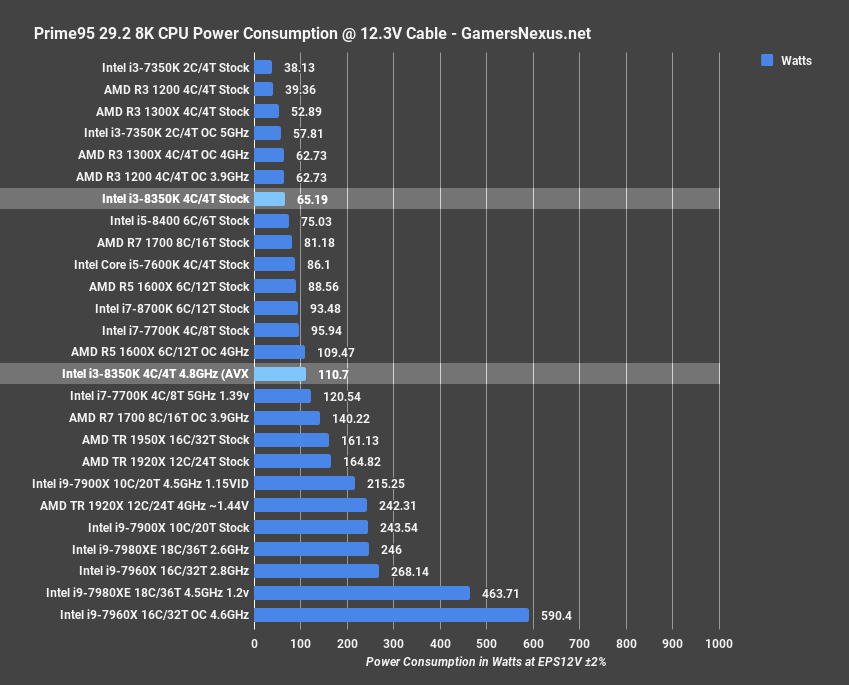
Prime95 29.2 with 8K FFTs provides a taxing AVX workload, creating a range of 38W to 590W, depending on voltage and CPU. The i3-8350K predictably falls closer to the low-end, at 65W stock, which lands it as nearby the overclocked R3 CPUs and below the i5-8400 or stock R5 CPUs. Overclocking demands 111W, keeping the same stack we saw earlier.
Continue to the next page for production and synthetic tests.
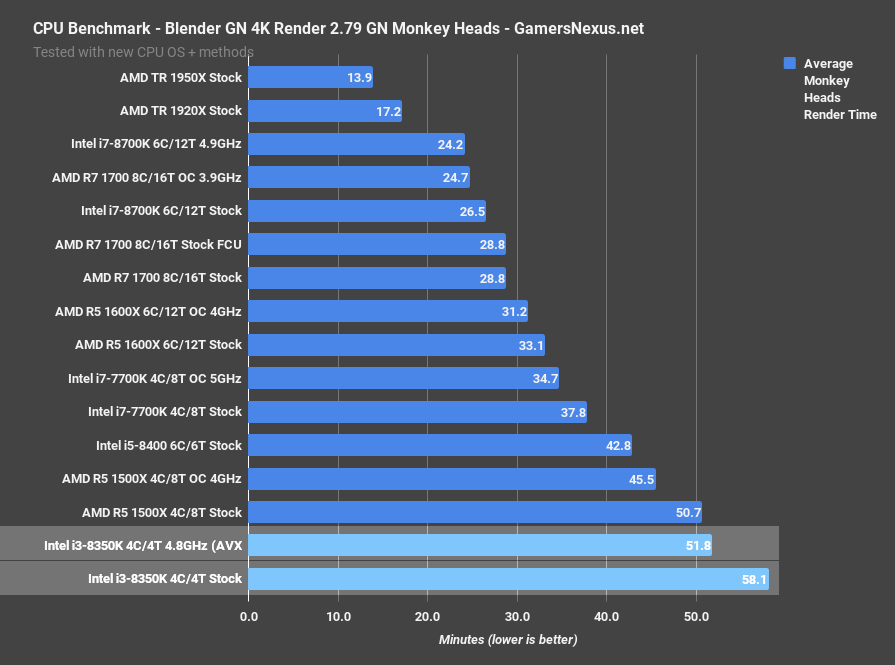
Blender Benchmarks - i3-8350K
Our Blender renders now use three different scenes, two of which were created in-house and one of which was heavily modified in-house.
Starting with our monkey head scene on Blender 2.79, the $170 to $200 i3-8350K completes dead-last, at 58 minutes to render the frame. The R5 1500X stock CPU, priced at $170, finishes with a 13% time reduction, though overclocking the i3-8350K to 4.6GHz mostly catches it up. That said, we’ve never really recommended the 1500X, anyway, and would rather point toward the 1600 or 1600X for a budget rendering CPU. The 1600X stock CPU completes the task in 33 minutes, a 43% time requirement reduction. The price isn’t too dissimilar from a 1600 and 8350K, and overclocking can match it to the 1600X. Clearly, if budget rendering is important to you, the R5s win easily. Just decide whether rendering performance is more important than gaming, then make a decision from there.
![]()
As for the other scenes, the GN logo render puts the 8350K at 71 minutes stock, or 62 minutes when overclocked. The R5 1600X finishes this test in about 35-38 minutes. No contest.
3DMark TimeSpy – i3-8350K Stock vs. Overclocked
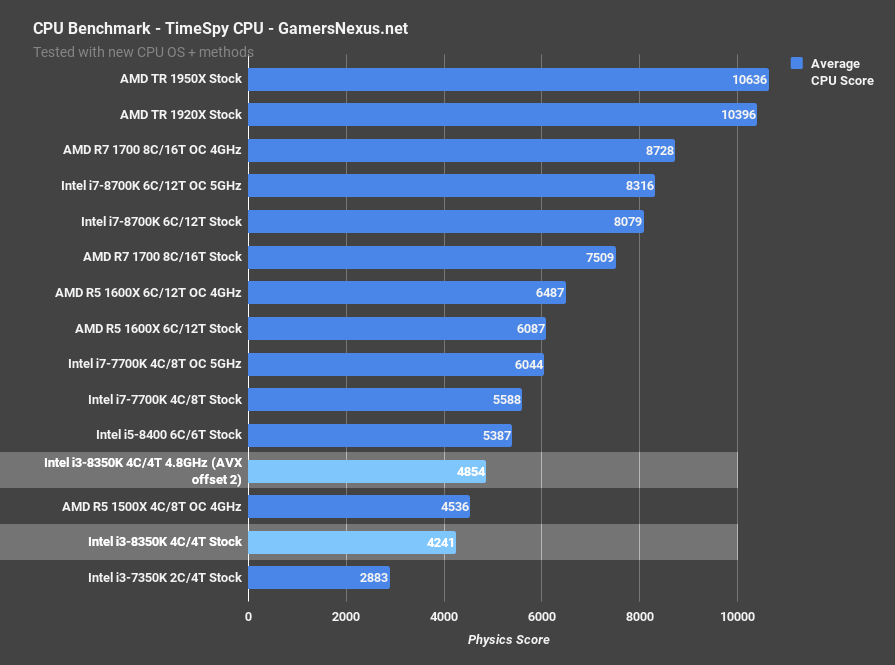
Timespy is next. We have the i3-8350K stock CPU scoring 4241 points on the CPU test, translating to 14.25FPS for the physics benchmark. This outperforms the 7350K notably, and performs below the 1500X by 6.5%. Overclocking the 8350K gets it to a deficit of 9.9% against the locked i5-8400, which has an additional two cores that significantly help. This chart alone makes it a hard sell for the 8350K, as the i5-8400 functionally costs about the same, and cost is lower if you’re looking at this in the future, where non-Z motherboards theoretically exist.
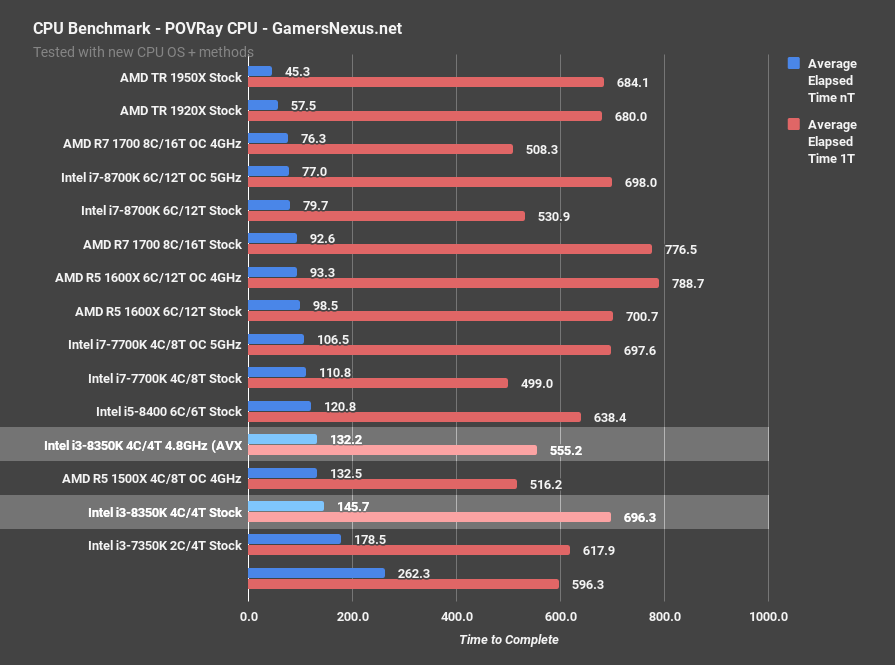
Some Other Synthetic Results

Conclusion: i3-8350K vs. i5-8400, R5 1600
The i3-8350K is more of a direct competitor to the R5 series than the R3 series, despite numerical prefix equivalence. At $170 to $200, depending on where and when prices are checked, the 8350K stands comparatively against the 1500X and 1600, or perhaps 1600X, although the latter two are functionally identically outside of stock clocks. Clearly, as the charts show, anyone doing an actually meaningful amount of production work – we’re talking 20, 30%+ of the system’s time – would be far better served with either an i5-8400 or R5 1600(X). The 8350K’s frequency gains cannot make up for lost cores/threads in applications like Blender.
That said, there are times when the frequency matters more, and those times tend to still be games. This is why we see the overclocked 8350K occasionally match the stock 8700K in performance.
Even still, some games make it difficult to defend the 8350K over Intel’s own i5-8400 – it just depends on whether those applications like frequency or cores. Either way, like the 7350K’s launch price (which did later come down by $30), the 8350K is too expensive for its own good. We want to encourage Intel to continue with K-SKU i3 (and, ideally, Pentium) components, but the prices have to make sense. Even if we ignore AMD and just look at Intel’s own stack, the i3-8350K only really makes sense in exceedingly rare circumstances. Given the choice, we’d opt-out, generally speaking, and instead favor the i5-8400 or R5 1600 (and refer to the charts for help in that decision). The i5-8400’s presently required bundling with Z370 motherboards unfortunately nukes much of its price-performance potential, granted, and we won’t see B/H boards until 1Q18. Refer to the i5-8400 review for more information on that product.
Editorial, Test Lead: Steve Burke
Testing: Patrick Lathan
Video: Andrew Coleman