NVIDIA's Secret GPU: TU106-400A vs. TU106-400 Benchmark (2070 XC Ultra Review)
Posted on
EVGA’s RTX 2070 XC Ultra gave us an opportunity to compare the differences between NVIDIA’s varied RTX 2070 SKUs, including a low-end TU106-400 and a higher-end TU106-400A. The difference between these, we’ve learned, is one of pre-selection for ability to attain higher clocks. The XC Ultra runs significantly higher under Boost behavior than the 2070 Black does, which means that there’s now more to consider in the $70 price gap between the cards than just the cooler. This appears to be one of the tools available to board partners so that they can reach the $500 MSRP floor, but there is a performance cost as a result. With Pascal, the performance cost effectively boiled-down to one predicated on thermal and power headroom, but not necessarily chip quality. Turing is different, and chip quality is now a potential limiter.
In this review of the EVGA RTX 2070 XC Ultra, we’ll also be discussing performance variability between the two 2070 GPU SKUs. These theories should extrapolate out to other NVIDIA cards with these sub-GPU options. Note that we are just going to focus on the 2070s today. If you want to see how we compare the 2070’s value versus Vega or Pascal, check our 2070 review and Vega 56 power mod content pieces.
The real discussion is going to be in overclocking and thermals, as gaming performance typically isn’t too varied intra-GPU. That said, the GPU changes between these two (technically), so that’ll make for an interesting data point.
Overclocking Results – TU106-400A vs. TU106-400
| EVGA RTX 2070 XC Ultra Overclock Stepping | TimeSpy Extreme Stress Test | GamersNexus.net | ||||||||||
| Peak Frequency | AVG Frequency | Core Offset | Core Voltage | Memory Frequency | Memory Offset | Power | Fan Speed | Active Temp | Pass/Fail | Perfcap |
| 1950 | 1910 | 0 | 1000 | 7001 | 0 | 100 | 1330 | 49 | P | PWR |
| 1950 | 1920 | 0 | 1037 | 7001 | 0 | 130 | 1457 | 60 | P | PWR/VRel |
| 2010 | 2010 | 100 | 1037 | 7001 | 0 | 130 | 1574 | 63 | P | PWR/VRel |
| 2040 | 2040 | 125 | 1037 | 7001 | 0 | 130 | 1582 | 63 | P | PWR/VRel |
| 2085 | N/A | 150 | 1037 | 7001 | 0 | 130 | 1582 | N/A | F - 3DM Crash | Unstable |
| Fail - Application Crash | ||||||||||
| 2055 | 2040 | 125 | 1037 | 7981 | 980 | 130 | 1600 | 65 | P | PWR/VRel |
| 2055 | 2040 | 125 | 1037 | 8021 | 1020 | 130 | 1636 | 65 | P | PWR/VRel |
| 2055 | 2040 | 125 | 1037 | 9021 | 1120 | 130 | 1636 | 65 | F - Artifacts | PWR/VRel |
| 2055 | 2040 | 125 | 1037 | 8081 | 1080 | 130 | 1636 | 65 | P | PWR/VRel |
| 2055 | 2055 | 125 | 1037 | 8081 | 1080 | 130 | 3000 | 55 | P | PWR/VRel |
Let’s start with some overclock stepping charts. The 2070 XC Ultra gets a 130% power target and has a PCB and VRM that are basically from the 2080 FE, whereas the 2070 Black uses a 2070 FE PCB VRM. We have an analysis of both already on the channel.
The XC Ultra’s higher power target helps in overclocking. With no offset at all, our stock performance for the XC Ultra landed us at 1950MHz peak, or 1910MHz average once heated up. The performance cap was instantly power, where it remained capped until our next step in the chart. After increasing power target, we sustained 1920MHz average without any core offsets. We eventually ran up to a 125MHz core offset, still with 0MHz memory offset, and found stability at about 2040MHz when heated up and left to auto fan speeds of 1580RPM. The new limit was Vrel and Power. Memory overclocked very well on this platform. We found stability at 1080MHz offset for over 16Gbps throughput. The core clock averaged 2040MHz when left to auto fan speeds, or 2055MHz when below 60 degrees Celsius as a result of the boosting algorithm.
| EVGA RTX 2070 Overclock Stepping | TimeSpy Extreme Stress Test | GamersNexus.net | ||||||||||
| Peak Frequency | AVG Frequency | Core Offset | Core Voltage | Memory Frequency | Memory Offset | Power | Fan Speed | Active Temp | Pass/Fail | Perfcap |
| 1800 | 1730 | 0 | 981 | 7001 | 0 | 100 | 1816 | 61 | P | PWR |
| 1830 | 1785 | 0 | 1060 | 7001 | 0 | 114 | 1976 | 63 | P | PWR |
| 1890 | 1860 | 100 | 1060 | 7001 | 0 | 114 | 2017 | 63 | P | PWR |
| 1935 | 1910 | 150 | 1060 | 7001 | 0 | 114 | 2048 | 63 | P | PWR |
| 1950 | 1925 | 175 | 1060 | 7001 | 0 | 114 | 2053 | 63 | P | PWR |
| 1995 | 1950 | 200 | 1060 | 7001 | 0 | 114 | 2053 | 63 | P | PWR |
| 2010 | 1990 | 225 | 1060 | 7001 | 0 | 114 | 2053 | 63 | F - Application Stall | PWR |
| Fail - Application Stall | ||||||||||
| 1995 | 1935 | 200 | 1060 | 7981 | 980 | 114 | 2000 | 63 | P | PWR |
| 1995 | 1935 | 200 | 1060 | N/A | 1030 | 114 | 2000 | 63 | F | PWR |
| Fail - Application Stall | ||||||||||
| 1995 | 1970 | 200 | 1060 | 7981 | 980 | 114 | 3800 | 41 | P | PWR |
| 1995 | 1950 | 200 | 1060 | 7981 | 980 | 114 | 3800 | 53 | P | PWR |
Let’s bring the 2070 Black on screen. This chart shows that our maximum overclock was 1950MHz average when at maximum fan speeds, or about 1935MHz when left to auto fan speeds and 63 degrees. The maximum memory overclock was about 980MHz offset. The core is significantly faster on the XC Ultra, and that’s a result of the higher power limit. An extra 100MHz is noticeable in gaming. Note also that the maximum fan speed is 3800RPM on the 2070 Black, while it’s 3000 on the 2070 XC Ultra.
Boost Scalability on TU106-400A vs. -400
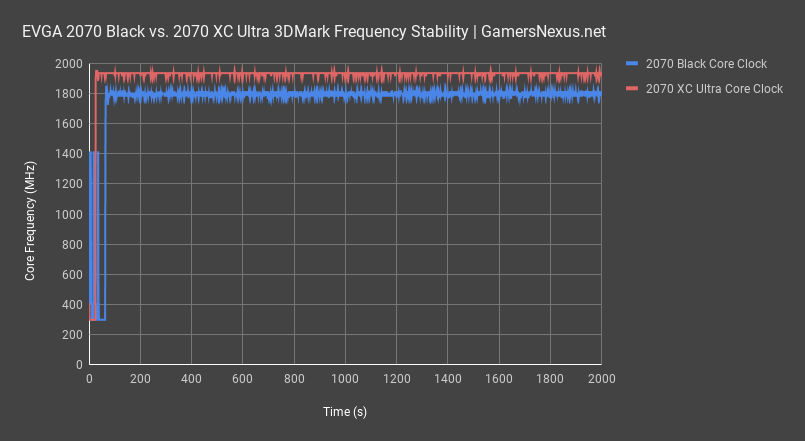
Here’s a core frequency over time plot for 3DMark Firestrike – Extreme, set rendering the same frame on loop for about 30 minutes. The XC Ultra averages about 1935MHz for the entirety of the test, whereas the 2070 Black experiences clock decay from about 1815MHz down to 1785MHz. The average frequency bounces between 1785MHz and 1800MHz for the 2070 Black. This is a significant difference for out-of-the-box frequencies, and indicates that performance advantage resultant of the better binned GPUs. NVIDIA sells these higher binned parts to board partners for a premium, and it appears that the mixture of the new silicon binning procedure and the higher native power target allow for a large frequency advantage. Note that we haven’t done any overclocking here, this is straight auto performance. The clock deltas primarily stem from NVIDIA’s binning of those better-grade parts at the premium paid.
Noise-Normalized GPU Thermals at 40dBA (2070 Black vs. 2070 XC Ultra)
What we really need to know is the noise-normalized thermal performance, as that’ll equalize our primary variable and allow us to see if that huge heatsinks actually matters.
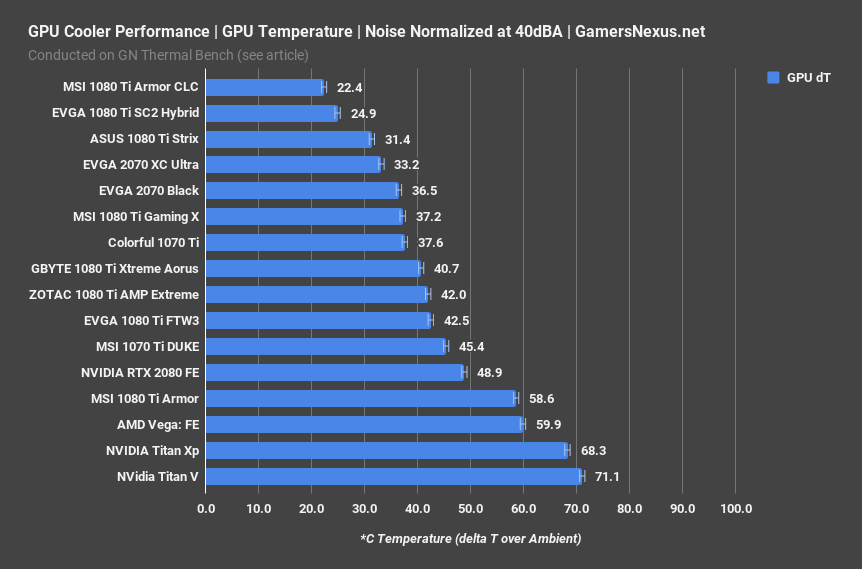
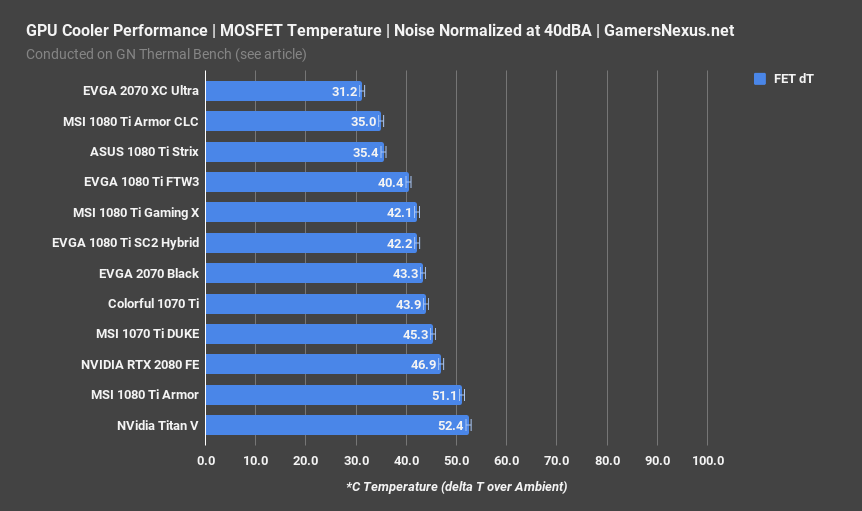
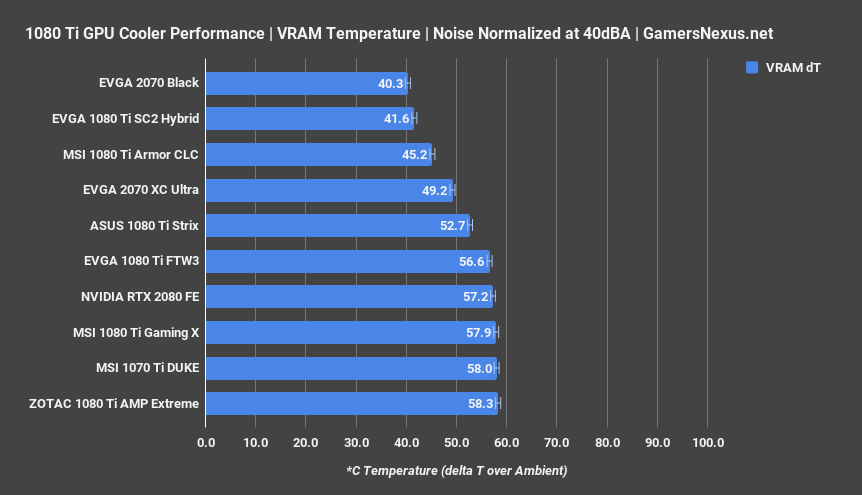
Even noise-normalized thermals aren’t perfectly comparable between the 2070 Black and 2070 XC Ultra, as the XC Ultra runs at a significantly higher frequency and is pre-sorted silicon. Regardless, despite its higher frequency, the XC Ultra manages to run lower 40dBA noise-normalized thermals than the 2070 Black, with a 33 degree Celsius over ambient GPU temperature, versus 37 on the 2070 Black. This puts it as similar to some of the 1070 Ti cards we tested, like the Colorful card. The MOSFET temperature is significantly lower, at 31 degrees over ambient versus 43 degrees over ambient on the lower-end card. GDDR6 temperature is warmer on the XC Ultra, likely a result of the proximity of the memory module to the hotter components of the VRM.
Backplate vs. No Backplate Thermals
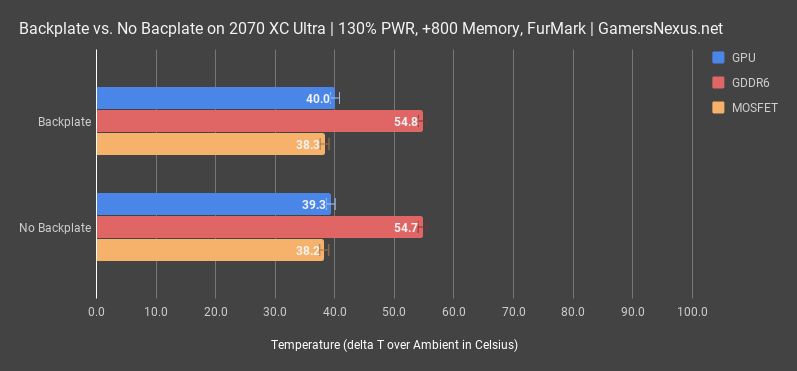
We also did one feature test without a backplate. At 68% fan RPM (fixed, unchanging) and with an overclock at maximum power offset, we did not see any meaningful change in the presence of the backplate for the GDDR6, VRM, or GPU temperatures. It certainly does something as it does get hot, which is what you want in a backplate, but we couldn’t measure the differences on the parts we probed. You might see more difference with the presence of active cooling over the plate, or perhaps in a more thermally constrained environment (like a hot case with turbulent airflow). Either way, although it didn’t impact these results, it doesn’t trap heat and doesn’t make things worse. That’s good, and that’s mostly what we want. Not all video cards can say that. The plate clearly conducts heat and move it elsewhere, but probably needs some active cooling to really perform.
RTX 2070 XC Ultra Acoustics & Noise Levels
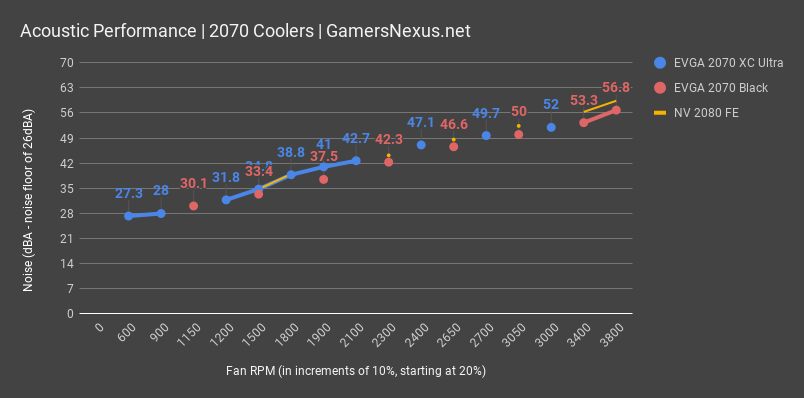
The next test looks at acoustic performance between the two. For this, we’re measuring noise levels at a 20” distance with a noise floor of about 26.7 decibels. The only active component is the GPU.
Strictly comparing the (quote) “low-end” $500 2070 and the $550 XC Ultra model, the first reminder is that fan noise caps at 3000RPM for the XC Ultra and 3800 for the Black edition. This is where the larger cooler and better PCB on the Ultra allow it to spin slower. The XC Ultra and 2070 Black mostly increase in-step with one another and are within reasonable variance for fan quality differences. The XC Ultra typically spins at a lower RPM when left to auto, as both seem to stick to around 63-64 degrees. There isn’t much difference between these cards when comparing them at a given RPM – but the XC Ultra cools better at a given RPM, as we saw in our thermal and clock data from earlier.
RTX 2070 Game Benchmarks - Far Cry 5
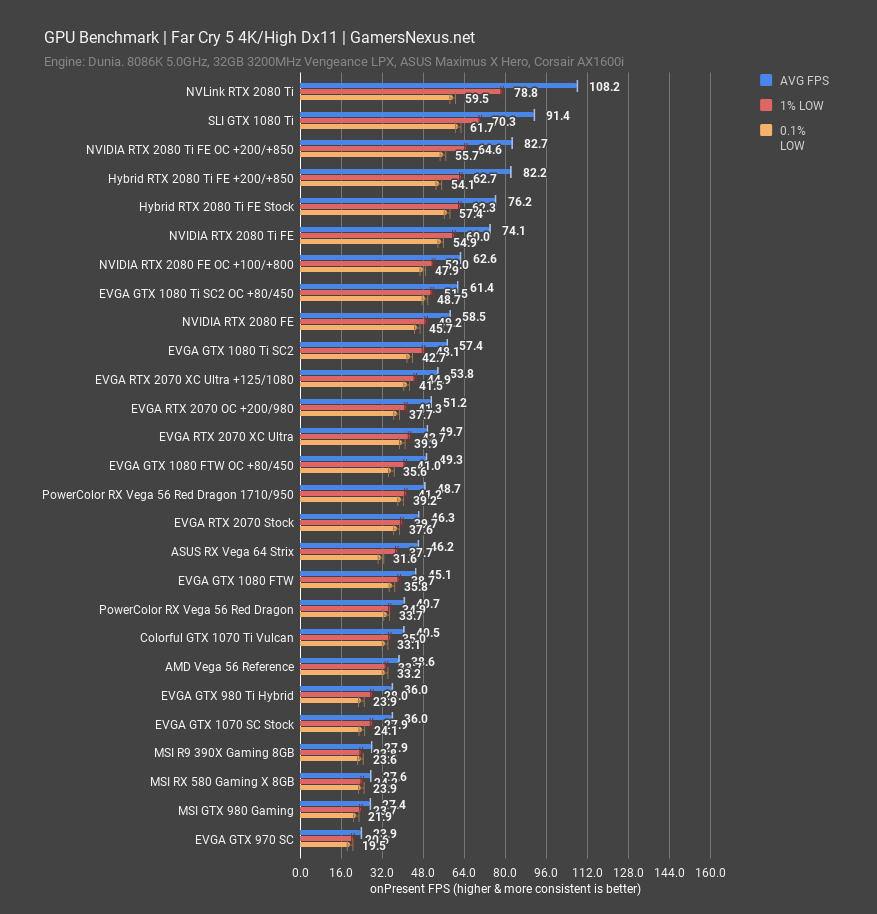
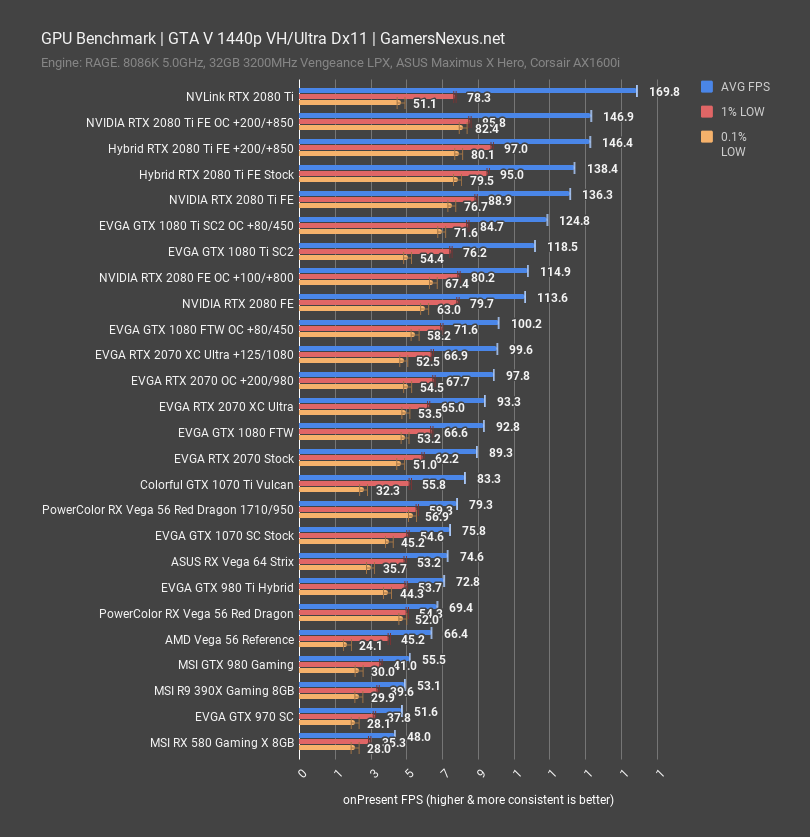
Far Cry 5 at 4K ranks the EVGA RTX 2070 XC Ultra at 49.7FPS AVG when fully stock, indicating that it is boosting higher than the plain EVGA 2070 card and its 46FPS AVG. This is one part cooling and one part power limitations, as you’ll see in our thermal and overclocking sections. Overclocking the 2070 Black with a +200/+980 offset illustrates just how much more the XC Ultra is boosting out of the box, as its offset maxed at +125 on the core due to a higher stock clock. When both the EVGA RTX 2070s are overclocked, we ended up at around 51FPS AVG on the 2070 Black and 54FPS AVG on the 2070 XC Ultra. They mostly equalize in gaming.
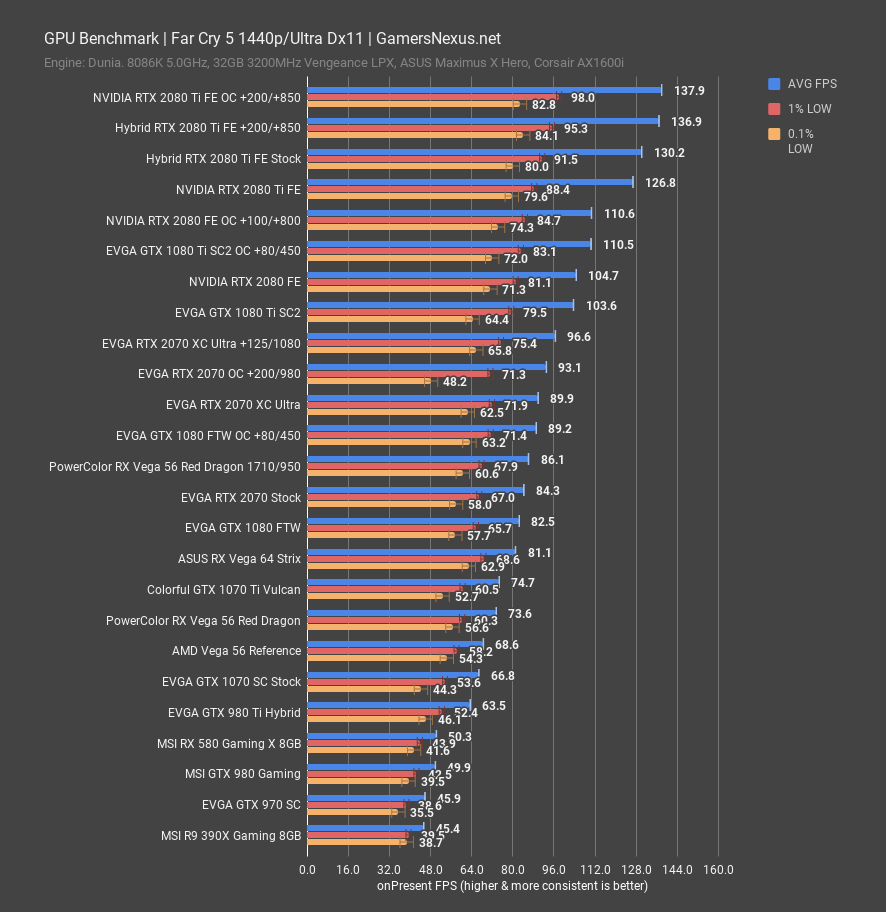
At 1440p, the EVGA RTX 2070 Black manages 84FPS AVG, with the XC Ultra at 90FPS AVG when stock. The out-of-box performance uplift is about 6.7% on the XC Ultra. Overclocking both cards allows the XC Ultra to retain its lead as a result of landing higher on the volt-frequency curve from lower temperatures, though the gap closes to a difference of 3FPS – and that’s between 97FPS and 93FPS, so they are basically indistinguishable in framerate when overclocked. Noise and thermals are a different aspect and were already discussed.
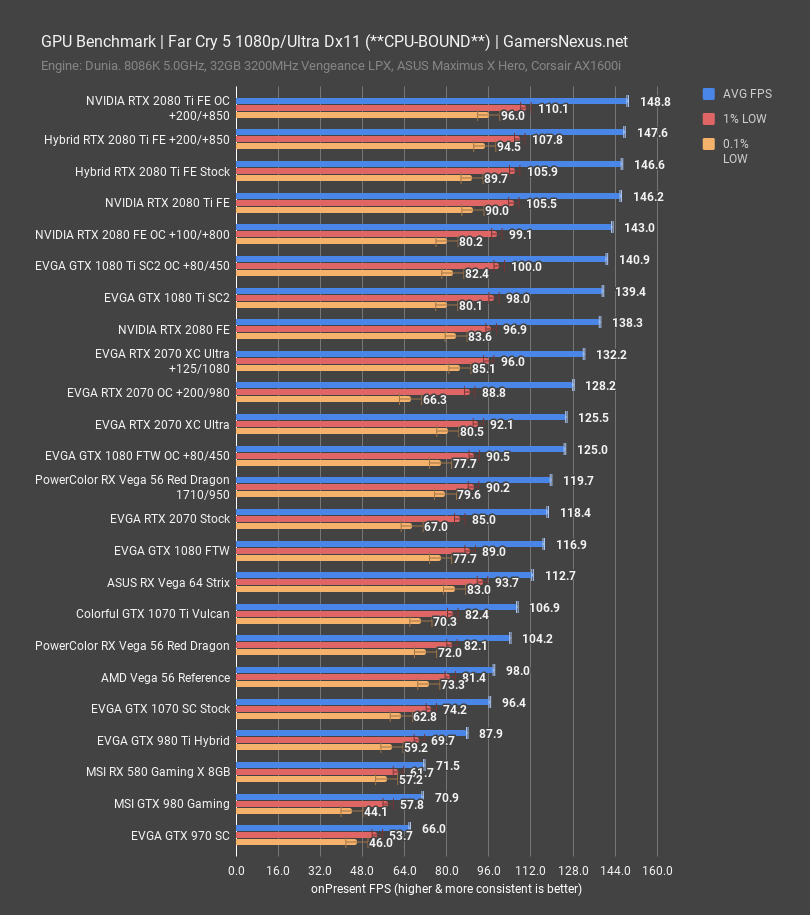
Finally, we’ll flash 1080p up for a moment. The differences between the stock 2070’s 118FPS AVG and the XC Ultra’s 126FPS AVG is about 6%, once again, and overclocking gets the two reasonably close together. Low frametimes are stronger on the XC Ultra than on the stock card, as seen in the 67FPS 0.1% versus 81FPS 0.1% on the XC Ultra. This is due to boosting behavior and clock stability. Let’s move on.
RTX 2070 Game Benchmarks - Sniper Elite 4
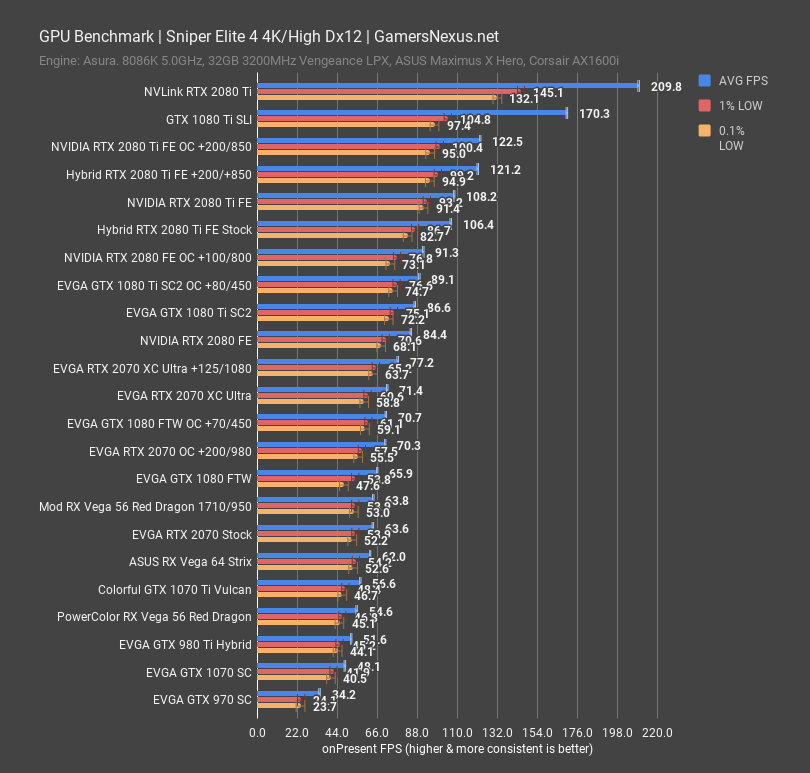
Sniper Elite 4 positions the 2070 XC Ultra at 71FPS AVG, with lows at 61FPS and 59FPS. The RTX 2070 stock card runs at 64FPS AVG, closer to the overpowered Vega 56 mod we have. The difference between the stock XC Ultra at 71FPS and the basic 2070 cards is about 11%, favoring the RTX 2070 XC Ultra. Frametimes are proportionately timed.
Overclocking allows the XC Ultra to hold a significant lead, likely in part due to video memory load balancing in this game. We’re looking at 77FPS versus 71FPS for the overclocks, providing a reasonable advantage. Whether that’s worth $50 is sort of debatable.
RTX 2070 Game Benchmarks - F1 2018
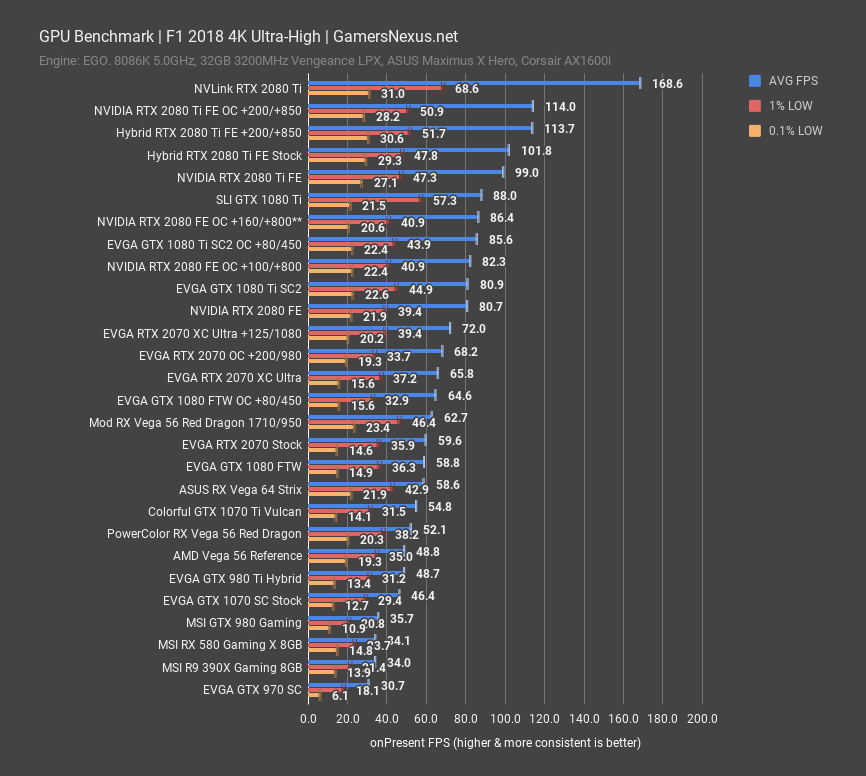
For F1 2018 at 4K, we found the 2070 stock card to perform at about 60FPS AVG, with the XC Ultra up to 66FPS AVG. This is a reasonable gain, although overclocking does push the stock 2070 above the XC Ultra, and overclocking the XC Ultra re-establishes its lead.
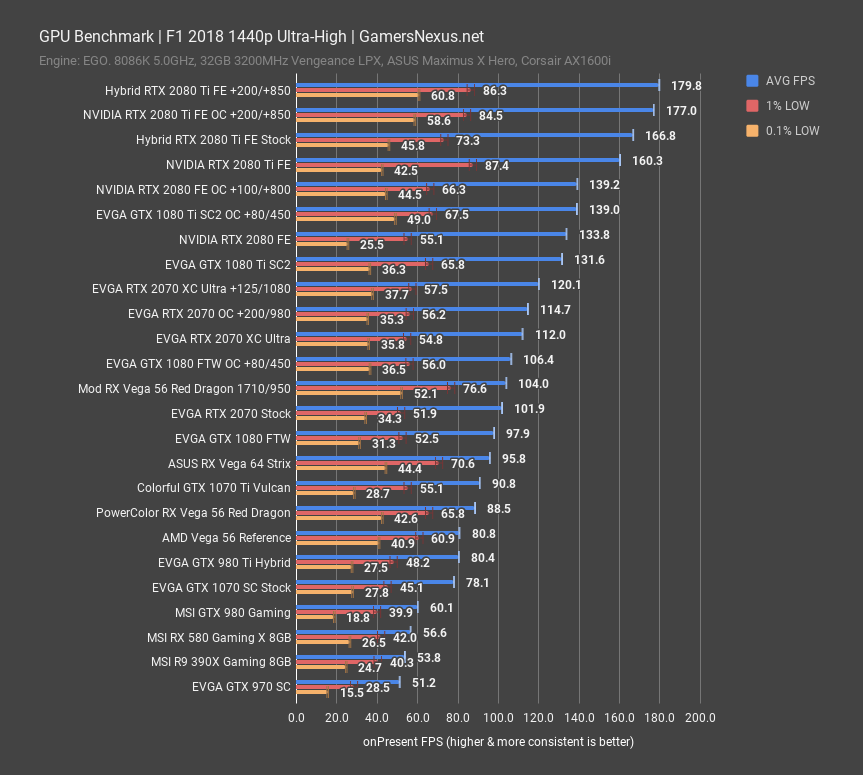
At 1440p, the XC Ultra again is about 10% higher framerate at 112FPS versus 110FPS AVG, with low-end performance is about the same. Overclocking both cards gets them to 120FPS AVG for the XC Ultra and 115FPS AVG for the 2070 Black, again leading to the question of when the extra $50 is worth it. The answer is primarily in thermals and noise, which are directly related, not in raw framerate.
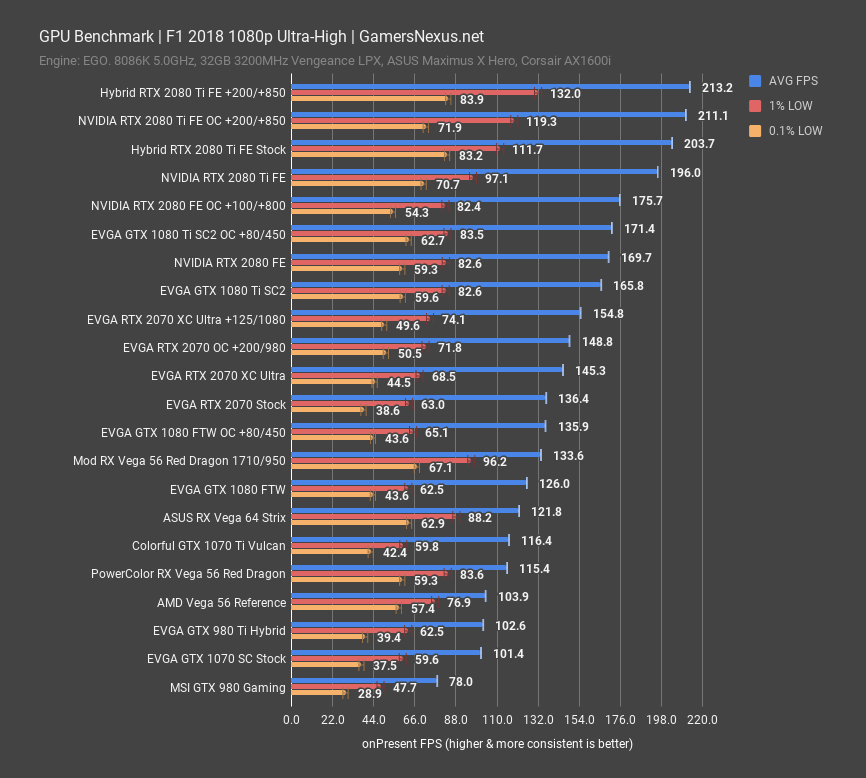
1080p produces similar scaling, with the XC Ultra again ahead reliably, and with overclocking permitting the XC Ultra to remain in the lead. It’s not quite at tying with a GTX 1080 Ti, but is approaching the SC2’s 166FPS AVG when left stock.
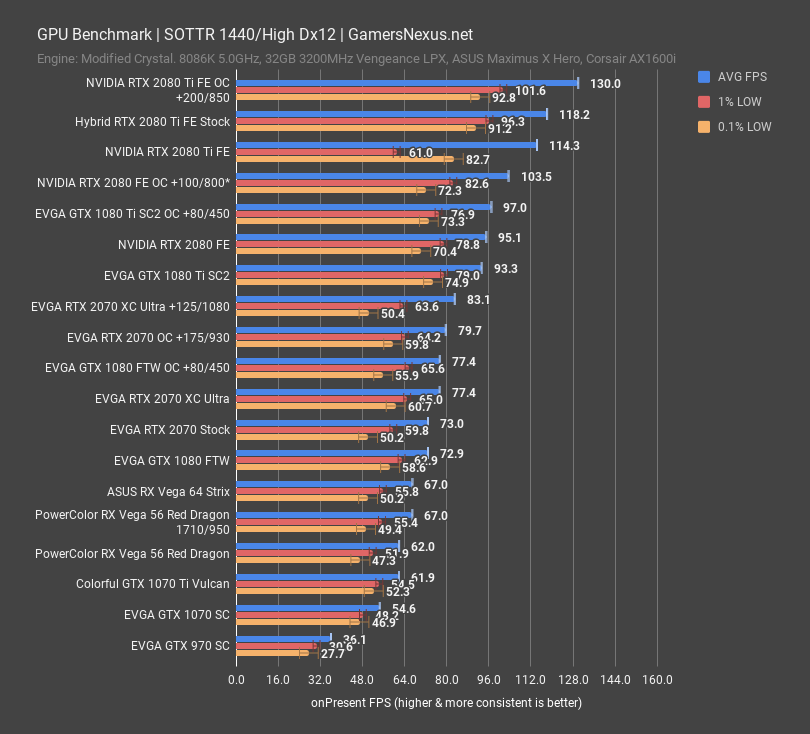
RTX 2070 Game Benchmarks - Shadow of the Tomb Raider
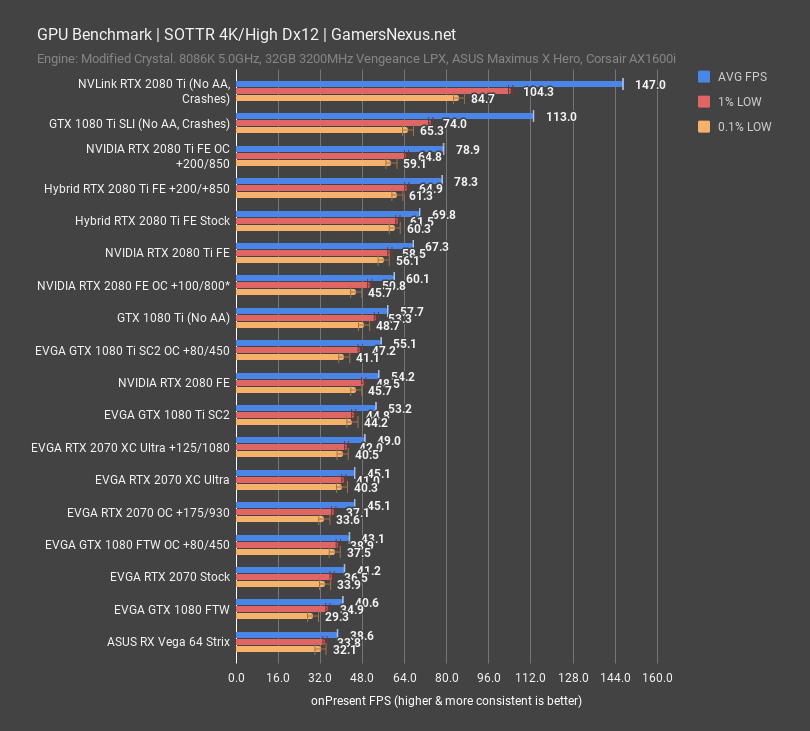
Shadow of the Tomb Raider posts similar results at 4K, with the 2070 Black OC tying the 2070 XC Ultra stock. Again, we’re seeing largely single-digit percentage improvements in the performance for the XC Ultra versus the stock model.
At 1440p, the overclocked XC Ultra is a few points ahead of the overclocked 2070, once again, with the same happening at stock metrics.
Power Consumption
Finally, for power consumption, we measured the following plot in Ashes of the Singularity once all benchmark runs were (mostly) aligned and synchronized in data:
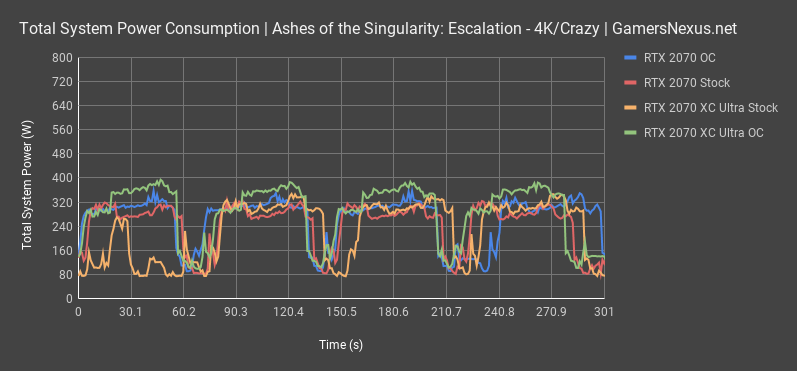
Our data logging puts the AOTS 4K benchmark at a total system draw of about 320W peak for the 2070 Black and 2070 XC Ultra stock cards, with occasional spikes to 357W. It would appear that both 2070s draw about the same power when stock, despite the XC Ultra offering meaningfully more performance in its testing. These are both power constrained by NVIDIA. When the 2070 XC Ultra is overclocked, it peaks at 400W total system draw and averages 357-380W. Again, this is total system power consumption, but the motherboard and platform voltages are fully controlled to keep consistent power needs for all non-GPU components.
Conclusion: TU106-400A vs. 400 & XC Ultra vs. 2070 Black
This review ultimately covers two key items: (1) The review of the EVGA RTX 2070 XC Ultra vs. the 2070 Black, establishing the differences between cards priced $70 apart (at time of posting); (2) the emergent differences between the TU106-400A and TU106-400 GPUs. The two go somewhat hand-in-hand.
The clock difference is somewhat enormous when looking between the two, at more than 100MHz faster on the higher-end model. This isn’t just the PCB and VRM – it barely is, in fact – it’s the boosting behavior from the silicon quality and the cooler quality. A higher-end cooler with lower operating thermals allows the GPU to hit higher frequencies at lower voltages, pursuant to NVIDIA’s Boost 4.0 stepping. The silicon quality difference is somewhat apparent, if you go back to our first two OC stepping charts in this review.
As for whether it’s worth it, that’s harder to gauge. At a $70 premium, it feels difficult to justify in a market that still has some 1080 & 1080 Ti availability. This will become easier to justify as Pascal stock dwindles – which is already happening – but the primary reason for a purchase would ideally be driven by desire for lower noise or higher OC potential. If neither of these really matter and you just want to use the card stock, and don’t care about an extra 5-12% performance, then the $500 model seems sufficient for that use case. It is inoffensive in its usefulness. The higher-end 2070 XC Ultra model is significantly advantaged, but also fatter and more expensive. The cost pushes it far enough from the value proposition that it becomes difficult to firmly justify. Closer to $550, we’d be buyers.
Editorial, Testing: Steve Burke
Video: Andrew Coleman