Today, we’re reviewing the GTX 1660 Ti, whose name is going to trip us up for the entirety of its existence. The GTX 1660 Ti is NVIDIA’s mid-step between Pascal and Turing, keeping most of the Turing architectural changes to the SMs and memory subsystem, but dropping the official RTX support and RT cores in favor of a lower price. The EVGA GTX 1660 Ti XC that we’re reviewing today should have a list price of $280, sticking it between the $350 baseline of the RTX 2060 and the rough $200 price-point of modern 1060s, although sometimes that’s higher. For further reference, Vega 56 should now sell closer to $280, with the RX 590 still around the $260 range.
“Why the name?”
This doesn’t really deserve too much of an answer, as it is ultimately just a name, but it’s completely fair to say that the enthusiast community has made fun of the “1660 Ti” name ever since it first sprung-up. We sincerely doubted that this would be the final name of the product and, clearly, turned out wrong. We decided to ask NVIDIA why it chose to start a “16” series rather than make an 1160 Ti, to which NVIDIA answered:
“As far as naming goes, and why 16 series instead of just using 11? Quite simply, we felt that from an overall architecture and performance perspective, TU116 is closer to the other TU10x parts than it is to prior generation GP10x. TU116 has most of the Turing architecture features, including the new dedicated cores for INT32 and FP16 operations, and it also has all of the new Turing shading features, including variable rate shading and mesh shading. And as you see, performance is closer to the GeForce RTX 2060 than it is to the GeForce GTX 1060. In fact just like you said, it performs closest to the GTX 1070, beating it in some games and losing some others. So we ultimately settled on 1660 Ti instead of 1160 Ti. ‘16’ is closer to 20, after all.”
Good enough. If you were curious, there’s the answer.
GTX 1660 Ti Specs
| GTX 1660 Ti | GTX 1060 | |
| Die | TU-116 | GP106-400-A1 |
| Process Node | 12nm | 16nm |
| Die Size | 284mm^2 | 200mm^2 |
| Transistor Count | 6.6B | 4.4B |
| SMs | 24 | 10 |
| CUDA Cores / SM | 64 | 128 |
| CUDA Cores | 1536 | 1280 |
| TMUs | 96 | 80 |
| Clock (Boost) | 1500 (1770)MHz | 1506 (1708)MHz |
| FP16 FLOPS | 11TFLOPs | 4.4TFLOPs |
| FP32 FLOPS | 5.5TFLOPS + 5.5TFLOPS INT32 | 4.4TFLOPs (total) |
| Texel fill-rate | 169.9GT/s | 120.5GT/s |
| Memory Capacity | 6GB | 6GB (this model) |
| Memory Data Rate | 12Gbps | 8Gbps |
| Max L1 Cache Size | 1536KB | 480KB |
| TDP | 120W (130W EVGA) | 120W |
| Price on 2/21 | $280 | $200 |
| Launch MSRP | $280 | $250 |
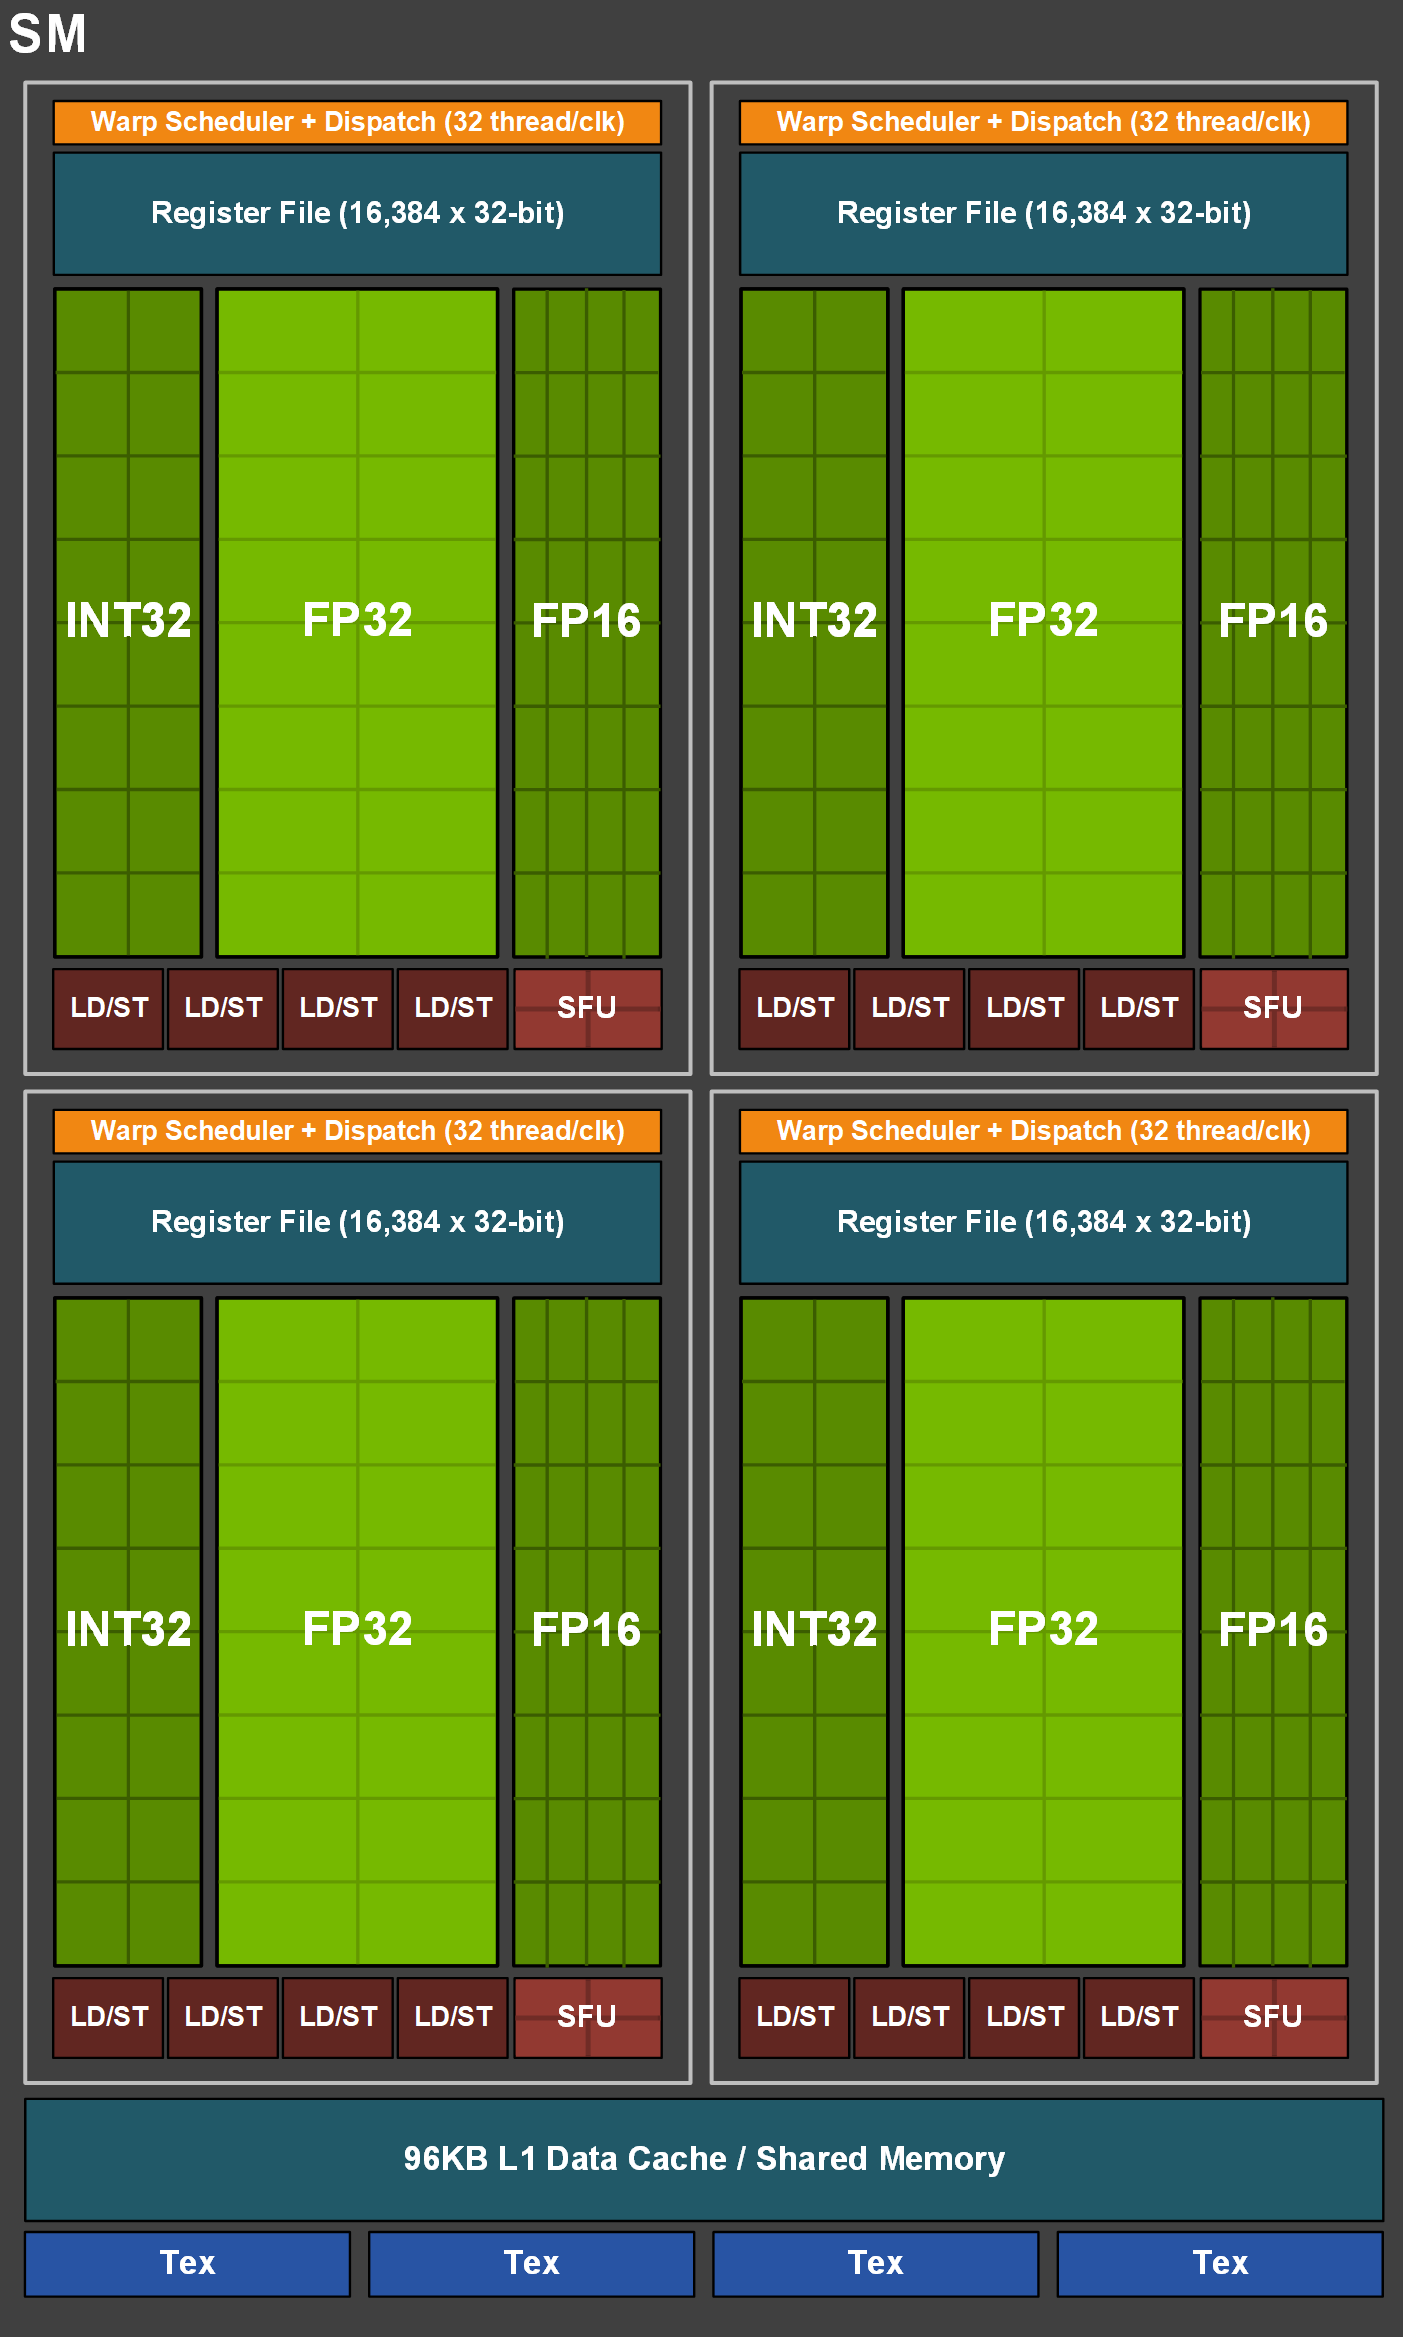
If you were to just look at a spec sheet, the 1660 Ti has more than two times the SM count over the 1060, but keep in mind that Turing changed the layout such that each SM now carries half of the CUDA cores as before, moving from 128 per SM to 64 per SM. That’s not to downplay the obvious increase in all the specs, but to highlight that comparing the single number of SM count is non-linear. This SM block diagram better illustrates the changes to SM layout in Turing, where we now see FP32 lanes alongside INT32 and FP16. INT32 processing can now be done in parallel to FP32, which has proven beneficial in games with heavier compute workloads (like Wolfenstein 2 or Sniper Elite 4), as opposed to the 10-series and its preference to instead interrupt the pipeline with each INT instruction. FP16 also gets more of a focus here. We have not yet independently validated this fact, but NVIDIA notes that FP16 is getting adoption in games like Far Cry, where NVIDIA notes that water simulation uses FP16. FP16 is also known as “half-precision,” and shouldn’t be used for things like hitbox calculation or accurate physics simulation, but would theoretically be fine for less sensitive effects.
The 1660 Ti ends up with several of Turing’s architectural changes, like the integer pipeline changes that we discussed in an interview with NVIDIA at CES, but also axes the RT cores and tensor cores to reduce cost and offer a non-RTX product. The memory moves to a significantly faster GDDR6 platform from GDDR5, with the native speed at 12Gbps for TU116 cards. Other improvements also move over, like the NVENC increase in decoding capabilities and bitrate savings.
Test Methodology
Testing methodology has completely changed from our last GPU reviews, which were probably for the GTX 1070 Ti series cards. Most notably, we have overhauled the host test bench and had updated with new games. Our games selection is a careful one: Time is finite, and having analyzed our previous testing methodologies, we identified shortcomings where we were ultimately wasting time by testing too many games that didn’t provide meaningfully different data from our other tested titles. In order to better optimize our time available and test “smarter” (rather than “more,” which was one of our previous goals), we have selected games based upon the following criteria:
- Game Engine: Most games run on the same group of popular engines. By choosing one game from each major engine (e.g. Unreal Engine), we can ensure that we are representing a wide sweep of games that just use the built-in engine-level optimizations
- API: We have chosen a select group of DirectX 11 and DirectX 12 API integrations, as these are the most prevalent at this time. We will include more Vulkan API testing as more games ship with Vulkan
- Popularity: Is it something people actually play?
- Longevity: Regardless of popularity, how long can we reasonably expect that a game will go without updates? Updating games can hurt comparative data from past tests, which impacts our ability to cross-compare new data and old, as old data may no longer be comparable post-patch
Game graphics settings are defined in their respective charts.
We are also testing most games at all three popular resolutions – at least, we are for the high-end. This includes 4K, 1440p, and 1080p, which allows us to determine GPU scalability across multiple monitor types. More importantly, this allows us to start pinpointing the reason for performance uplift, rather than just saying there is performance uplift. If we know that performance boosts harder at 4K than 1080p, we might be able to call this indicative of a ROPs advantage, for instance. Understanding why performance behaves the way it does is critical for future expansion of our own knowledge, and thus prepares our content for smarter analysis in the future.
For the test bench proper, we are now using the following components:
GPU Test Bench (Sponsored by Corsair)
Component | Courtesy of | |
CPU | GamersNexus | |
GPU | This is what we’re testing! | Often the company that makes the card, but sometimes us (see article) |
Motherboard | ASUS | |
RAM | Corsair | |
PSU | Corsair | |
Cooler | NZXT | |
SSD | Plextor 256-M7VC | GamersNexus |
Apex Legends Benchmark
You can find our Apex Legends benchmarking notes & methods here.
Apex Legends is next, offering a highly popular, brand new DirectX 11 title for comparison. We just posted a large benchmark study on this one to show performance scaling, ultimately deciding that multiplayer testing with consistent test patterns offered the most realistic look at performance. The downside is that we don’t have as many cards tested in this game as the others – you’ll have to look at our other game benchmarks for cards like the GTX 1070, but let’s look anyway at how Apex Legends runs.
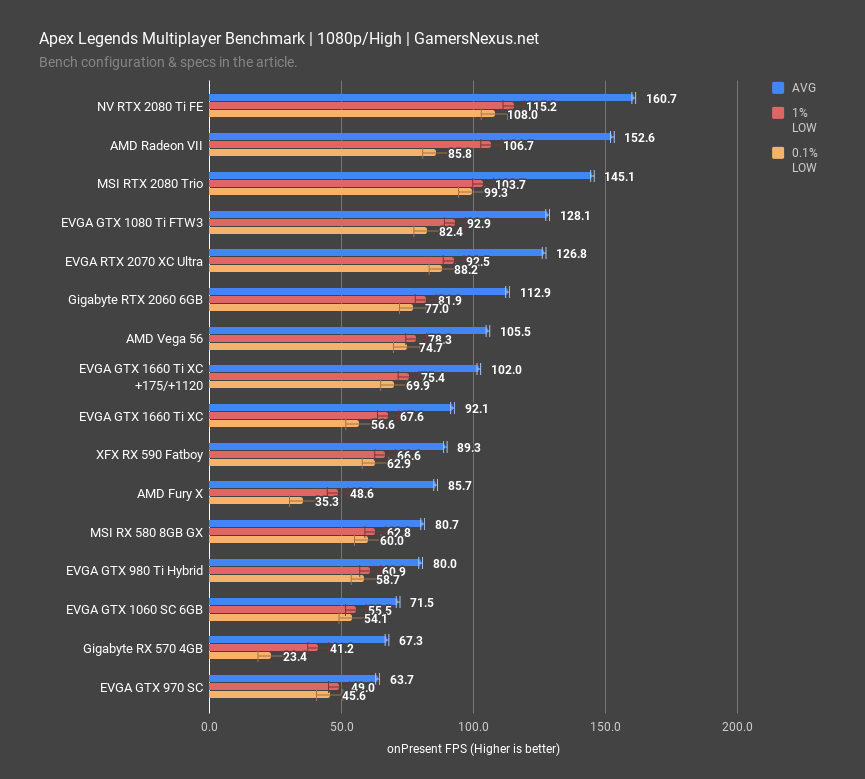
At 1080p and with all settings at “High,” the GTX 1660 Ti XC ends up at 92FPS AVG, with lows spaced reasonably behind. This lands the 1660 Ti as between the RX 590 Fatboy’s 89FPS AVG and Vega 56’s 106FPS AVG. The 1660 Ti ends up about about 3% better than the RX 590, which is way outside of our 0.7FPS AVG deviation from the mean, but isn’t far from GPU silicon quality boosting range variance. The difference between the RX 590 and 1660 Ti is insignificant and not noticeable to the player. Frametimes are functionally equally spaced on each, with differences landing within the larger standard deviation for 0.1% lows and 1% lows. Notably, versus the GTX 1060 6GB that the 1660 Ti sort of replaces, it ends up about 29% ahead. As you’ll see in other charts, this is comparable to a 1070. Versus the new RTX 2060 that preceded the 1660 Ti, the 2060 leads the 1660 Ti by 23% for AVG FPS. Overclocking the 1660 Ti with a +175MHz offset and +1120MHz core offset gets it to nearing equivalence with the Vega 56 card, and narrowing the stock 2060’s lead to 10.6%.
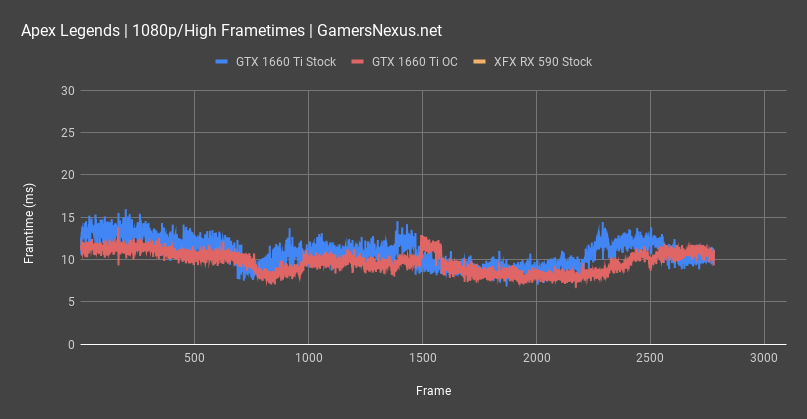
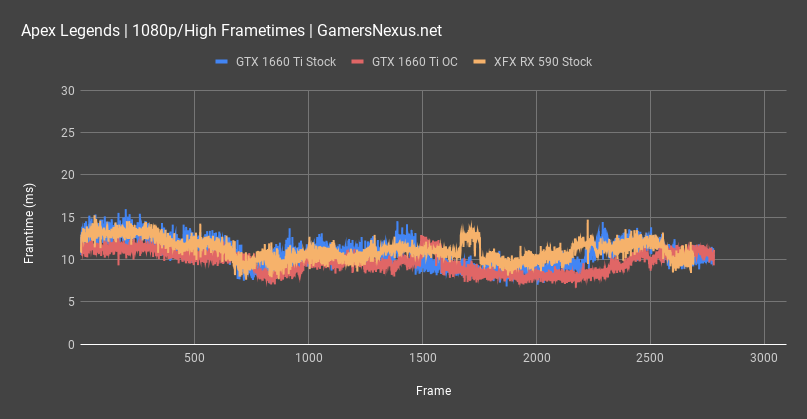
Here’s a frametime performance chart to better illustrate the frame-to-frame behavior of each of the tested devices. Lower frametimes are better, but more consistent frametimes are best. The GTX 1660 Ti ends up plotting at about 12ms per frame on average, with variance frame-to-frame well under 4ms. That’s not the best we’ve ever seen, but it is among the top performers for frametime consistency. Users do not typically notice frame-to-frame interval variance less than 8-12ms from the previous frame. In this regard, the GTX 1660 Ti does well throughout testing. Plotting the overclocked 1660 Ti, we can see that performance overall improves and does so without introducing frametime instability, showing that the overclock is stable. The RX 590 ends up similar in performance to the previous two lines, although averages higher in frametime and therefore lower in framerate.
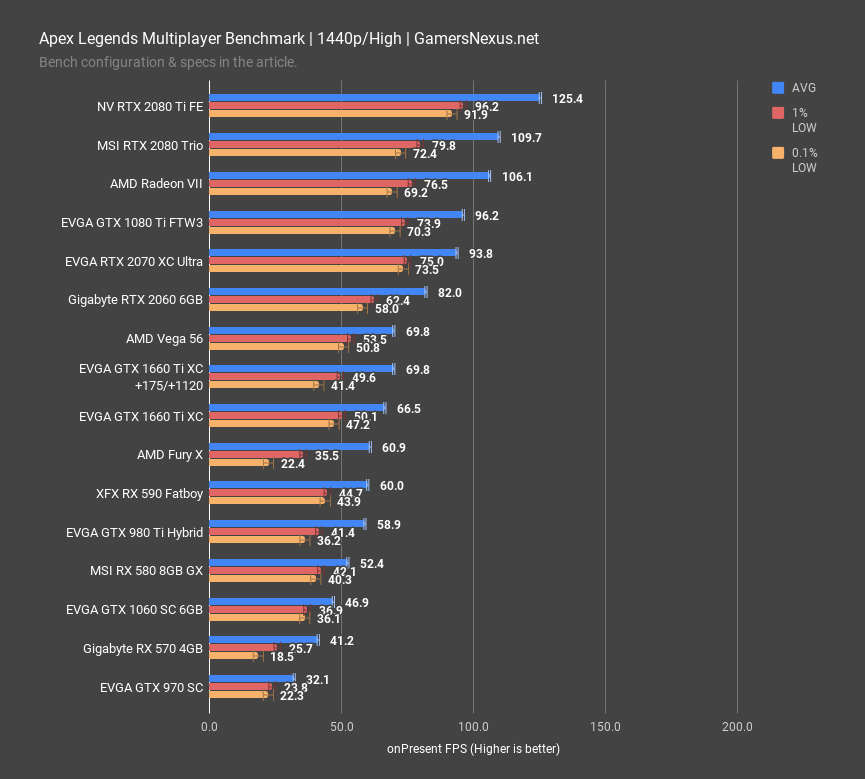
1440p positions the GTX 1660 Ti closer to Vega than 1080p. With this higher resolution, the 1660 Ti proves capable of framerates equal to or north of 60FPS with high settings, although obviously FPS can go up with a settings reduction. We’re at 67FPS AVG when stock, ranking the card as about 9% faster than the XFX RX 590 or Fury X, although the Fury X struggles fiercely in frametime consistency and is an objectively worse performance than either the 590 or 1660 Ti. The 1660 Ti also outperforms the once-king 980 Ti by 13%, but is led by Vega 56 by 5%. As for the gap between this $280 1660 Ti and the $350 RTX 2060, that 25% price increase amounts to about a 23% performance increase – not bad, especially considering that we thought the RTX 2060 was NVIDIA’s strongest RTX offering to-date.
F1 2018 Benchmark
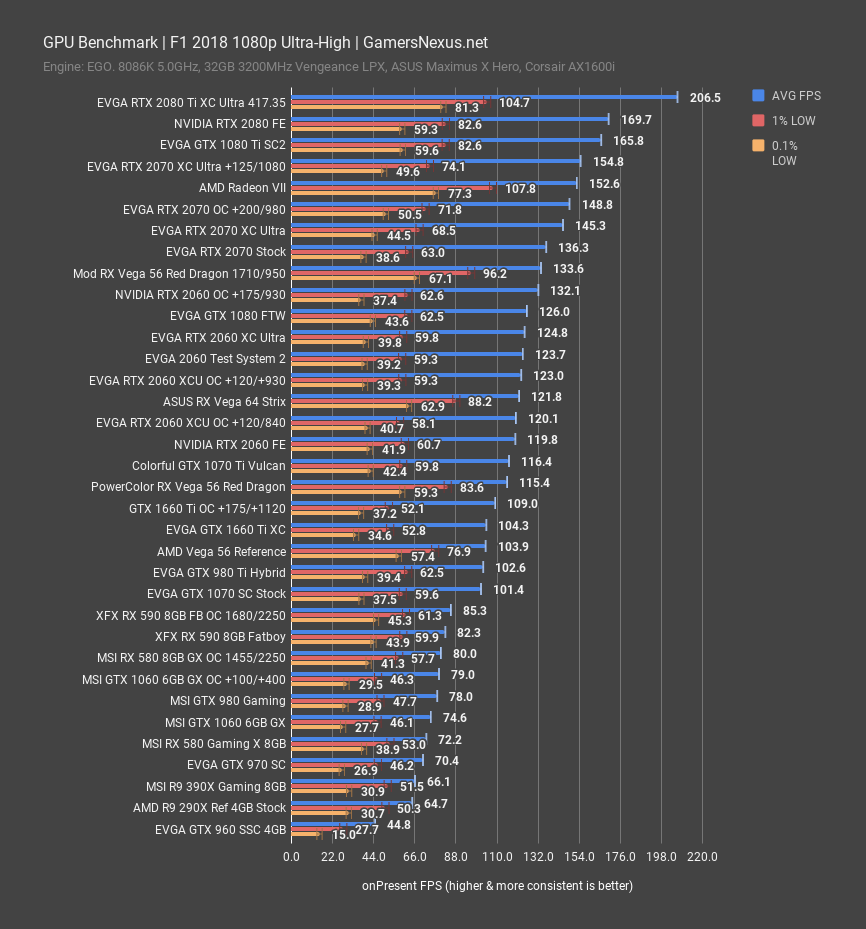
F1 2018 is next, giving us another DirectX 11 game before getting on to Sniper Elite 4. For F1 2018 at 1080p, the 1660 Ti ends up at 104FPS AVG, which is exactly tied with the Vega 56 reference card, although a good bit behind our more recently tested Vega 56 Red Dragon. Lows remain advantaged on the AMD cards in this game. The 1660 Ti outperforms the 980 Ti marginally and out-stretches the 1070 SC by 2.9%. Compared to the RX 590’s 82FPS AVG, the 1660 Ti runs about 28% higher in framerate.
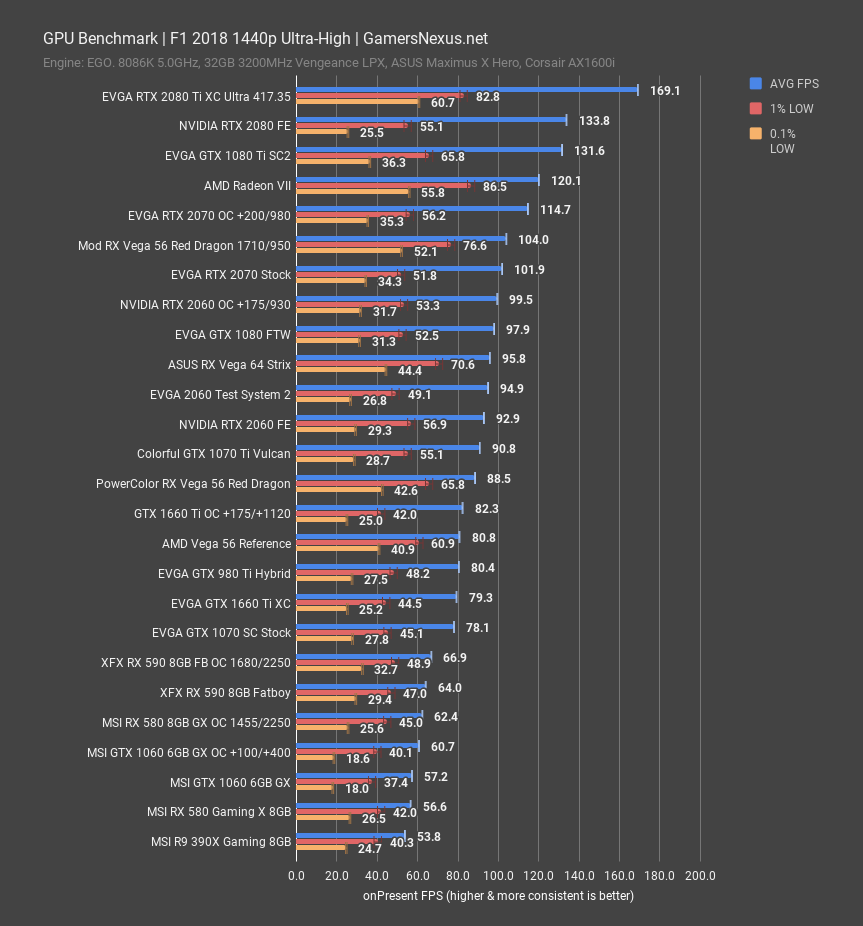
At 1440p, the 1660 Ti ends up running at 80FPS AVG, landing it slightly ahead of the 1070 – although functionally tied – and just below the 980 Ti, again functionally tied. Vega 56 reference is in the vicinity as well, with the overclocked 1660 Ti ending up below the Red Dragon card. Scaling is about the same here as in the previous chart, with the 1660 Ti ending up about even with the 1070, better than the 590 in average framerate, and worse than Vega 56 in frametime consistency and, if comparing against a better partner model, also in average FPS.
Sniper Elite 4 Benchmark
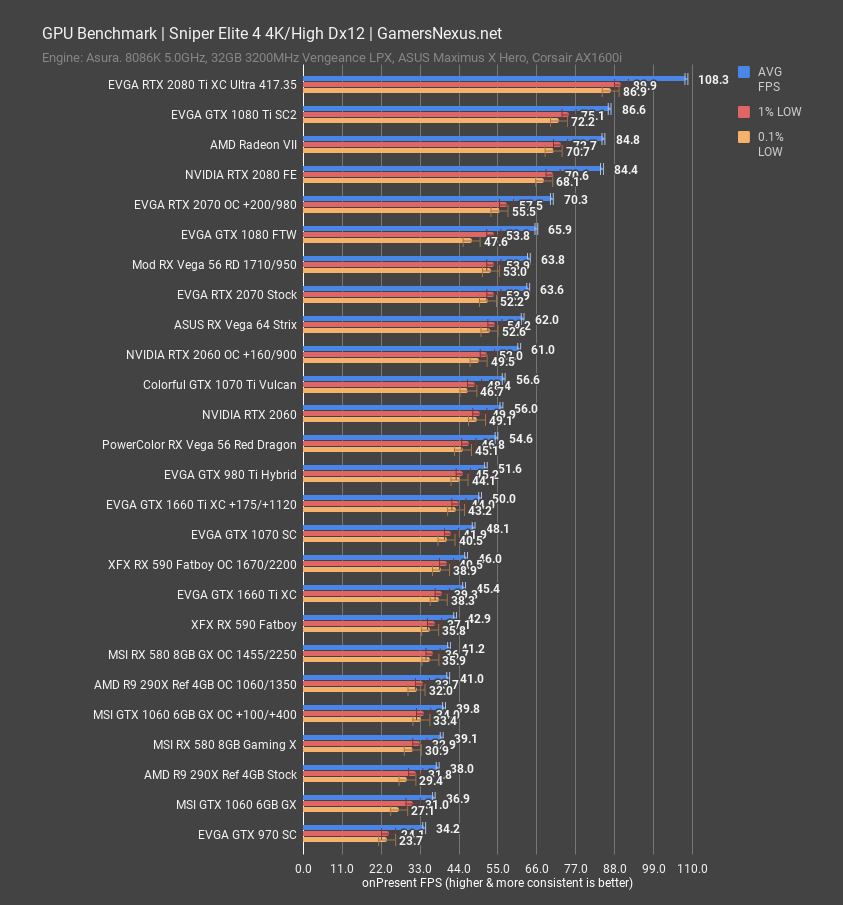
Sniper Elite 4 uses DirectX 12, unlike the previous two games, and also has asynchronous compute support. For this one, we run tests at 4K and at 1080p. The game runs well at both resolutions on most cards, but for the 1660 Ti, 4K acts more like a synthetic test just for how it stacks-up versus other cards we’ve tested.
At that 4K resolution, the 1660 Ti stock card ends up at 46FPS AVG, putting it just ahead of the RX 590 Fatboy and with functionally equivalent lows. Compared to the 1070, the GTX 1660 Ti ends up marginally worse, although overclocking puts it ahead of the 1070 SC stock card and below the 980 Ti Hybrid.
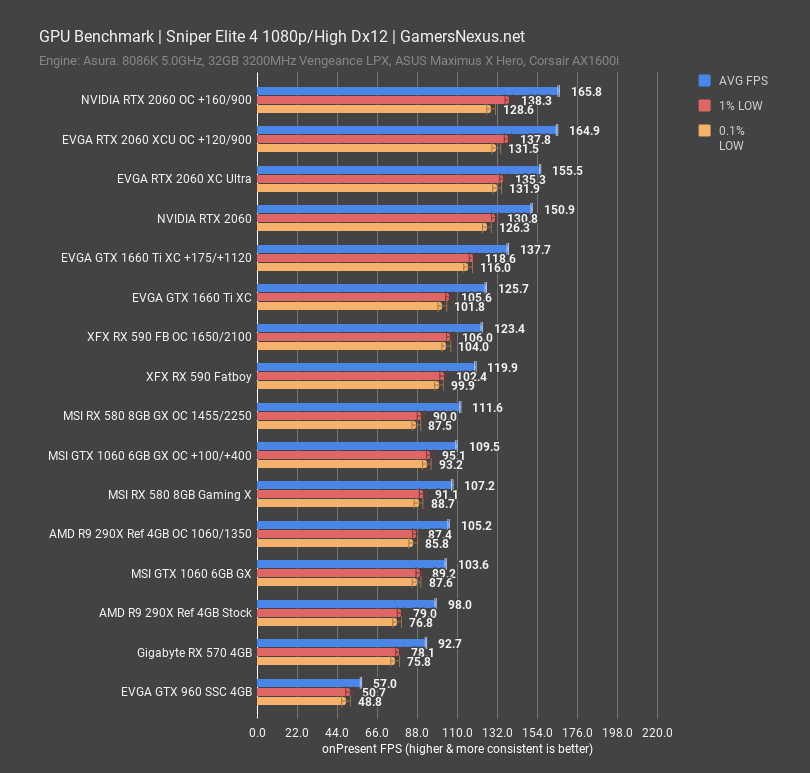
Our 1080p chart is much more limited for Sniper as we only recently added it, but the 1660 Ti XC ends up at 126FPS AVG stock, ranking it as about tied with the overclocked RX 590 and behind the RTX 2060. Overclocking the 1660 Ti pushes it to nearing 140FPS AVG, allowing the 2060 stock card a 13% lead, although you could obviously overclock the 2060 for more gains.
GTA V Benchmark
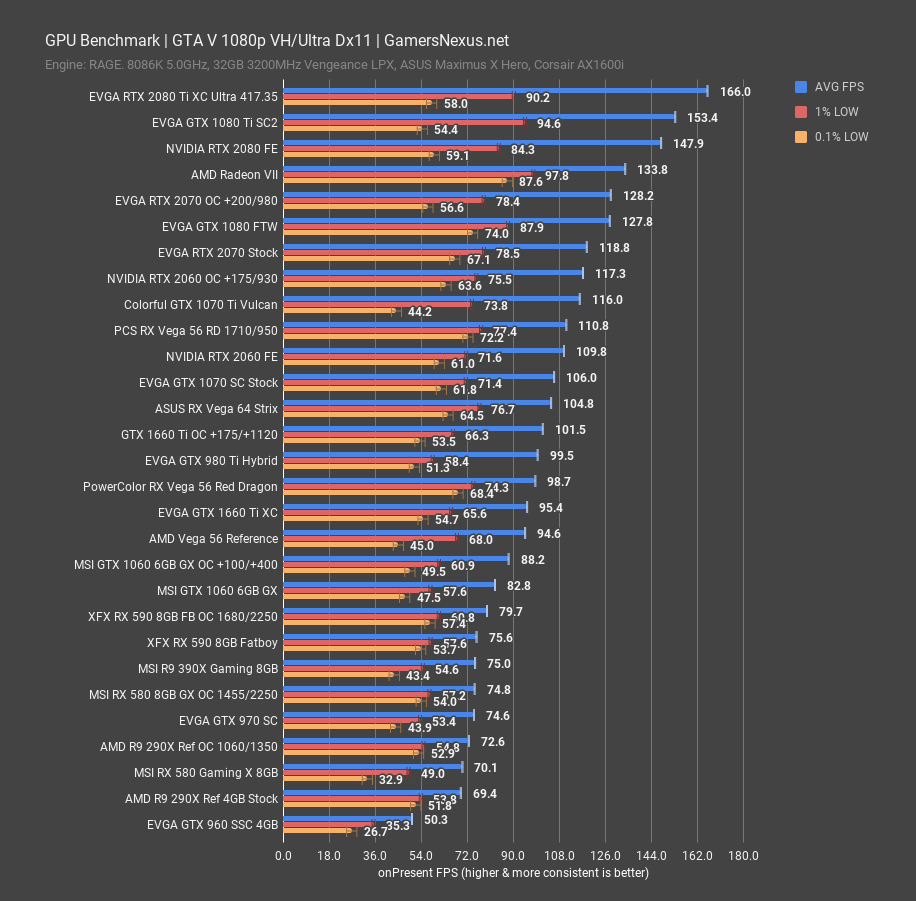
GTA V gives us an old, popular DirectX 11 title that’s mostly getting content updates, at this point, and not seeing much change by way of drivers of game optimizations. At 1080p, the 1660 Ti stock card runs at 95FPS AVG, placing it just between the Vega 56 reference and Vega 56 Red Dragon cards when both are running at stock settings. Lows are also nearby. The 1660 Ti stock card’s 95FPS AVG outperforms the stock MSI GTX 1060 6GB Gaming X’s 83FPS AVG by 15%, further outperforming the RX 590 8GB Fatboy’s 76FPS AVG by about 26%, a stark contrast from our Apex Legends benchmark. Note that the GTX 1060 has always done better relative to the RX 580 in GTA V specifically, and so seeing this continue in the 1660 Ti is no surprise. The 1660 Ti is outperformed by the stock 1070 SC in this title, which runs at 106FPS AVG and leads by 11%.
Regarding overclocking, the 1660 Ti overclock gets us to 102FPS AVG, leading the 1660 Ti XC stock card by 6.4% and nearing Vega 64 performance in GTA V.
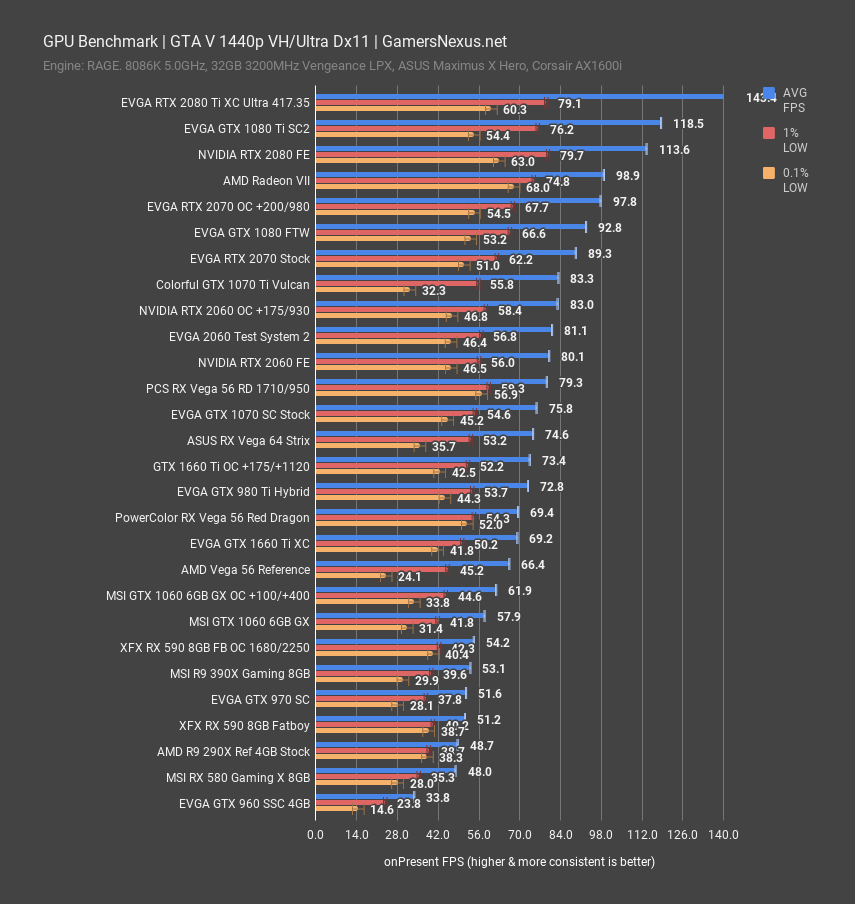
At 1440p, the GTX 1660 Ti XC stock card operates at 69FPS AVG, ranking it again between both Vega 56 models we’ve tested recently, and about 19.5% ahead of the GTX 1060 6GB stock card’s 57.9FPS AVG. Overclocking the GTX 1660 Ti XC plants it at 73FPS AVG, with lows still reasonably spaced for this title. This allows the 1660 Ti to approach the Strix Vega 64, outpace the 980 Ti Hybrid’s 73FPS AVG, and approach the 1070 SC’s 76FPS AVG. Although the 1070 holds a technical lead here, the experiential difference is functionally zero to the player.
Far Cry 5 Benchmark
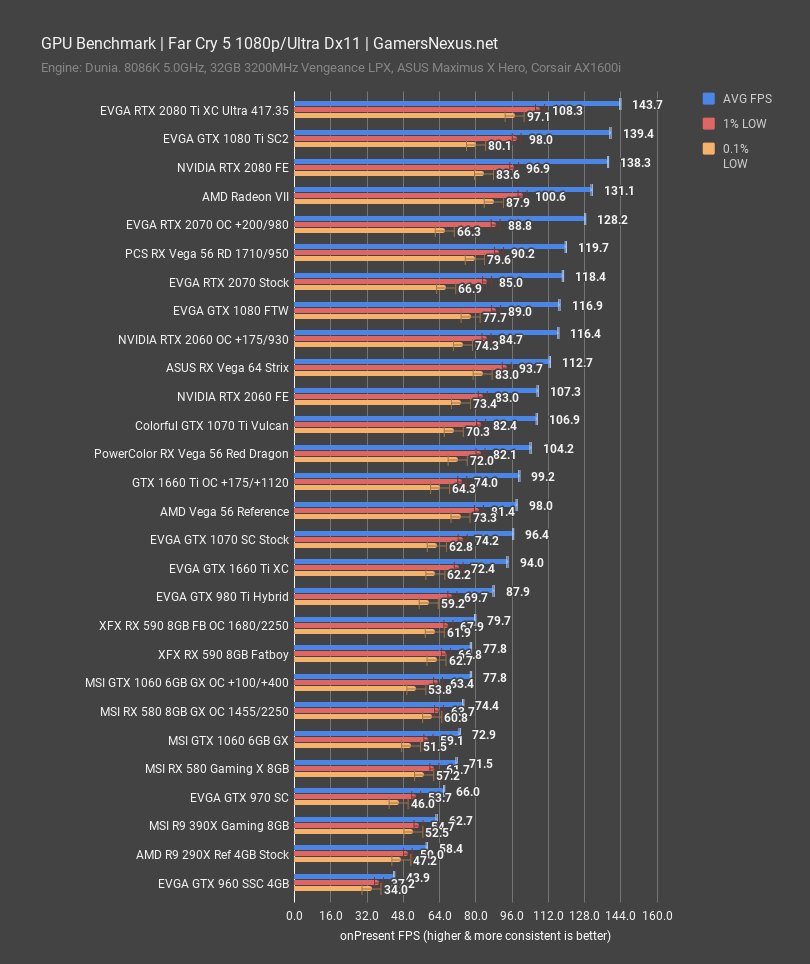
Far Cry 5, as we always say, is valuable for its heavy reliance on long draw distances and screen-space reflections. At 1080p, the 1660 Ti XC operates at 94FPS AVG, ranking it as about 7% faster than the 980 Ti Hybrid and about 21% faster than the XFX RX 590 stock card’s 78FPS AVG, although overclocked 590 performance isn’t all that different. The 1070 runs roughly tied with the 1660 Ti, with its 96FPS AVG outranking the 1660 Ti by just 2.5%. Ahead of this, Vega 56 reference and the PowerColor Vega 56 rest ahead, with the 1660 Ti overclock landing between the two at 99FPS AVG. The RTX 2060, meanwhile, leads the stock 1660 Ti by 14%, although the overclock closes that gap.
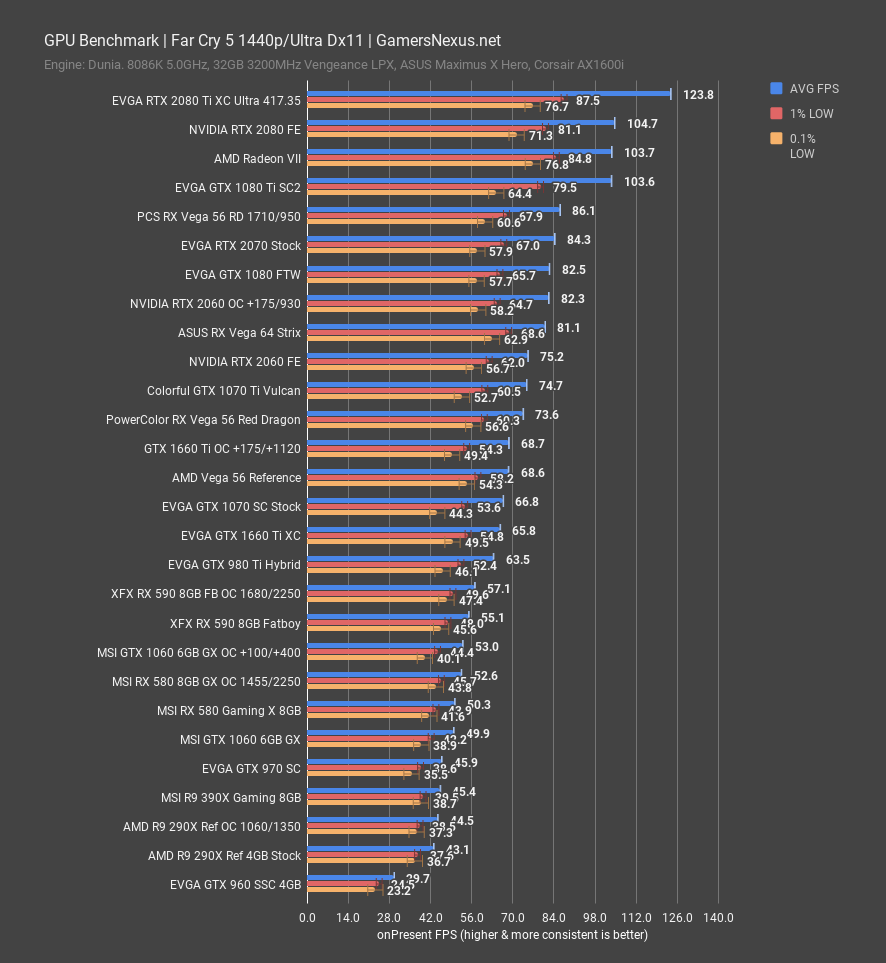
At 1440p, the GTX 1660 Ti operates at 66FPS AVG, planting it as functionally tied with the GTX 1070 SC stock card and not too distant from Vega 56. The overclocked 1660 Ti ties the reference Vega 56 card’s 69FPS AVG, although is outpaced by the Red Dragon Vega 56 card’s 74FPS AVG. The 1660 Ti does reasonably well at 1440p with elevated graphics settings, and some drops to settings would allow, obviously, a higher framerate.
Shadow of the Tomb Raider Benchmark
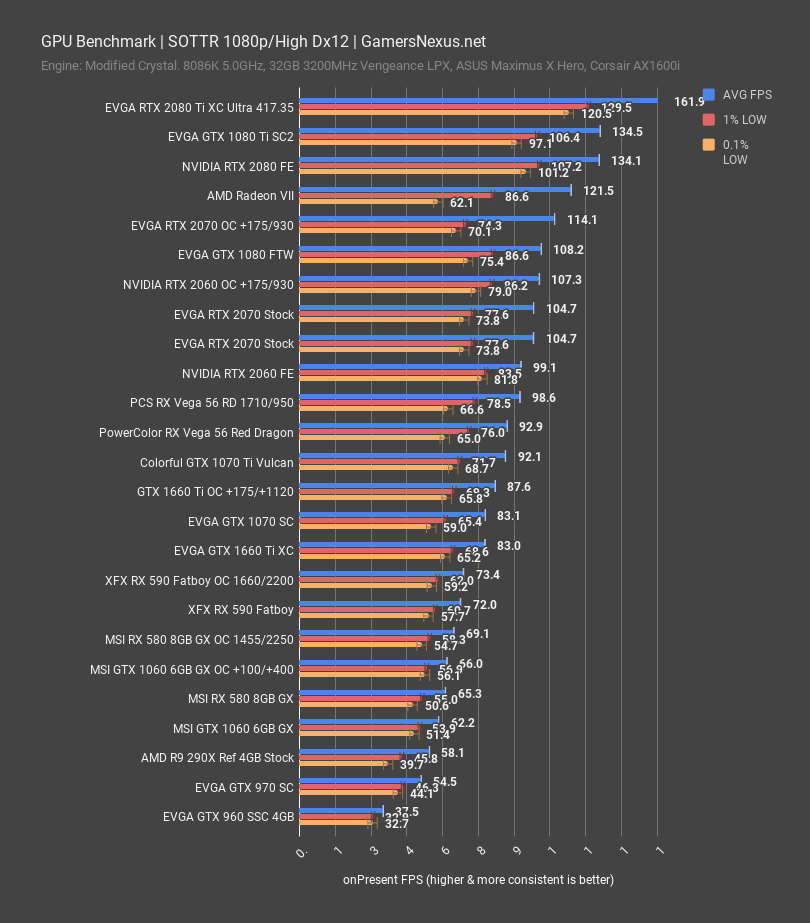
Shadow of the Tomb Raider and its modified Crystal engine is next. For this one, running at 1080p/High, we measured the 1660 Ti XC at 83FPS AVG, putting it as functionally tied with the GTX 1070. Lows are within margin of error between the two. The card ends up about 15% ahead of the RX 590 Fatboy’s 72FPS AVG and even further ahead of the GTX 1060 6GB’s 62FPS AVG when stock. Overclocking the 1660 Ti gets it to 88FPS AVG, ranking the card close to the 1070 Ti, but still permitting the 1070 Ti a lead of 5%.
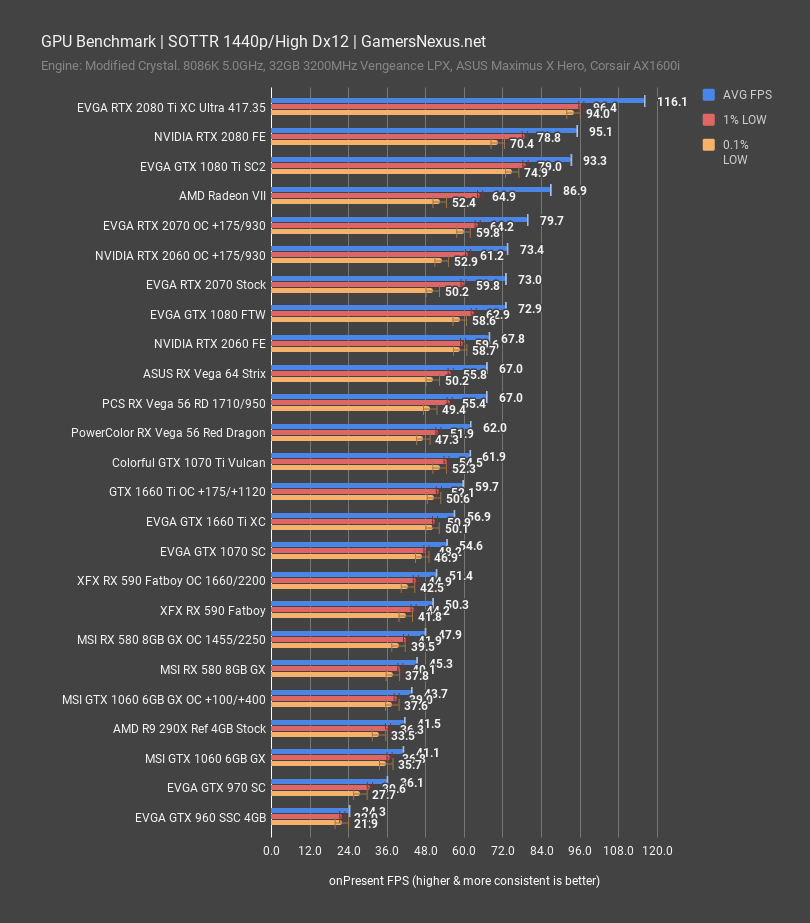
At 1440p, the GTX 1660 Ti XC proves that a minor settings adjustment would easily permit a 60FPS AVG baseline, although our standardized test had the card at 57FPS AVG with lows very close behind, illustrating consistent frametime performance. The GTX 1070 SC ends up at 55FPS AVG here, so the 1660 Ti takes a slight lead. The stock 1660 Ti ends up between the stock Red Dragon 56 and the two RX 590 benchmarks we have on this chart.
Power Consumption
Power consumption is up next. For this, we’re using total system power consumption as logged from the wall, so this is not individual component consumption. The test system is heavily controlled, including all voltages in BIOS, so the only thing changing is the GPU power consumption. For our standardized Ashes of the Singularity power consumption test, we see the GTX 1660 Ti stock system pulling about 260W at peak, with average power consumption in the range of 230W-250W for the total system draw. We won’t be plotting the overclocked 1660 Ti here because our XC model does not change. The power consumption of the card peaks at about 130W and goes no higher, as there’s no power target offset for the EVGA 1660 Ti XC.
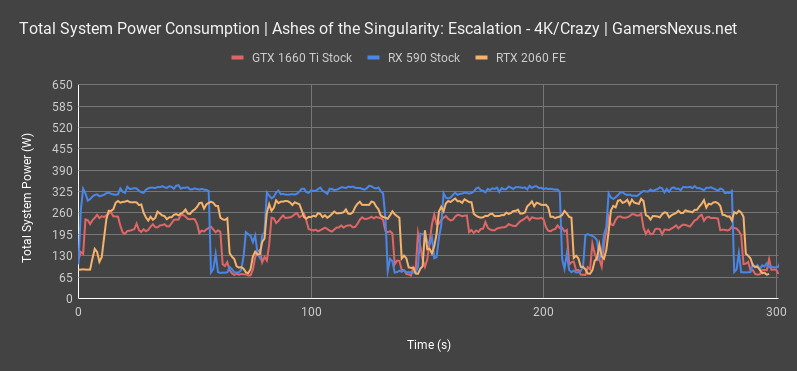
The RX 590 plots next, showing us a higher ceiling at 325W total system power consumption. The line remains steady here, as boosting algorithms and power balancing are less aggressive than on NVIDIA cards. The delta is between about 65W and 120W, depending on which part of the test you’re comparing.
For perspective against another NVIDIA cards, the RTX 2060 total system draw ends up at about 260W to 290W, which we’ll also plot now.
Overclocking
| EVGA GTX 1660 Ti XC Overclock Stepping | TimeSpy Extreme Stress Test | GamersNexus.net | ||||||||||
| Peak Frequency | AVG Frequency | Core Offset | Core Voltage | Memory Frequency | Memory Offset | Power | Watts | Fan Speed | Active Temp | Pass/Fail |
| 1935 | 1905 | 0 | 1037 | 1500.2 | 0 | 100% | 129 | 1313 | 51 | P |
| 1935 | 1875 | 0 | 1037 | 1500.2 | 0 | 100% | 129 | 1920 | 62 | P |
| 1965 | 1940 | 100 | 1037 | 1500.2 | 0 | 100% | 129 | 2100 | 64 | P |
| 1980 | 1965 | 125 | 1000 | 1500.2 | 0 | 100% | 130.2 | 2192 | 66 | P |
| 2025 | 1995 | 150 | 1000 | 1500.2 | 0 | 100% | 130 | 2200 | 65 | P |
| 2025 | 2010 | 175 | 1000 | 1500.2 | 0 | 100% | 130 | 2200 | 65 | P |
| 2055 | 2025 | 200 | 1000 | 1500.2 | 0 | 100% | 130 | 2200 | 65 | P |
| N/A | N/A | 225 | N/A | N/A | N/A | N/A | N/A | N/A | N/A | F |
| Fail - Application Crash | ||||||||||
| N/A | N/A | 200 | N/A | N/A | 600 | N/A | N/A | N/A | N/A | F |
| Fail - Application Crash | ||||||||||
| 2055 | 2025 | 200 | 1000 | 1600.3 | 400 | 100% | 130 | 2200 | 65 | P |
| 2055 | 2025 | 200 | 1000 | 1625.2 | 500 | 100% | 130 | 2200 | 65 | P - Questionable |
| 2055 | 2010 | 175 | 1000 | 1780.2 | 1120 | 100% | 130 | 2200 | 65 | P - Final OC |
Overclocking the GTX 1660 Ti XC proved straight-forward, seeing as we had no control over increasing the power target; that said, EVGA’s card does run a 10W higher power target than reference 1660 Ti board designs, and so there is some baked-in overclocking headroom. It’d be about equivalent to a 108% power target on a reference board, for example.
In our overclock stepping chart, you can see that our first two rows illustrate no change aside from allowing the GPU to warm-up to testing. When it was just starting the test, closer to 51 degrees Celsius, the GPU boosted to 1905MHz on average, with the maximum boost frequency at 1935MHz. This was with no offsets of any kind. As the card warmed up, looking at the second row, the average frequency dropped to 1875MHz with a 62-degree GPU core temperature. This is normal and is just how the boosting stepping behaves on NVIDIA, but we liked to illustrate it so that people understand the difference in cooler quality and fan speed curves.
Once we started actually trying to overclock, we hit about 2055MHz peak frequency briefly, but averaged about 2025MHz with a 200MHz offset to the core. This proved unstable once we started actually gaming, and so we dropped the offset to 175MHz and hit an average frequency of about 2010MHz core. That’s really not bad for a 1660 Ti with just a 130W power limit. Memory was stable with an 1120MHz offset, resulting in an actual memory frequency of 1780MHz, or about 14.2Gbps when looking at effective speed. If you look at the “Watts” column, you’ll see that we were at 130W for the entire test, so this was just a matter of tuning the frequency to fit silicon quality. We did not boost the fans to max speeds for this test.
Thermals
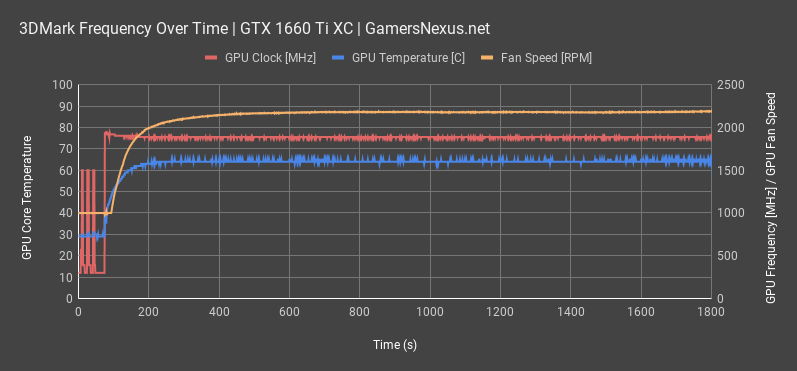
Thermals and frequency stability are up next. Starting with 3DMark Firestrike Extreme as a representation of frequency over time, we see that the GTX 1660 Ti ends up at 1935MHz peak and only decays to 1890MHz as the test drags on to the 30-minute mark. This is good overall, and is indicative primarily of a reasonable cooler and fan curve for the GPU core. We sometimes see much sharper fall-off in frequency from peak with worse coolers. For GPU temperature, the card ramped to about 65 degrees Celsius and attempted to remain there, For out of the box thermals, the GTX 1660 Ti XC has a thermal target of about 65 to 66 degrees for the stock fan curve, which is a reasonable temperature that still allows plenty of boost headroom. Plotting fan RPM next, we see that the fan ramps to about 2180RPM once at full load and steady state, and does not oscillate meaningfully from that baseline. This fairly fixed fan speed reduces the more audible and noticeable pitch change that more variable fans produce.
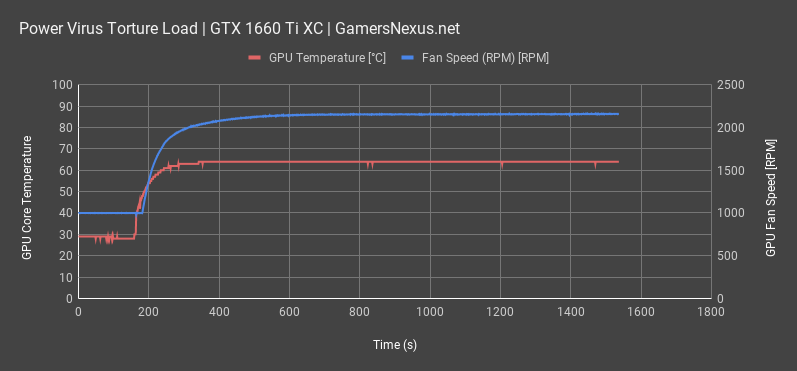
Moving to the next chart, our power virus torture workload places the GTX 1660 Ti XC’s GPU core temperature at, once again, about 64 degrees Celsius. This remains stable throughout the test period, with the fan speed ramping to about 2200RPM during this load level. Let’s just quickly swipe over to the next chart to show power consumption during the same test.
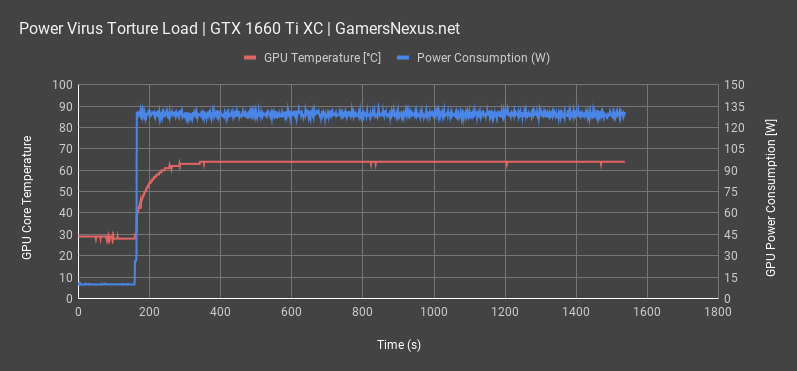
Power consumption during the same power virus workload has the GTX 1660 Ti pulling about 130W through the GPU core, oscillating a bit depending on load. Note that the power consumption is plotted against the right axis, not the left. This illustrates that this is the maximum power target for the EVGA GTX 1660 Ti XC card, and is the same as you’d see with an overclock.
Conclusion
The EVGA GTX 1660 Ti XC should theoretically be about $280, although prices weren’t posted at time of writing. Vega 56’s inbound pricing also hasn’t yet been heavily pushed, so we’re left slightly in the dark as to where final pricing falls for NVIDIA and AMD. We know EVGA is targeting $280 and we know that AMD hopes to also bring its MSRP down on Vega 56, so will write around that. Adjust our conclusion based on the numbers at time of you reading the piece, of course.
We must first state that our primary reasoning for a Vega 56 purchase remains the same and uncontested by NVIDIA: For users who just want a tuning card to play with, something that’s open to powerplay mods (for effectively unlimited power), BIOS flashes, and is relatively easy to tweak and overclock, Vega 56 remains king. NVIDIA is too locked-down to firmly recommend in the enthusiast tuner/tweaker space unless you’re doing zombie mods.
For the wider market, though, it gets significantly tougher for AMD to make an argument at the high-end. NVIDIA is uncontested in the 2080 Ti class and, until the recent Radeon VII launch, it remained uncontested in the 1080 Ti class for years. AMD has remained competitive in the RX 580/590 mid-range versus NVIDIA’s 1060 counterparts, and Vega 56 has had bouts of being competitive and uncompetitive, depending on variable market factors (mining market and availability, pricing, yields).
The GTX 1660 Ti typically outdoes the RX 590 (only falling behind in frametime consistency for F1 2018, which seems to have unique behavior) and sometimes outdoes Vega 56. The 1660 Ti trades with 56, making that the most apt price comparison. The 1660 Ti runs lower power consumption (see our Vega 56 power testing & modding here) and tests competitively in gaming, while Vega 56 is more of a tuning card for hobbyist overclockers and enthusiasts.
We will refrain from making a firm judgment between the two until we see final prices settle. The numbers in our tests should be sufficient for making that determination once prices go out, though, so look through the data and check prices once they emerge.
Editorial, Testing: Steve Burke
Video: Josh Svoboda, Andrew Coleman, Keegan Gallick