Alongside the 3900X and 3700X that we’re also reviewing, AMD launched its R5 3600 today to the public. We got a production sample of one of the R5 3600 CPUs through a third-party and, after seeing its performance, we wanted to focus first on this one for our initial Ryzen 3000 review. We’ve been recommending AMD’s R5 CPUs since the first generation, as Intel’s i5 CPUs have seen struggles lately in frametime consistency and are often close enough to AMD that the versatility, frametime consistency, and close-enough gaming performance have warranted R5 purchases. Today, we’re revisiting with the R5 3600 6-core, 12-thread CPU to look at gaming, production workloads with Premiere, Blender, V-Ray, and more, power consumption, and overclocking.
This week has been the busiest in our careers at GN. The editorial/testing team was two people, working in shifts literally around the clock for 24/7 bench coverage, and the video production team was three people (all credited at article's end, as always). We invested all we could into getting multiple reviews ready for launch day and will stagger publication throughout the day due to YouTube's distribution of content. We don't focus on ad revenue on the site these days and instead focus on our GN Store products and Patreon for revenue, plus ad revenue on YouTube. If you would like to support these colossal efforts, please consider buying one of our new GN Toolkits (custom-made for video card disassembly and system building, using high-quality CRV metals and our own molds) or one of our system building modmats. We also sell t-shirts, mousepads, video card anatomy posters, and more.
Notable changes to our testing methods, other than overhauling literally everything (workstation overhaul, gaming overhaul) a few months ago, would include the following:
- Windows has all updates applied on all platforms, up to version 1903
- All BIOS updates and mitigations have been applied
- For new AMD Ryzen CPU testing, we are using a Gigabyte X570 Master motherboard with BIOS version FC5 installed, per manufacturer recommendations
- We have changed to GSkill Trident Z RGB memory at 4x8GB and 3200MHz. The 32GB capacity is needed for our Photoshop and Premiere benchmarks, which are memory-intensive and would throttle without the capacity.
The memory kit is an important change for us. Starting with these new reviews, we are now manually controlling every timing surfaced. That includes secondary and tertiary timings. Previously, we worked to control critical timings, like primary and RFC, but we are now controlling all timings manually. This has tightened our margin of error considerably and has reduced concern of “unfair” timings being auto-applied by the various motherboards we have to use for CPU reviews. “Unfair” in this instance typically means “uncharacteristically bad” as a result of poor tuning by the motherboard maker. By controlling this ourselves, we eliminate this variable. Some of our error margins have been reduced to 0.1FPS AVG as a result, which is fantastic.
Interesting Overclocking Findings
We noticed that, interestingly, our R9 3900X and R7 3700X overclocked with much lower voltage requirements than our R5 3600. Our R5 3600 is a production sample from a third party, so we have two thoughts, here: (1) Most realistically, the R5 CPUs probably aren’t binned as aggressively as the 12-core part, which would need lower voltages for thermal reasons, and (2) the samples AMD shipped had paste left over on them and they were pretested. We don’t suspect they were binned by AMD for reviewers, though we did want to point it out. With a sample size of one each, we can’t draw conclusions -- maybe it’s luck or maybe R5 just runs with a higher voltage. The upside is that the limited R5 core count means it can take the higher voltages as there’s lower thermal density to dissipate. Our R9 3900X could do 4.3GHz all-core at 1.34V to 1.35V, the R7 3700X could hold similar voltages, but the R5 3600 required 1.43V for 4.3GHz all-core. We were able to push 4.4GHz on the 3900X with SMT disabled, shown in our 3900X review that’s still rendering at time of writing this, but we could not reach 4.4GHz on any chip under 1.46V. We stopped at 1.46V as we encountered issues with, predictably, thermals on a reasonable 280mm CLC. We’ll push harder with liquid nitrogen later in the week.
Finally, FCLK will be a big part of memory overclocking later on. We’ve done some infinity fabric FCLK tuning and found no meaningful change when memory is left to our standard test 3200MHz settings, at least not immediately, so we’ll need to table this for now and dig in more later. Keep in mind that we had to write and film 5 content pieces relating to AMD products in just a few days, so some sacrifices were made. Mostly to health, granted, but we did remove some tests from content for later benchmarking.
Finally, related to sacrificing sleep, please be advised that there are definitely going to be grammatical typos in this article. We simply don’t have infinite time, so we won’t comb through it for misspellings. Thank you for your understanding!
Let’s get started.
CPU Test Methodology
Our CPU testing methodology is split into two types of benchmarks: Games and workstation workloads, but every CPU which is sufficiently high-end will go through both sets of tests. We are beginning to spend more effort publicly documenting the exact versions of our tests, hoping that this is helpful to those reading our tests. We are also detailing more explicitly the unit of measurement in text, although our charts typically do this as well. Our workstation benchmarks include the following tests:
- 7-ZIP Compression benchmark (version 1806 x64). Unit of measurement: MIPS (millions of instructions per second; higher is better)
- 7-ZIP Decompression benchmark (version 1806 x64). Unit of measurement: MIPS (millions of instructions per second; higher is better)
- 7-ZIP dictionary size is 2^22, 2^23, 2^24, and 2^25 bytes, 4 passes and then averaged. Thread count equals the CPU thread count.
- Blender 2.79 GN Logo render (frame from GN intro animation, heavy on ray-tracing). Unit of measurement: Render time in minutes (lower is better)
- Blender 2.79 GN Monkey Heads render (CPU-targeted workload with mixed assets, transparencies, and effects). Unit of measurement: Render time in minutes (lower is better).
- GNU Compiler Collection (GCC) version 7.4.0, compiling 8.2.0 on Windows 10. Unit of measurement: Render time in minutes (lower is better). Run with Cygwin environment.
- Chaos Group V-Ray CPU Benchmark (1.0.8). Unit of measurement: Render time in minutes (lower is better)
- Cinebench R15 (used for internal validation). Unit of measurement: CB Marks (higher is better)
- TimeSpy Physics. Unit of measurement: 3DMark points & FPS (higher is better)
- Adobe Photoshop CC 2019 (Puget 18.10). Unit of measurement: Average score (higher is better)
- Adobe Premiere & AME CC 2019 (GN test suite: 1080p60 convention shot; H.264, 35Mbps, 5.2, High profile, AAC+Version 2, Audio 256K). Unit of measurement: Render time in AME (lower is better). CUDA enabled.
- Adobe Premiere & AME CC 2019 (GN test suite: 4K60 aroll+broll; H.264, 35Mbps, 5.2, High profile, AAC+Version 2, Audio 256K). Unit of measurement: Render time in AME (lower is better). CUDA enabled.
- Adobe Premiere & AME CC 2019 (GN test suite: 4K60 charts; H.264, 35Mbps, 5.2, High profile, AAC+Version 2, Audio 256K). Unit of measurement: Render time in AME (lower is better). CUDA enabled.
All tests are conducted multiple times for parity and then averaged, with outliers closely and manually inspected. The number of times tested depends on the application and its completion time. We use an internal peer review process where one technician runs tests, then the other reviews the results (applying basic logic) to ensure everything looks accurate. Any stand-out results are reported back to the test technician and rerun after investigation. Error margins are also defined in our chart bars to help illustrate the limitations of statistical relevance when analyzing result differences. These are determined by taking thousands of test results per benchmark and determining standard deviation for each individual test and product. Any product that has significant excursions from the mean deviation will be highlighted in its respective review.
GN CPU Test Bench 2019
| Product | Courtesy Of | |
| CPU | This is what we're testing! | GN, Intel, & AMD |
| Motherboard | See article, changes per CPU | Various |
| RAM | GSkill Trident Z 4x8GB 3200 CL14 | GamersNexus |
| Video Card | EVGA RTX 2080 Ti XC Ultra | EVGA |
| PSU | EVGA SuperNOVA T2 1600W | EVGA |
| CPU Cooler | NZXT Kraken X62 280mm | NZXT |
| SSD | Samsung 860 EVO 250GB | GN |
| Project/Game SSD | Samsung 860 PRO 1TB | GN |
Motherboards used are varied based upon platform. Where compatible, we used the following:
- Gigabyte X570 Master FC5
- ASUS Maximus XI Hero Z390
- ASUS Crosshair VII Hero X470
Driver version 430.86 is used. Adaptive sync is not used in testing.
MCE is always disabled on test platforms, ensuring that turbo boost durations should be running within specifications set by the CPU manufacturer. We also try to keep an eye out for other motherboard trickery, like MSI’s oft-boosted BCLK, and then reset to stock settings when applicable. XMP is used on the Corsair memory in our test benches.
CPU Frequency Check
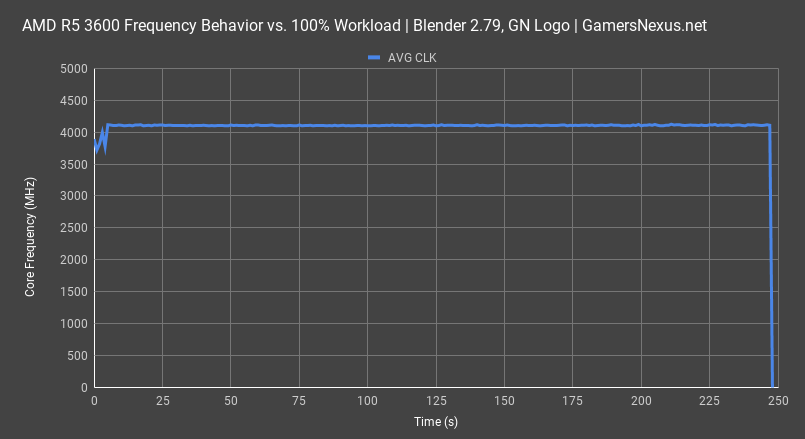
We like to illustrate CPU behavior on new architecture launches. Part of this is to look for boost duration limitations or power fluctuations, something we’ll cover next. This first chart shows frequency over time with a Blender workload, hitting all cores nearly equally. The average all-core frequency ends up at about 4104MHz. The CPU was under a 280mm CLC with 22-degree ambient for this test, so boost behavior was not thermally affected. The CPU has an advertised boost clock of 4200MHz, which will apply for workloads that don’t fully load all cores at 100%. There’s minimal fluctuation in this frequency plot and it does not appear that any boost duration limits come into play.
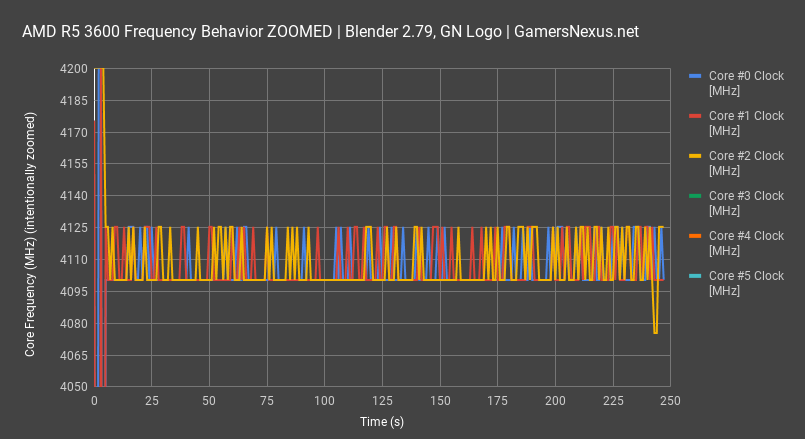
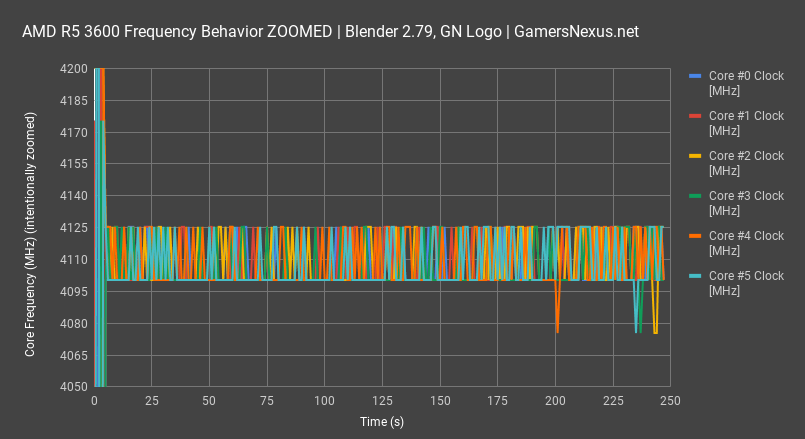
For a better view of this,, we’ll plot each core clock individually and with a Y-axis constrained to just 4050-4200MHz. The point of this is to magnify the data. As observed here, pre-testing starts with cores bouncing off of the 4200MHz limited-core turbo while still in idle. Once the work begins, the cores take turns bursting up to 4125MHz and falling back to 4100MHz, with rare dips down to 4080MHz. We’ll keep drawing other cores as we go. There doesn’t seem to be a preference for which core boosts up to 4125MHz. A pattern emerges where cores 0 and 1 pass the ball back and forth, as do cores 4 and 5. Cores 2 and 3 appear to do similar. At the end of the day, they take turns boosting.
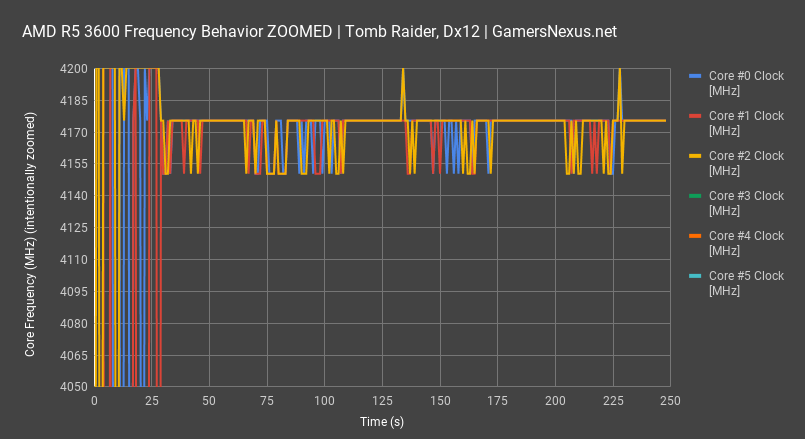
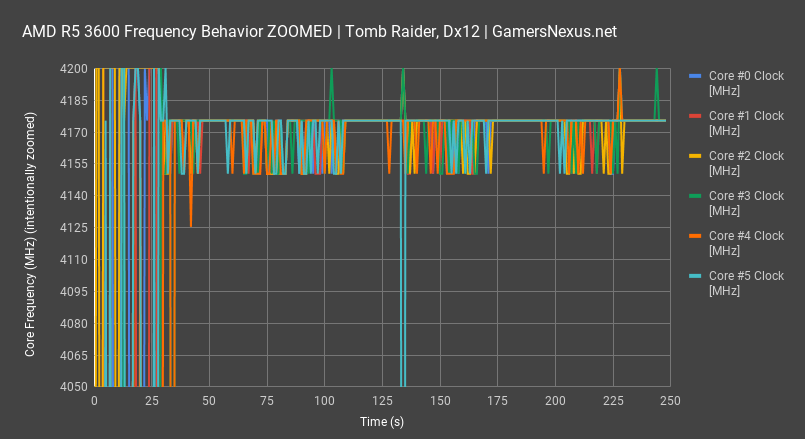
We’ll use Shadow of the Tomb Raider at 1080p to give a gaming look at frequency behavior. We’ll also skip straight to the zoomed-in chart to better highlight the boosting. In this chart, we stay closer to an average of 4175MHz boost when under heavier loads. With the lighter-threaded scenes rendered, we see single cores boost up to 4200MHz, the maximum stock boost, before falling back to 4150-4175MHz. As for the Core #5 dip below the chart range, that spike falls to about 3300MHz.
Before continuing with game benchmarks, we need a quick look at power and overclocking.
Power Testing & Overclocking
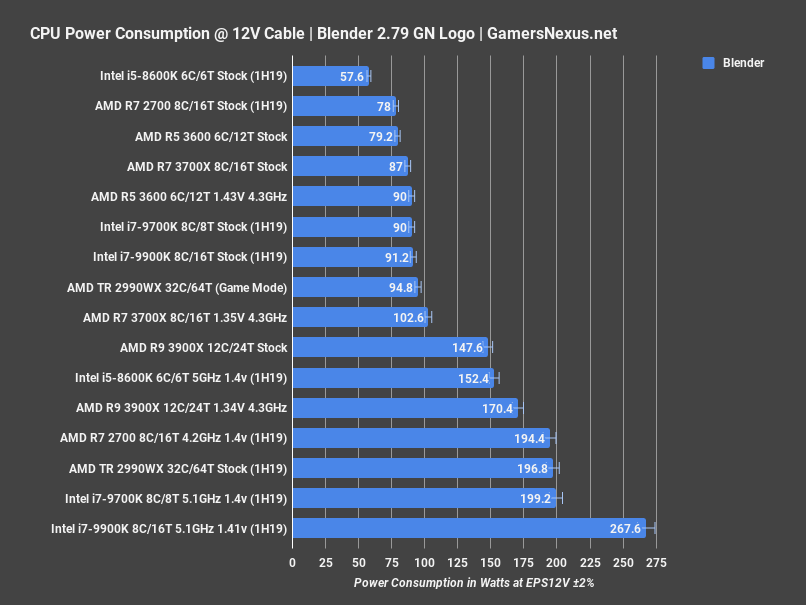
Power consumption testing is measured at the EPS12V rails, before VRM efficiency losses but after the wall. This is a much more accurate measurement than wall power and gives us a fairly direct read on CPU power consumption without all the variability and noise of the rest of the system. A full Blender workload is up first. For this test, we take measurements as they would apply to the duration of a 30-minute render, so we get a clearer picture. Note that Intel will boost beyond TDP for periods of time equal to about 20 seconds with PL1 and 100 seconds with PL2, but after that, stock Intel performance with MCE off sticks to about the TDP rating. That’d be 90W on the 9900K, roughly, and 90W on the 9700K. The AMD R5 3600 measured at 79W stock on the Gigabyte Xtreme. Our 3600 silicon is much worse than our 3900X and 3700X silicon, so the overclock requires 1.43V to hold 4.3GHz all-core. This lands us at 90W down the EPS12V rails with all power limits manually disabled. This is the only chart that will contain the R7 and R9 data for our 3600 review, but briefly: The R7 3700X stock CPU consumes about 87W when stock and 103W when overclocked to 4.3GHz at 1.35V; note that our voltage required here goes down one full step from the 3600, but core count has gone up. This is a silicon quality advantage, and that carries to the 3900X. Our 3900X could hold 4.3GHz all-core, across all 12 cores, at just 1.34V. This nets a 170W power consumption, but more importantly, we’re able to run both the 3700X and 3900X with lower power consumption in lightly threaded workloads than stock/auto with the motherboard. The motherboard pushes higher voltage than the CPUs need, and so we can clock higher with lower voltage and power requirements, and therefore heat requirements, when working manually. We’ll talk about this more in our 3700X and 3900X reviews.
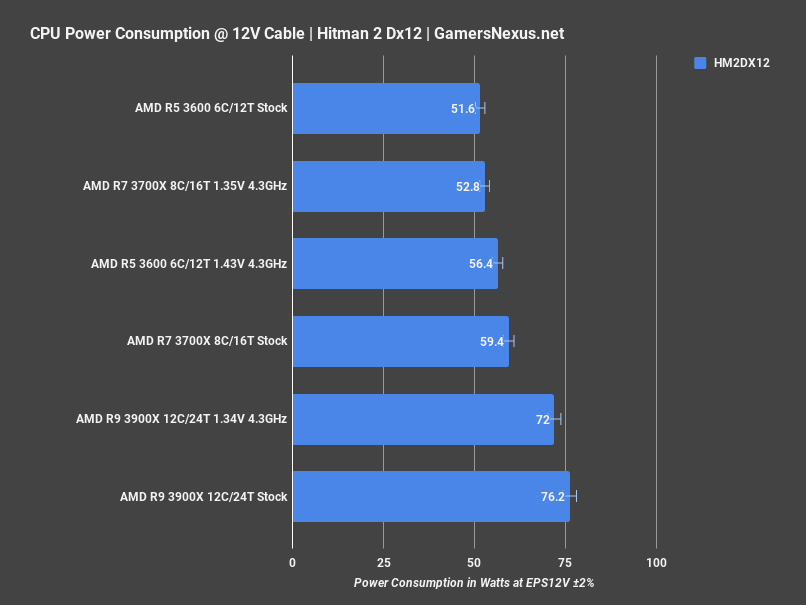
Hitman 2 quickly gives us another look at power. For this one, the 3600 stock CPU stays within AMD’s defined spec of 65W TDP, noting that TDP on a processor box is slightly different than actual power through the socket, but not by much. We were outside of spec in Blender, but within spec for a more lightly threaded gaming workload. The 3600 measured at 52W, overclocking pushed us to 56W, and the 3900X ran at about 76W when stock, or 72W overclocked. That’s not variance or margin of error, that’s because we were able to pull lower voltage than the stock motherboard BIOS assigns by manually tuning, but still pulling a higher frequency.
Let’s move to game benchmarks.
Games - Total War: Warhammer 2 Battle Benchmarks
We use two of Total War: Warhammer 2’s baked-in benchmarks, starting with “Battle,” designed to test performance on the RTS map. We also test with the campaign for a look at the turn-based vantage point. Strategy games are a good place to demonstrate performance for CPUs as AI processing is often CPU-intensive.
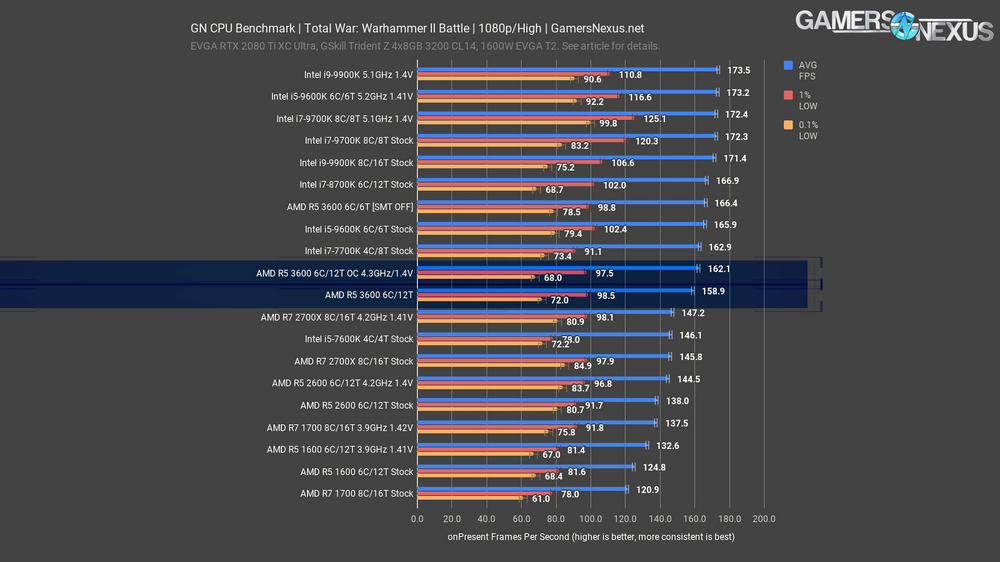
The higher-end Intel CPUs approach a GPU bottleneck with a maximum average FPS of 173.5 for the 5.1GHz 9900K OC. AMD’s R5 2600 and R5 1600 came nowhere close to this limit, with the overclocked 4.2GHz R5 2600 maxing out at 144.5FPS average. The R5 3600 makes a big step towards closing that gap, with a stock average of 158.9FPS, a 27.3% improvement over the stock 1600 and a 10% improvement over even the overclocked 2600’s 4.2GHz score. Overclocking the 3600 yielded a minor 3 FPS improvement to 162FPS AVG, but leaving the frequencies stock and disabling SMT bumped the 3600’s score up to equal the stock 9600K, placing at 166FPS AVG. We’ve observed in the past that TWW2 and some other games can react negatively to hyperthreading or SMT, so this is one way of levelling the field with the 6C/6T 9600K. We first broke this information in the first generation Ryzen reviews, and it seems that this persists here. We wouldn’t recommend actually disabling SMT, as the usefulness is a wash between games and, ultimately, it is better to have the extra threads. This is more of an academic exercise to demonstrate behavior of Zen2. As for the 9600K, the stock performance leads the stock 3600 by 4.4%. They’re close enough that other applications may matter more than this delta. We’ll look at production workloads later. There is no meaningful difference in the low performance metrics.
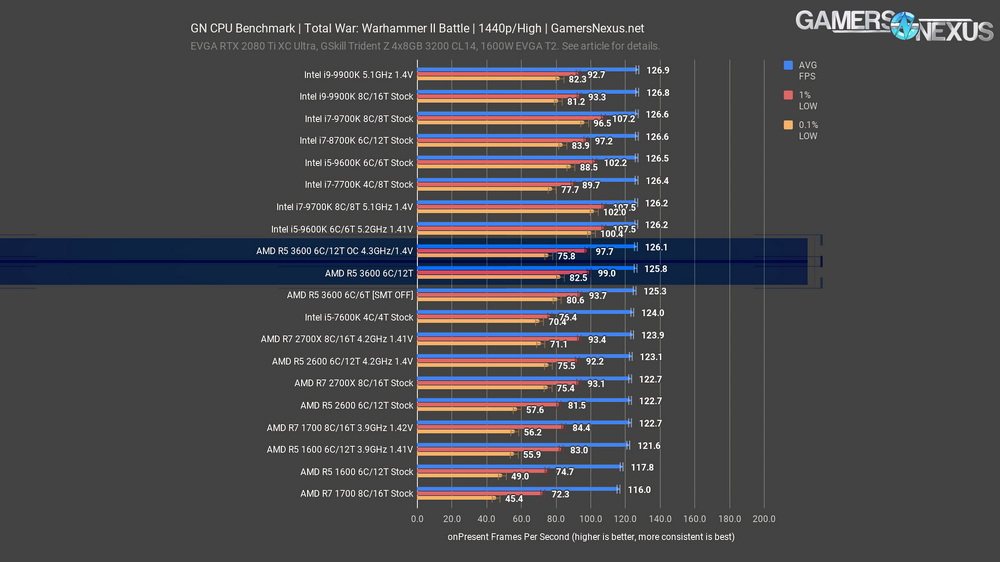
The Total War 1440p battle benchmark is a GPU bottleneck, so we can’t see CPU differences. We’ll move on from this chart and leave discussion in the article.
The TWW2 1440p Battle benchmark continues to be one of our most heavily GPU-bound tests, with only the stock R5 1600 and R7 1700 averaging below 120FPS. Neither overclocking or disabling SMT on the 3600 had much effect here, as we’re up against the GPU limit. As an aside, the 9700K and 9600K overclocks did yield notably higher low frametime performance than the rest of the pack. Before anyone gets confused about why some of these CPUs appear better or worse than is sensible, remember again that we’re bottlenecked on the GPU, so as a CPU test, this is invalid for comparison. It is valid, however, for demonstrating that a sufficient GPU limit does begin to constrain the importance of CPU performance.
Games - Total War: Warhammer 2 Campaign Benchmarks
The second Total War: Warhammer 2 benchmark uses the campaign map seen in the grand strategy portion of the game. It’s much more CPU dependent than the Battle benchmark.

At 1080p, the R5 3600’s stock 155FPS AVG shows a ~7% improvement over the 2600 overclocked to 4.2GHz and ~33% over the stock 1600, beating out the full range of older 6C/12T AMD parts, overclocked or not. Overclocking the 3600 itself was as ineffectual in this test as it was in the TWW 2 Battle benchmark, but again disabling SMT offered a boost to performance that made the 3600’s performance around the stock 9600K’s, both at 161-165FPS AVG. That’s stock frequency versus stock frequency, though, and the 9600K has much more overclocking headroom, with a 13.3% FPS improvement from stock to 5.2GHz in this test, ending at an impressive 183FPS AVG.
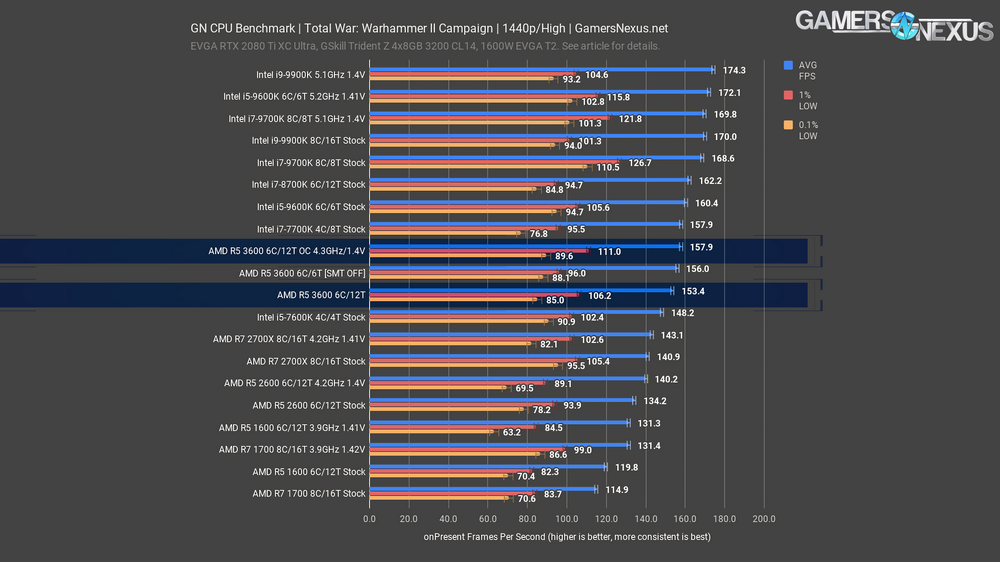
The 1440p results aren’t GPU bottlenecked like they were in the Battle benchmark, but that also means much of the chart lines-up with the 1080p results. The 3600 with SMT disabled lost some of its edge here, with the OC 3600 outperforming it slightly and the stock 9600K just beyond that.
Games - F1 2018 Benchmarks

F1 2018 is up next, a DirectX 11, standard implementation of a game on the EGO Engine. F1 2018 runs at higher framerates than any human could require in our 1080p testing, but it still shows good scaling between CPUs. The stock 3600’s 267FPS AVG is again well ahead of the previous best score for a 6C/12T AMD part, surpassing the OC 2600’s 235FPS by 13.7% and the old stock AMD R5 1600 by 34%. Overclocking the 3600 again had very little effect: AMD’s done a good enough job of boosting per-core frequency that it’s difficult to improve performance with an all-core overclock, at least in lightly-threaded applications like games. F1 is another title where disabling SMT raises performance, although not quite to the level of the 9600K this time; we climb to 273FPS AVG with SMT off and stock clocks. It’s possible that disabling hyperthreading would give a slight boost to many of the CPUs on our chart, but it’s rarely worth going into BIOS and cutting a CPU’s threadcount in half for a minor performance increase in some video games. The only reason we’re treating this CPU differently is because it’s a new CPU architecture and we want to see if SMT overhead has changed in two years.

Here’s a quick frametime chart with F1 2018 at 1080p. Remember, lower is better, but more consistent is better than just being lower. Overall, the R5 3600 remains close to 4.3-5.0ms frame-to-frame intervals here. We typically don’t notice stutters unless there’s an excursion equal to or greater than 8-12ms, something that only happens once in this benchmark, and it happens on both the 9600K and 3600 at the same spot in the test. Overall, these two processors have similar frametime pacing and consistency, with the 9600K faster by 0.3ms on average.
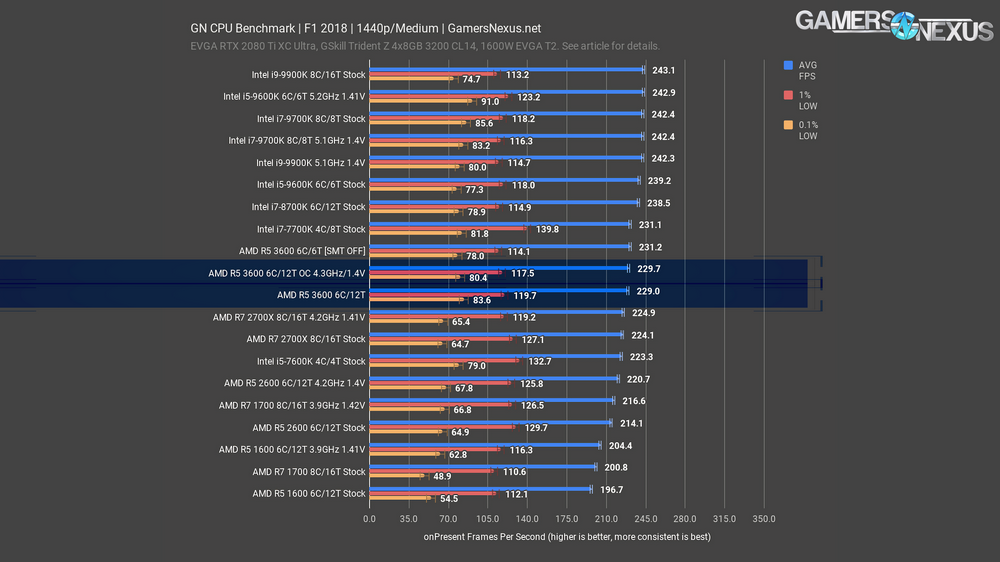
The CPUs at 240 FPS average and above are almost entirely GPU limited, but all of our 3600 results fall just short of that range. The narrower range of results means that all three--stock, OC, and SMT disabled--averaged almost exactly the same. The 9600K still won-out by about 4.5% stock versus stock, technically speaking, although the value of the 3600 is a tough match for it, particularly in later tests. The top-end of the results hit the GPU limit, so note that all differences are within error margins. That’s why the 9900K OC isn’t at the top -- they’re bouncing off of limits, and so any delta is just run-to-run variance.
Games - Civilization VI
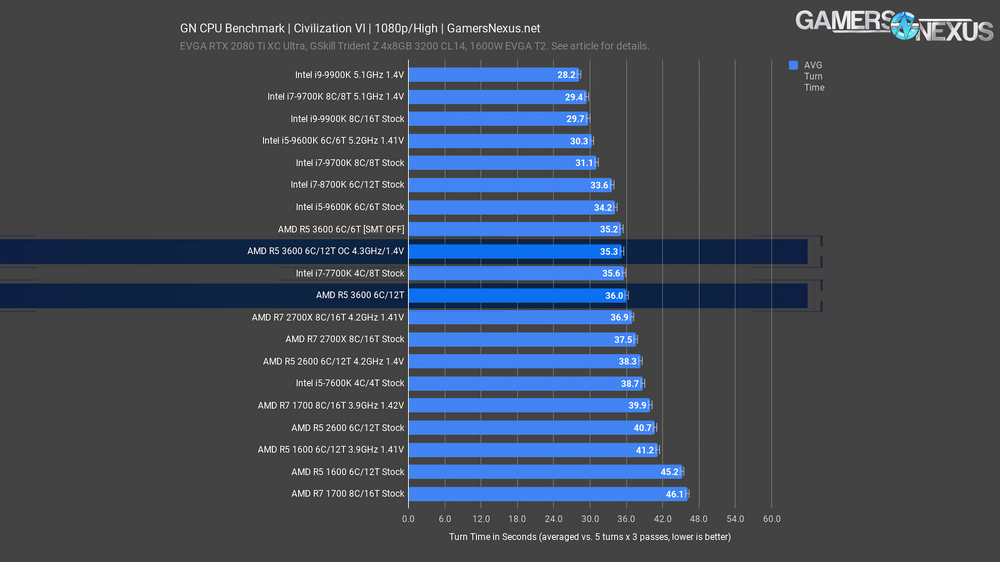
We do multiple passes of the new Gathering Storm AI benchmark for Civilization VI, each of which takes an average completion time for five turns, and then average those numbers together. It’s the only game test we do that doesn’t measure frametimes, and the results are extremely consistent. We look at turn time instead, as this is entirely CPU dependent and heavily impacts how enjoyable the experience is. Unfortunately, despite being an AI benchmark, it shows a strong preference for frequency over thread count as can be seen by the R5 1600 (3.2GHz base) outperforming the R7 1700 (3GHz base). The 9600K stock took 34 seconds to complete each turn, reducing average turn time by 5% versus the R5 3600 stock, and the overclocked 9600K is far beyond the overclocked 3600 in performance at 30.3 seconds versus 35.3. Multiplied across all 5 AI turns, that means it’d take an extra 25 seconds per turn for the human player to have input again, and that’d be more exaggerated as the game grows complicated.
Games - Assassin’s Creed: Origins

Assassin’s Creed Origins has revealed itself to be one of the most balanced titles we test in terms of benefitting from frequency and high core count. Disabling SMT had an appropriately negative result for once, so it’s the stock 6C/12T 3600 result that slightly edges out the 9600K by 1.1 FPS. Interestingly, the overclocked results for the two CPUs are fairly close as well: the 12 threads of the 4.3GHz 3600 bring it closer to the 5.1GHz 9600K than usual, with only a 7.4% advantage for the Intel chip. The 3600 is also the first of the AMD X600 CPUs to break 60 FPS in the 0.1% lows, which it does even at stock frequencies.
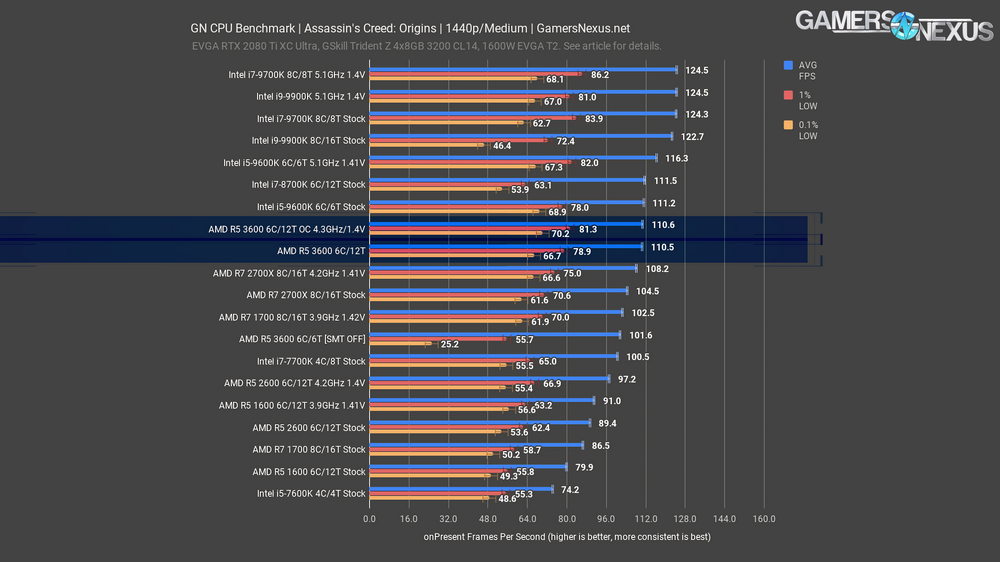
The 3600, 3600 OC, and stock 9600K are all within margin of error of each other at 1440p, with results pushed closer together by GPU constraints. The 9600K OC still has the advantage, though.
Games - GTA V

The oldest game on our bench still has some life left in it thanks to some settings tweaks to further load the CPU. It’s another title where disabling SMT allowed for a performance increase of a few FPS, but not past the stock 9600K this time. Frequency is important in this title, and the lack of major improvement with the 3600 overclocked again indicates how close the stock boost frequencies already are to the maximum achievable all-core overclock. We’ll be interested to see whether the 3600X can justify its $50 higher price with what seems like very little room for improvement. AMD’s generational improvements are as strong as ever here, with a 20.7% improvement over the stock 2600 and a 37.4% improvement over the stock 1600.
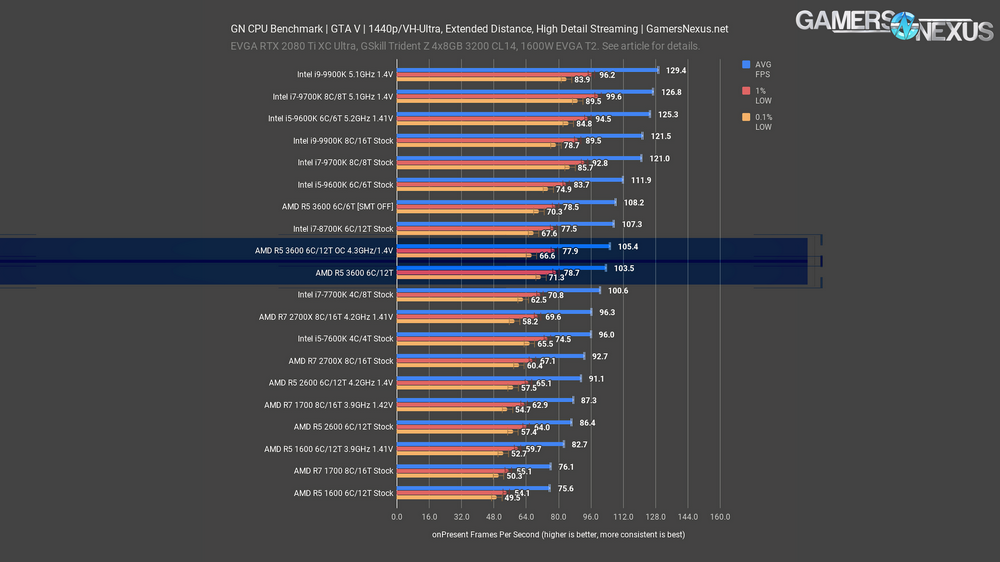
Scaling between 1080p and 1440p is almost perfect for GTA V, with only the nearly-tied OC 2700X and the stock 7600K trading places. The FPS numbers themselves are also barely changed, meaning we’re a healthy distance from a GPU bottleneck or the observed FPS cap of about 187.
Games - Shadow of the Tomb Raider

Shadow of the Tomb Raider is another one of the minority of games where leaving SMT enabled gave us better results. The stock 3600 showed an 18.3% improvement in average FPS over the stock R5 2600, but with barely any further improvement from overclocking. The generational improvements are big, but it’s the same story as it has been: manufacturers squeeze performance out of parts more efficiently, stock performance goes up, and overclocking headroom goes down. The 9600K is one part that still has some room left, though, and the 5.1GHz OC put it 13.2% ahead of the overclocked 3600.
Games - Hitman 2
Due to popular demand, we’ve switched to DX12 for our Hitman 2 testing. DX12 support was patched into the game relatively recently and any previously published benchmarks from us were done using the DirectX 11 version of the game. Note that Dx11 has better frametime performance than Dx12, but so many people seemed to prefer a different graphics API that we decided to just move to it, even though frametime performance is worse.
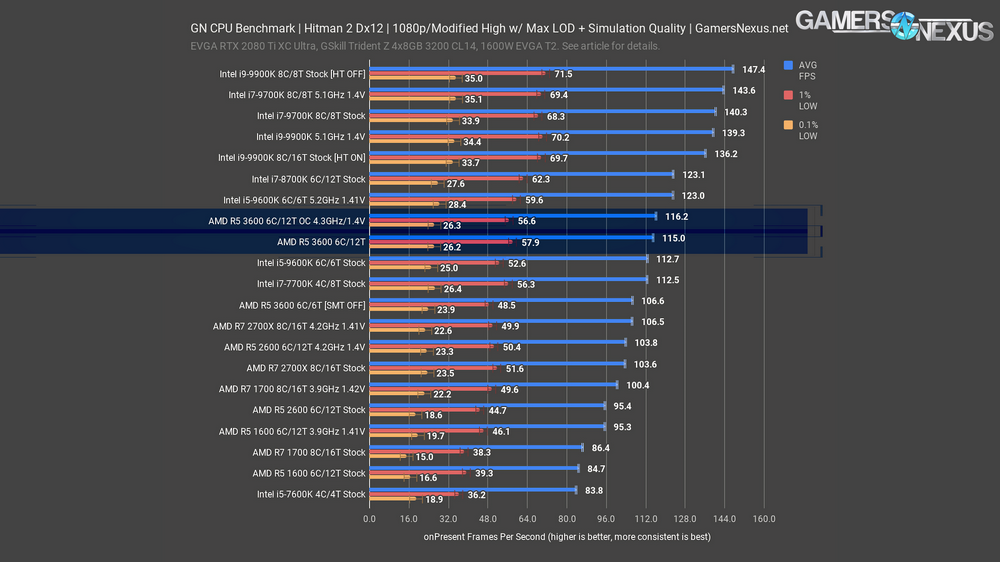
Hitman 2 showed a reassuringly strong preference for SMT on rather than off, with a 7.9% improvement from the extra threads, slightly better even than the 6C/6T stock 9600K. Our testing with the 8C/16T 9900K showed much better results with hyperthreading disabled across multiple tests and retests, and 16 threads isn’t exceeding some threshold because the 8C/16T 3.9GHz 1700 outperforms the 6C/12T 3.9GHz 1600, so it must be down to how Hitman 2 treats thread count. The 4.3GHz overclock on the 3600 was as disappointing as it was in every other test, leaving Hitman 2’s universally bad 0.1% lows unaffected. For this CPU, you’re really getting so much out of stock performance that a higher power-consuming OC is getting tough to argue in games. The R5 3600’s out-of-box performance is highly competitive with Intel’s similarly priced CPUs already, including in games, and a big leap over the previous two generations.
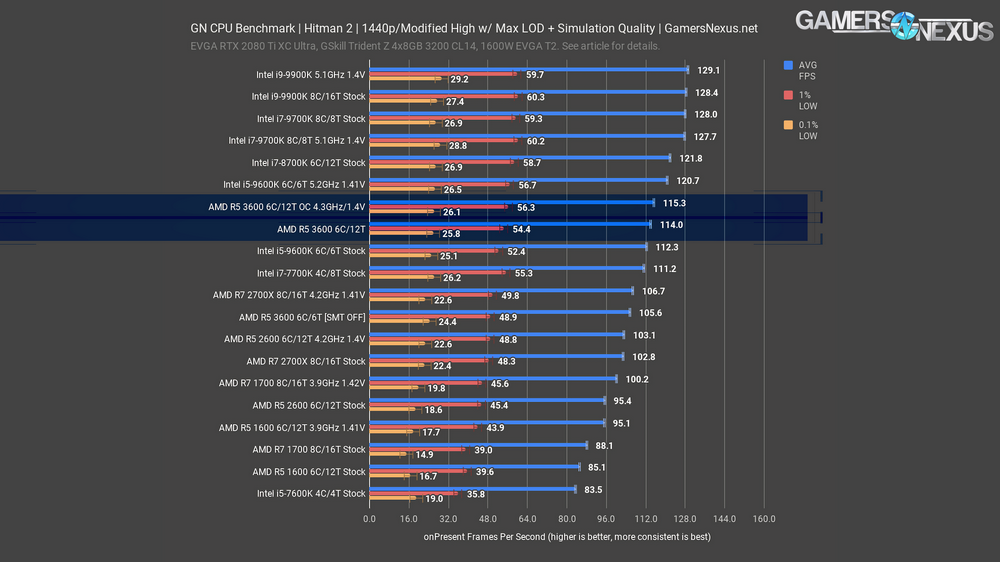
The 1440p results stack up the same way the 1080p results did: 9600K OC better than 3600 OC but by a smaller than usual margin, 3600 stock just barely better than 9600K stock, and the 3600 with SMT disabled trailing well behind the normal 6C/12T result.
PRODUCTION BENCHMARKS
GNU Compiler Collection
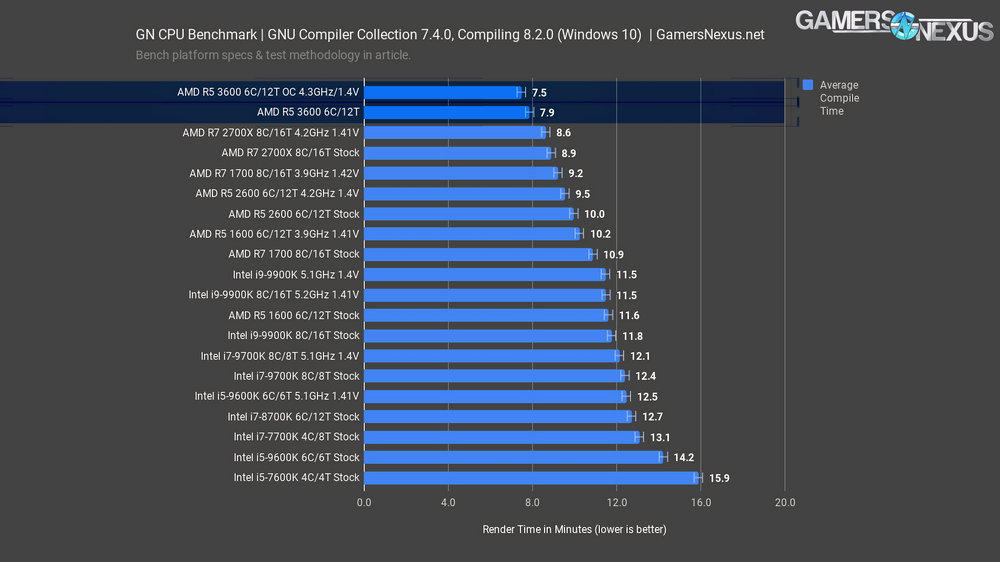
Our GNU Compiler Collection benchmark is basically a cache benchmark, something that’s illustrated clearly by this chart. This demonstrates how quickly the CPU completes our code compile benchmark; it is not, however, benchmarking compilers or testing compile quality. The faster and higher core count CPUs, and especially Intel CPUs, would do better in some other code compile environments, but compiling GCC with GCC is “cache hits all the way down,” as Wendell of Level1 Techs described it to us. In this respect, we can functionally use this test as an illustration of the impact of having so much L3 cache. By all counts, the overclocked 2700X should win against an R5 3600, but the 3600 has 35MB of L3 cache to the 2700X’s 16MB of cache, and that’s why the 3600 wins this chart. If you happen to work in a similar environment to this, basically Cygwin or Mingw compiling on Windows, the higher cache will help. We may have accidentally discovered AMD’s new favorite benchmark, as one of our Patreon subscribers noted.
7-Zip Compression & Decompression
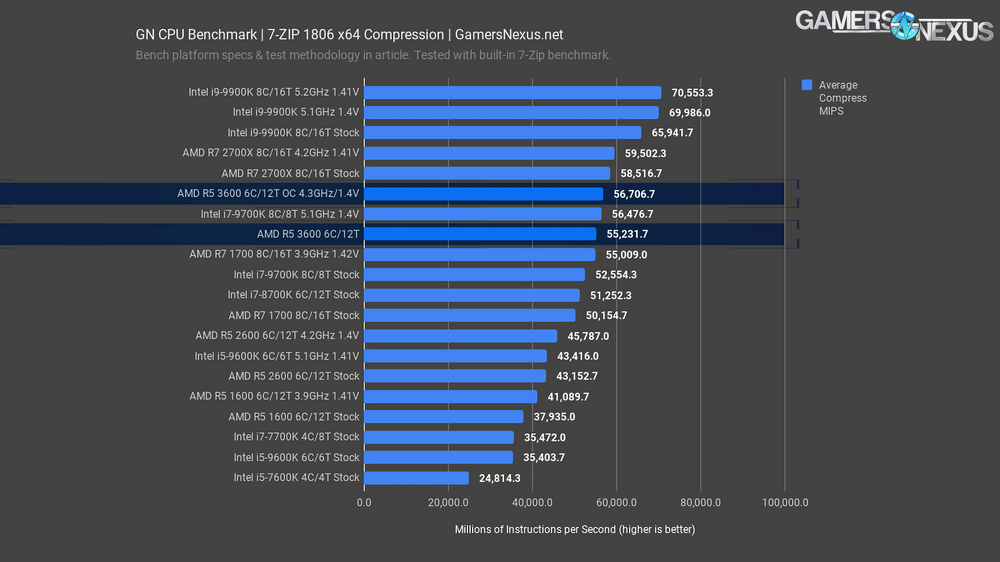
Our next benchmarks are for compression and decompression with 7-Zip.
With compression, the R5 3600 pushes 55,000 million instructions per second, ranking it between the 1700 at 3.9GHz and 9700K at 5.1GHz. The bigger story is that a 3600 at 4.3GHz all-core performs about where a 5.1GHz 9700K does and not distant from the 2700X stock CPU. Generationally, we see an improvement of 27% over the 2600 and 46% over the R5 1600 CPUs.
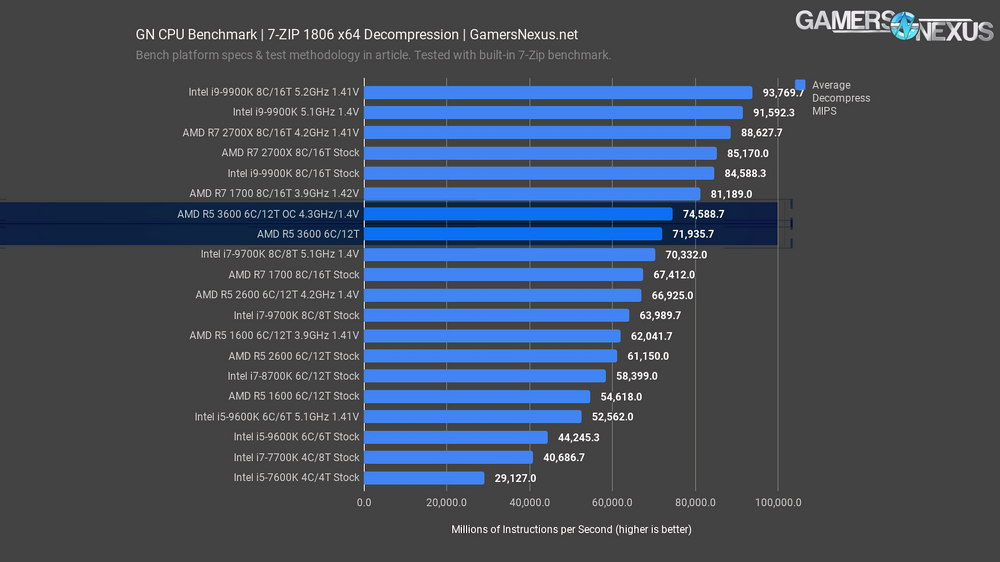
Decompression is next. In this test, the R5 3600 pushes 72,000 MIPS, roughly tying it with a 9700K at 5.1GHz and holding a strong lead over the price comparative 9600K, which isn’t even in consideration, at this point.
Adobe Photoshop CC 2019 CPU Benchmark
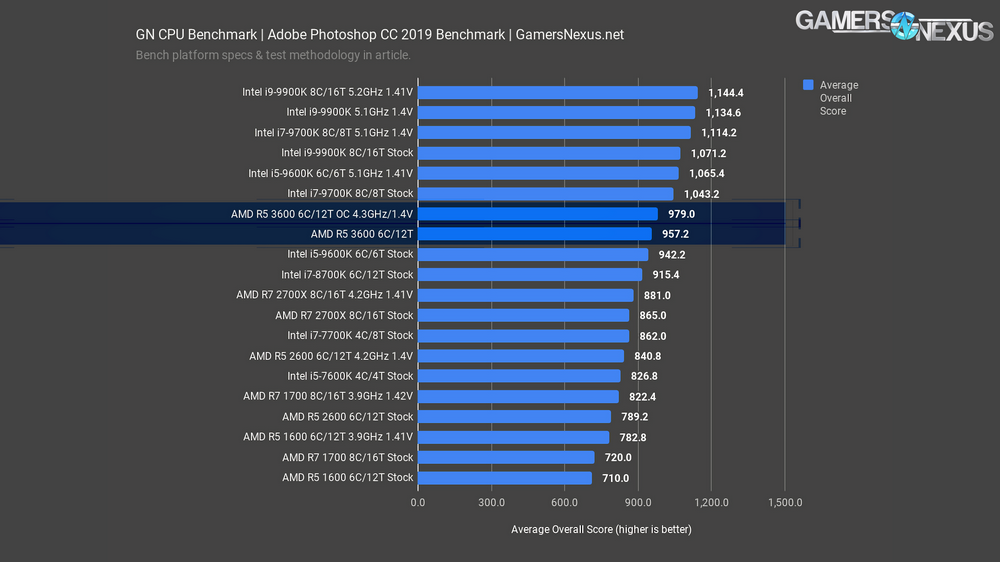
Adobe Photoshop is up next. Like Premiere, Photoshop prefers frequency first. Performing transforms, warps, applying filters, color changes, and resizes, we see the 9900K illustrate what Photoshop likes in a processor. The 9700K’s 5.1GHz result being so close to the 9900K’s 5.1GHz result is useful for demonstrating that frequency matters first for Photoshop. The R5 3600 ends up nearly tied with the i5-9600K stock CPU, leading it by about 2%. Overclocking the R5 3600 gets it to 979 points, an improvement of just 2.3%. The 9600K with an overclock leaps by 13%, from 942 points to 1065 points. AMD’s R5 can hold its own here, but frequency dependence in Photoshop does shift the recommendation to be less strongly towards the 3600.
Blender CPU Benchmarks
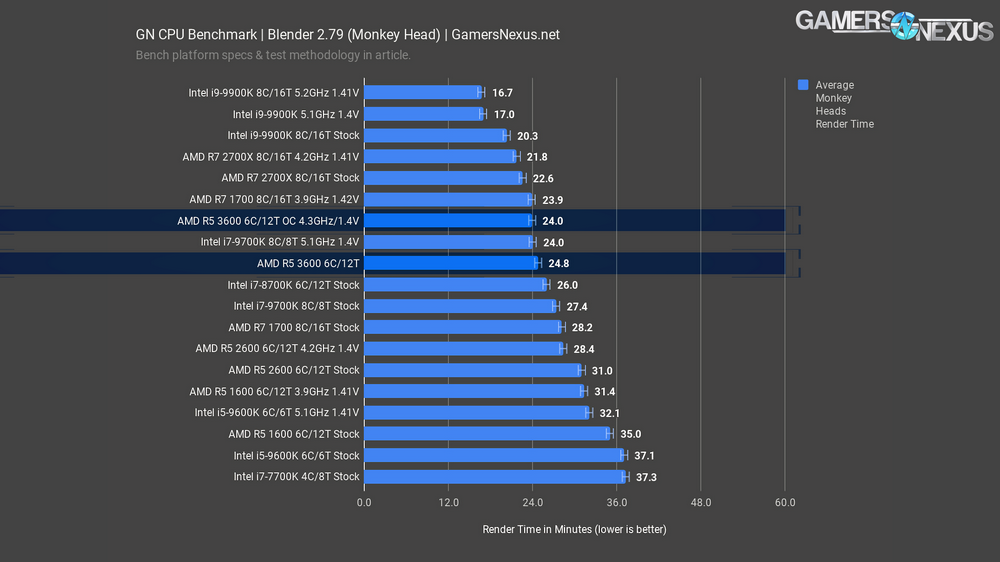
Blender 2.79 is next. This is a real application for 3D modeling and animation, and is the very one we used for our GN intro animation in these videos. The GN Monkey head render gives CPUs a mixed but heavy workload to crunch. For this one, the R5 3600 stock CPU finishes in 24.8 minutes, ranking it as faster than the 8700K and just under a minute slower than the 5.1GHz 9700K. Blender has an organic use for the high core count on AMD’s mainstream CPUs and doesn’t lean as heavily on frequency, though it obviously still matters. Generationally, the R5 3600 finishes the render faster than the R5 2600’s 31-minute result by 20%, with the 1600’s 35-minute result reduced by 30% on the 3600. The 3600 completes the render significantly faster than Intel’s similarly positioned 9600K stock and overclocked results. Overclocking the 3600 ties it with the R7 1700 at 3.9GHz, illustrating that AMD has brought $330 performance from 2017 to the $200 price class in 2019.
![]()
The GN logo is a heavier workload. Not much changes, but the 9700K at 5.1GHz moves up the ranks more than earlier, meeting the 2700X. The R5 3600 is close to both of these when stock, and an overclock gets it only a time reduction of 4.2%. Not much from the limited OC headroom in this one.
Adobe Premiere CC 2019 CPU Benchmarks
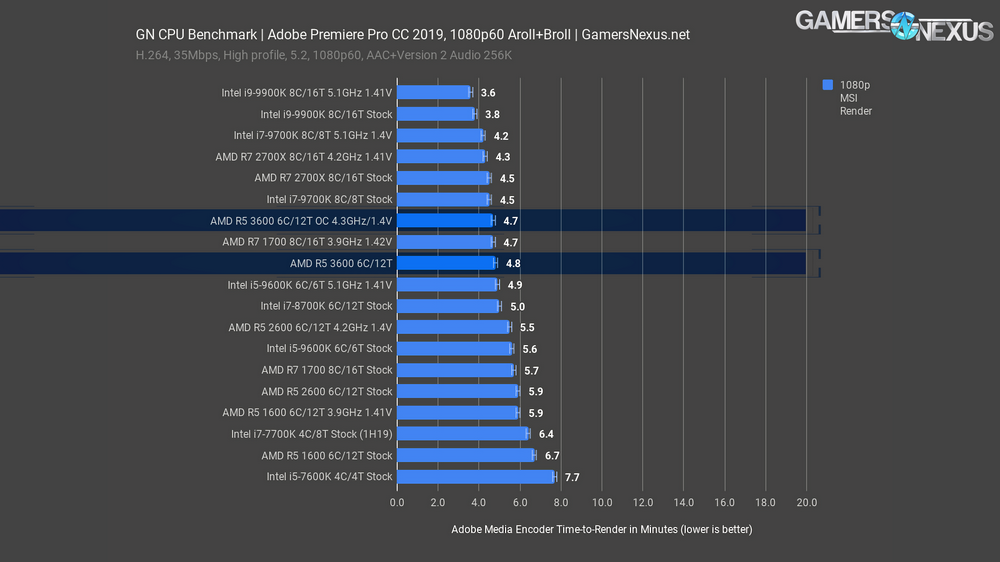
Our Adobe Premiere benchmarks are next, using a 1080p show report project with a-roll and b-roll, followed by a 4K project that’s heavily comprised of b-roll shots. We’re rendering without the IGP, in the case of Intel, so there would be some potential performance uplift if IGP use is acceptable in your organization.
The 1080p show report renders in 4.8 minutes on the AMD R5 3600; as discussed in the past, Premiere and Photoshop are still heavily frequency-dependent, but the R5 3600 does well to reduce render time versus the stock R5 2600’s 5.9-minute result. An 18% decrease in render time, stock-to-stock and generationally, is a major lift where AMD needed it. AMD has been weak in Adobe applications, so the IPC and clock increase help here. For reference, an overclocked 2600 rendered the file in 5.5 minutes, with the 1600 stock CPU from 2017 rendering it in 6.7 minutes, making the 3600 about 28% less time-intensive.Compared to the i5-9600K, a processor with comparatively fewer threads, AMD’s R5 3600 finally begins to pull ahead in one of AMD’s weakest realistic production workloads. Intel’s stock 9600K and its 5.6-minute result sits closer to the R5 2600 at 4.2GHz. Overclocking the Intel CPU to 5.1GHz, it ends up about tied with the 3600. The R5 3600 finishes in about the same time as the 3.9GHz 1700 from a few years ago, basically a 1700X, for reference, and not far behind the i7-9700K. Intel’s i9-9900K is still the leader in the non-HEDT space for Adobe Premiere. If your job involves making videos, especially with similar settings to what you’d find in our own, you’re probably still going to want to use the 9900K or similar for a cheaper professional solution.
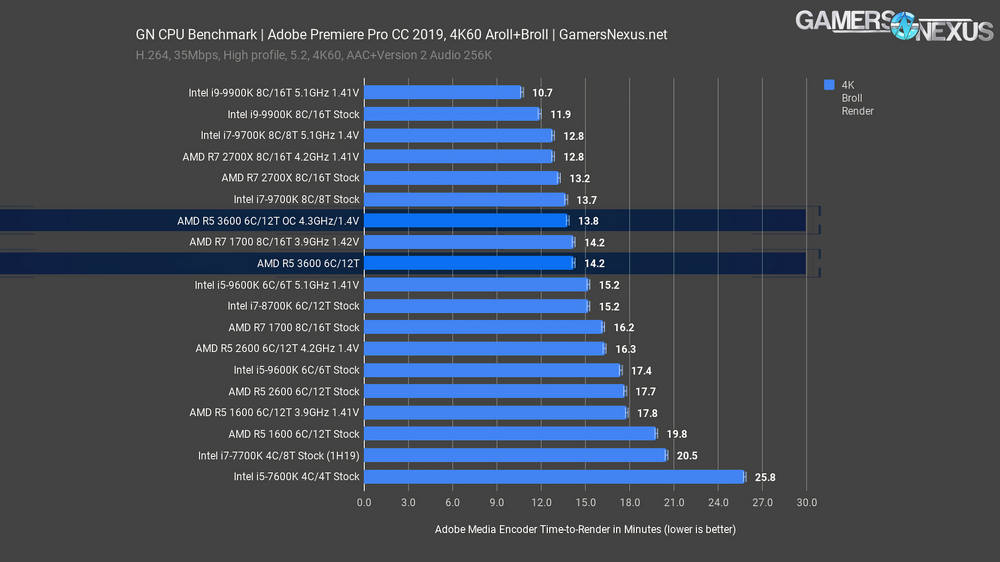
The 4K render is a heavier workload. For this one, the Intel i9-9900K predictably chart-tops at 11.9 minutes stock. More relevant to our conversation today, the R5 3600 finishes the render in 14.2 minutes, allowing the more expensive 9900K a time requirement reduction of 16% when both are stock. The R5 3600 outperforms the stock 9600K with an 18% time reduction, further managing to finish in 7% less time than the overclocked 9600K. Generationally, the R5 3600 stock CPU outperforms the stock 2600 CPU’s 18-minute result by about 20%, or about 28% shorter time than the R5 1600’s 19.8-minute result. Finally, an overclock on the R5 3600 allows it to finish in about 3% less time than the stock 3600.
V-Ray
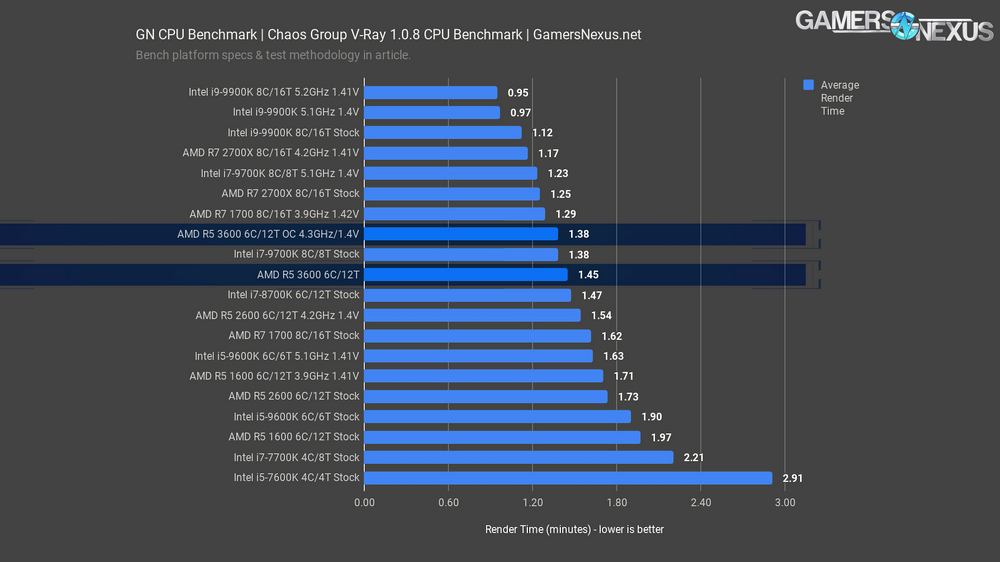
V-Ray is a popular application by Chaos Group that workstation users have requested in our benchmarks. This one is measured in render time by minutes, so lower is again better. The R5 3600 CPU finishes the V-Ray benchmark render in 1.45 minutes, landing it near an i7-8700K stock render time and ahead of the 1.54-minute R5 2600 4.2GHz render time. Generationally, the R5 3600 stock CPU completes the render in 16% less time than the R5 2600 stock CPU’s 1.73-minute render, or about 26% faster than the R5 1600 stock CPU. The R5 3600 finishes the render in about 23% less time than the Intel i5-9600K, illustrating that V-Ray does actually utilize the threads. Overclocking the 9600K closes the gap, ranking at 1.6 minutes, but it’s not enough. The 3600 with an overclock is near the R7 1700 at 3.9GHz, and overclocking an R7 2700 would get you to about R7 2700X levels of performance, or 1.25 minutes. This again shows that there may be even better value with buying a 2700 CPU and overclocking it; at least, there would be for some workloads.
Conclusion
For a video maker with a stricter budget, the AMD Ryzen 5 3600 is superior to its immediately price-matched competition from Intel, although you may be better served by purchasing an R7 2700 on steep sale and overclocking it. That’d land you at our overclocked 2700X result of 4.3 minutes for the 1080p Premiere render and would cost about $200 today, but that inventory will stop being made at some point, if not already. Even in the $200-$250 range, there’s no point in buying a 9600K if Premiere will be part of your regular activities, or any rendering software that can make use of more than six cores. We’ll be doing streaming benchmarks later as part of our ongoing Ryzen 3000 coverage, but for now we can at least say that the 3600 is the better choice for streamers that plan to edit and render footage.
If AMD is its own biggest competition, then they’ve done a great job on the gaming side of differentiating the 3600 from the 2600 and 1600, X SKUs or otherwise. There are significant generational improvements over the other 6C/12T parts with clocks being pushed closer to the max out of the box--there’s still freedom to overclock, but there’s less and less point to pushing an all-core OC on AMD parts at room temperature. We’re hoping for better results from Precision Boost Overdrive, so stay tuned for that testing. The i5-9600K outperforms the 3600 in most of our game benchmarks as games have been slow to adapt to CPUs with more than 8 threads, and the 5GHz+ overclocking potential of the 9600K makes it an even clearer winner for exclusively gaming, but the R5 3600 is the more versatile and potentially cheaper option at $200 MSRP. The big question is whether the $250 R5 3600X that AMD (not us) bills as their 9600K competitor will be worth the extra money, or whether it’s a repeat of first generation Ryzen where R7 1700s could be clocked to the same speeds as 1800Xs.
Our content is made possible by your support, especially via the GN Store products and Patreon. If you would like to support these colossal efforts, please consider buying one of our new GN Toolkits (custom-made for video card disassembly and system building, using high-quality CRV metals and our own molds) or one of our system building modmats. We also sell t-shirts, mousepads, video card anatomy posters, and more.
Editorial & Test Lead: Steve Burke
Editorial, Testing, Data Validation: Patrick Lathan
Video: Andrew Coleman, Josh Svoboda, Keegan Gallick
Quality Control: Keegan Gallick, Steve Burke