GTX 1070 SLI Benchmark vs. GTX 1080, GTX 1070 - Determining Best Value
Posted on
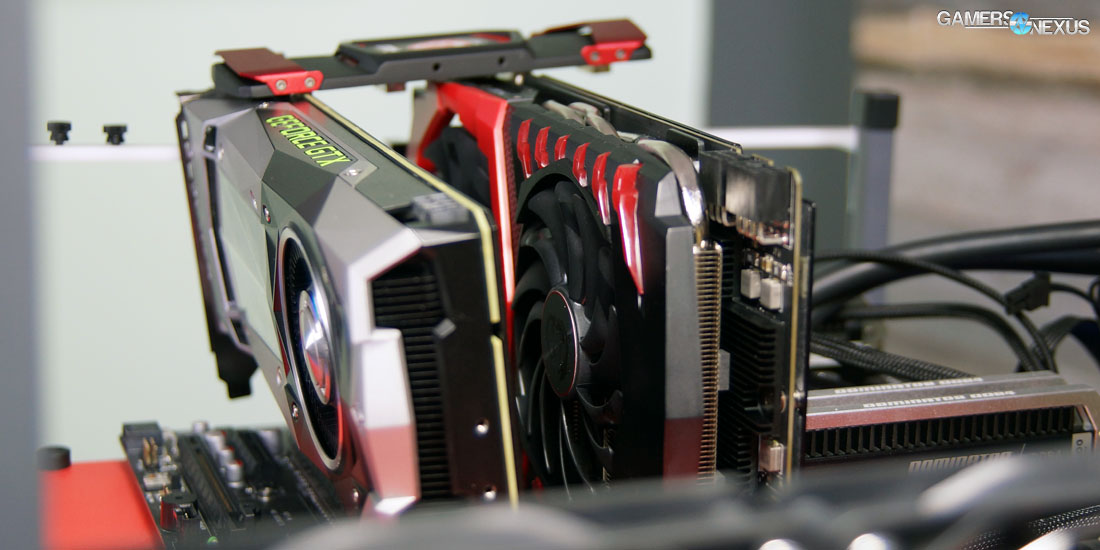
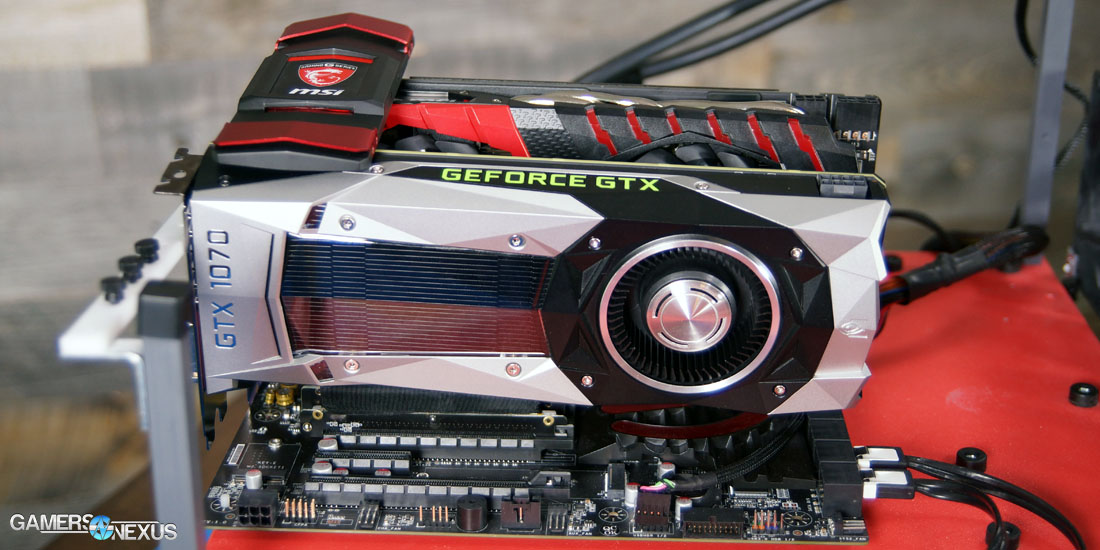
Our GTX 1070 SLI benchmarking endeavor began with an amusing challenge – one which we've captured well in our forthcoming video: The new SLI bridges are all rigid, and that means cards of various heights cannot easily be accommodated as the bridges only work well with same-height cards. After some failed attempts to hack something together, and after researching the usage of two ribbon cables (don't do this – more below), we ultimately realized that a riser cable would work. It's not ideal, but the latency impact should be minimal and the performance is more-or-less representative of real-world SLI framerates for dual GTX 1070s in SLI.
Definitely a fun challenge. Be sure to subscribe for our video later today.
The GTX 1070 SLI configuration teetered in our test rig, no screws holding the second card, but it worked. We've been told that there aren't any plans for ribbon cable versions of the new High Bandwidth Bridges (“HB Bridge”), so this new generation of Pascal GPUs – if using the HB Bridge – will likely drive users toward same-same video card arrays. This step coincides with other simplifications to the multi-GPU process with the 10-series, like a reduction from triple- and quad-SLI to focus just on two-way SLI. We explain nVidia's decision to do this in our GTX 1080 review and mention it in the GTX 1070 review.
This GTX 1070 SLI benchmark tests the framerate of two GTX 1070s vs. a GTX 1080, 980 Ti, 980, 970, Fury X, R9 390X, and more. We briefly look at power requirements as well, helping to provide a guideline for power supply capacity. The joint cost of two GTX 1070s, if buying the lowest-cost GTX 1070s out there, would be roughly $760 – $380*2. The GTX 1070 scales up to $450 for the Founders Edition and likely for some aftermarket AIB partner cards as well.
Full GTX 1070 Specs Listing
| NVIDIA Pascal vs. Maxwell Specs Comparison | ||||||
| Tesla P100 | GTX 1080 | GTX 1070 | GTX 980 Ti | GTX 980 | GTX 970 | |
| GPU | GP100 Cut-Down Pascal | GP104-400 Pascal | GP104-200 Pascal | GM200 Maxwell | GM204 Maxwell | GM204 |
| Transistor Count | 15.3B | 7.2B | 7.2B | 8B | 5.2B | 5.2B |
| Fab Process | 16nm FinFET | 16nm FinFET | 16nm FinFET | 28nm | 28nm | 28nm |
| CUDA Cores | 3584 | 2560 | 1920 | 2816 | 2048 | 1664 |
| GPCs | 6 | 4 | 3 | 6 | 4 | 4 |
| SMs | 56 | 20 | 15 | 22 | 16 | 13 |
| TPCs | 28 TPCs | 20 TPCs | 15 | - | - | - |
| TMUs | 224 | 160 | 120 | 176 | 128 | 104 |
| ROPs | 96 (?) | 64 | 64 | 96 | 64 | 56 |
| Core Clock | 1328MHz | 1607MHz | 1506MHz | 1000MHz | 1126MHz | 1050MHz |
| Boost Clock | 1480MHz | 1733MHz | 1683MHz | 1075MHz | 1216MHz | 1178MHz |
| FP32 TFLOPs | 10.6TFLOPs | 9TFLOPs | 6.5TFLOPs | 5.63TFLOPs | 5TFLOPs | 3.9TFLOPs |
| Memory Type | HBM2 | GDDR5X | GDDR5 | GDDR5 | GDDR5 | GDDR5 |
| Memory Capacity | 16GB | 8GB | 8GB | 6GB | 4GB | 4GB |
| Memory Clock | ? | 10Gbps GDDR5X | 4006MHz | 7Gbps GDDR5 | 7Gbps GDDR5 | 7Gbps |
| Memory Interface | 4096-bit | 256-bit | 256-bit | 384-bit | 256-bit | 256-bit |
| Memory Bandwidth | ? | 320.32GB/s | 256GB/s | 336GB/s | 224GB/s | 224GB/s |
| TDP | 300W | 180W | 150W | 250W | 165W | 148W |
| Power Connectors | ? | 1x 8-pin | 1x 8-pin | 1x 8-pin 1x 6-pin | 2x 6-pin | 2x 6-pin |
| Release Date | 4Q16-1Q17 | 5/27/2016 | 6/10/2016 | 6/01/2015 | 9/18/2014 | 9/19/2014 |
| Release Price | TBD (Several thousand) | Reference: $700 MSRP: $600 | Reference: $450 MSRP: $380 | $650 | $550 | $330 |
For a more complete specs table and architecture tear-down, check our GTX 1070 review.
Complexities of this Test
This is not a perfect test. We know that, but we feel confident that it's an accurate and good representation of GTX 1070s in SLI. Still, it's our policy to completely explain our test methodology and highlight points where we had to be flexible with our hardware.
There are a few bridge types that exist for SLI, as of this generation:
| 1920x1080 | 2460x1440 (60Hz) | 2560x1440 (120Hz, 144Hz) | 4K | 5K | Surround | |
| Ribbon Bridge | Yes | Yes | No | No | No | No |
| LED Bridge | Yes | Yes | Yes | Yes | No | No |
| HB Bridge | Yes | Yes | Yes | Yes | Yes | Yes |
This table is pulled from nVidia whitepapers. The company's shift to focus on high-bandwidth bridges for Pascal means that ribbon cables are no longer capable of delivering the throughput (on Pascal architecture) that is demanded for some higher resolution applications. We will validate this independently, but that's the information we have right now. We also asked if two ribbon bridges would provide the bandwidth necessary to effectively equate a rigid HB bridge, and the answer was a firm “no.”
That's because the HB Bridge and LED Bridge both operate at 650MHz, while the ribbon cable bridge has a clock-rate of 400MHz. Two doesn't double the clock-rate; there are some gains, but that clock is still oscillating at a slower overall frequency, and therefore should be limited in its bandwidth gains over a single ribbon cable on Pascal.
LED Bridges are high-bandwidth, comparatively, and operate at the faster clock-rate. These are bridges which were issued in the last generation of cards, often by AIB partners who wanted their own branding (with LEDs) on the bridge. We've got MSI bridge kits from the Maxwell generation, for instance, and used these in our SLI testing. The LED bridge kits are officially rated as supporting up to 4K, but are not recommended for 5K or Surround. Luckily, we're testing neither.
So that's one aspect covered – we're using an MSI LED Bridge kit, which is rated for the tests performed.
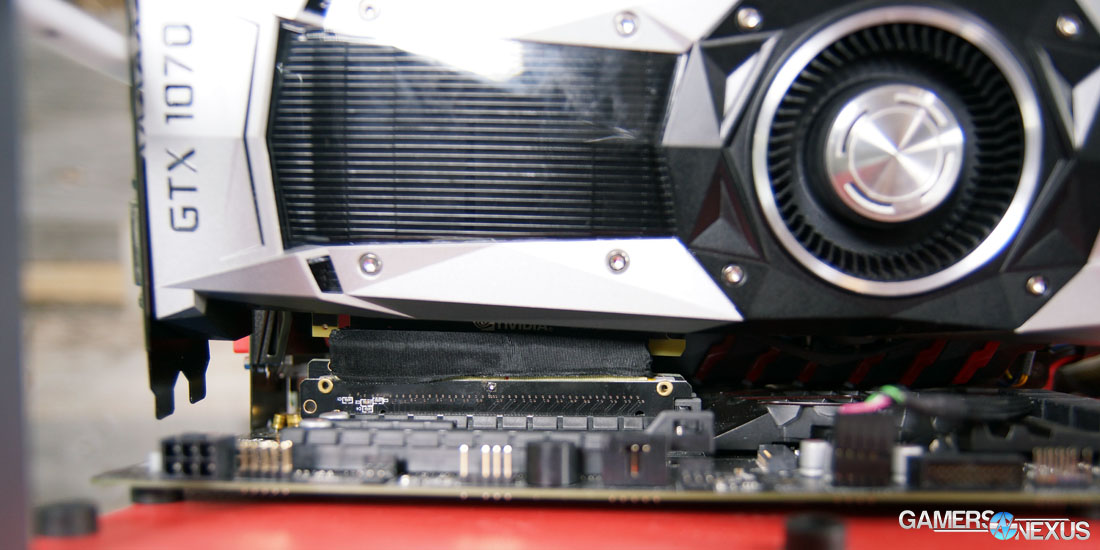
But it's a rigid kit, which means that cards must be the same height. Because the GTX 1070 is still new, we're not overflowing with the card – we've only got two, and they're different heights. We currently possess the GTX 1070 FE (reference) and MSI GTX 1070 Gaming X; MSI uses a non-reference PCB for its Gaming X, and has a significantly taller SLI footing as a result.
We tried to figure out how to make the bridge fit, but it just wasn't going to happen. The only good solution was to run a PCI-e riser cable and elevate the reference card, thereby equalizing the heights between the two devices. It worked perfectly, and so we sat the GTX 1070 FE card in the lower slot, using a PCI-e riser cable to buffer its height slightly. We then allowed the LED Bridge to secure the card enough that it wouldn't go anywhere – not a realistic scenario for anyone building within a case, which is effectively everyone, but one which works for our test purposes. There is theoretically some marginal latency impact by the PCI-e riser cable – but that impact is negligible.
We are left with results that provide an accurate, detailed look into SLI GTX 1070 performance, but in a configuration that users won't be replicating without some sort of ribbon cable instead. Going forward, it will be much easier to use cards of equal heights.
Note also that, as always, SLI operates at a joint frequency. Our SLI configuration was operating at a boosted clock-rate of 1898MHz (in-game clock-rate). This is about the same as the in-game, boosted frequency of the Founders Edition card. The advertised clock-rate is 1683MHz, though it tends to burst between 1683MHz and 1880-1890MHz. We did not overclock any devices for this particular test (see 1070 Review – Overclocking page). The MSI GTX 1070 Gaming X and Founders Edition 1070 were running at the same, stock FE frequency for this test.
Game Test Methodology
We tested using our GPU test bench, detailed in the table below. Our thanks to supporting hardware vendors for supplying some of the test components.
The latest AMD drivers (16.6.1) were used for testing. NVidia's 368.39 drivers were used for game (FPS) testing. Game settings were manually controlled for the DUT. All games were run at presets defined in their respective charts. We disable brand-supported technologies in games, like The Witcher 3's HairWorks and HBAO. All other game settings are defined in respective game benchmarks, which we publish separately from GPU reviews. Our test courses, in the event manual testing is executed, are also uploaded within that content. This allows others to replicate our results by studying our bench courses.
Windows 10-64 build 10586 was used for testing.
Each game was tested for 30 seconds in an identical scenario, then repeated three times for parity. Some games have multiple settings or APIs under test, leaving our test matrix to look something like this:
| Ashes | Talos | Tomb Raider | Division | GTA V | MLL | Mordor | BLOPS3 | Thermal | Power | Noise | |
| NVIDIA CARDS | |||||||||||
| GTX 1080 | 4K Crazy 4K High 1080 High Dx12 & Dx11 | 4K Ultra 1440p Ultra 1080p UltraVulkan & Dx11 | 4K VH 1440p VH 1080p VHDx12 & Dx11 | 4K High 1440p High 1080p High | 4K VHU 1080 VHU | 4K HH 1440p VHH 1080p VHH | 4K Ultra 1440p Ultra 1080p Ultra | 4K High 1440p High 1080p High | Yes | Yes | Yes |
| GTX 980 Ti | 4K Crazy 4K High 1080 High Dx12 & Dx11 | 4K Ultra 1440p Ultra 1080p UltraVulkan & Dx11 | 4K VH 1440p VH 1080p VHDx12 & Dx11 | 4K High 1440p High 1080p High | 4K VHU 1080 VHU | 4K HH 1440p VHH 1080p VHH | 4K Ultra 1440p Ultra 1080p Ultra | 4K High 1440p High 1080p High | Yes | Yes | Yes |
| GTX 980 | 4K Crazy 4K High 1080 High Dx12 & Dx11 | 4K Ultra 1440p Ultra 1080p UltraVulkan & Dx11 | 4K VH 1440p VH 1080p VHDx12 & Dx11 | 4K High 1440p High 1080p High | 4K VHU 1080 VHU | 4K HH 1440p VHH 1080p VHH | 4K Ultra 1440p Ultra 1080p Ultra | 4K High 1440p High 1080p High | Yes | Yes | Yes |
| AMD CARDS | |||||||||||
| AMD R9 390X | 4K Crazy 4K High 1080 High Dx12 & Dx11 | 4K Ultra 1440p Ultra 1080p UltraVulkan & Dx11 | 4K VH 1440p VH 1080p VHDx12 & Dx11 | 4K High 1440p High 1080p High | 4K VHU 1080 VHU | 4K HH 1440p VHH 1080p VHH | 4K Ultra 1440p Ultra 1080p Ultra | 4K High 1440p High 1080p High | Yes | Yes | No |
| AMD Fury X | 4K Crazy 4K High 1080 High Dx12 & Dx11 | 4K Ultra 1440p Ultra 1080p UltraVulkan & Dx11 | 4K VH 1440p VH 1080p VHDx12 & Dx11 | 4K High 1440p High 1080p High | 4K VHU 1080 VHU | 4K HH 1440p VHH 1080p VHH | 4K Ultra 1440p Ultra 1080p Ultra | 4K High 1440p High 1080p High | Yes | Yes | Yes |
Average FPS, 1% low, and 0.1% low times are measured. We do not measure maximum or minimum FPS results as we consider these numbers to be pure outliers. Instead, we take an average of the lowest 1% of results (1% low) to show real-world, noticeable dips; we then take an average of the lowest 0.1% of results for severe spikes.
| GN Test Bench 2015 | Name | Courtesy Of | Cost |
| Video Card | This is what we're testing! | - | - |
| CPU | Intel i7-5930K CPU | iBUYPOWER | $580 |
| Memory | Corsair Dominator 32GB 3200MHz | Corsair | $210 |
| Motherboard | EVGA X99 Classified | GamersNexus | $365 |
| Power Supply | NZXT 1200W HALE90 V2 | NZXT | $300 |
| SSD | HyperX Savage SSD | Kingston Tech. | $130 |
| Case | Top Deck Tech Station | GamersNexus | $250 |
| CPU Cooler | NZXT Kraken X41 CLC | NZXT | $110 |
For Dx12 and Vulkan API testing, we use built-in benchmark tools and rely upon log generation for our metrics. That data is reported at the engine level.
Video Cards Tested
- NVIDIA GTX 1080 Founders Edition ($700)
- NVIDIA GTX 1070 Founders Edition ($450)
- MSI GTX 1070 Gaming X
- NVIDIA GTX 980 Ti Reference ($650)
- NVIDIA GTX 980 Reference ($460)
- NVIDIA GTX 980 2x SLI Reference ($920)
- AMD R9 Fury X 4GB HBM ($630)
- AMD MSI R9 390X 8GB ($460)
Thermal Test Methodology
We strongly believe that our thermal testing methodology is the best on this side of the tech-media industry. We've validated our testing methodology with thermal chambers and have proven near-perfect accuracy of results.
Conducting thermal tests requires careful measurement of temperatures in the surrounding environment. We control for ambient by constantly measuring temperatures with K-Type thermocouples and infrared readers. We then produce charts using a Delta T(emperature) over Ambient value. This value subtracts the thermo-logged ambient value from the measured diode temperatures, producing a delta report of thermals. AIDA64 is used for logging thermals of silicon components, including the GPU diode. We additionally log core utilization and frequencies to ensure all components are firing as expected. Voltage levels are measured in addition to fan speeds, frequencies, and thermals. GPU-Z is deployed for redundancy and validation against AIDA64.
All open bench fans are configured to their maximum speed and connected straight to the PSU. This ensures minimal variance when testing, as automatically controlled fan speeds will reduce reliability of benchmarking. The CPU fan is set to use a custom fan curve that was devised in-house after a series of testing. We use a custom-built open air bench that mounts the CPU radiator out of the way of the airflow channels influencing the GPU, so the CPU heat is dumped where it will have no measurable impact on GPU temperatures.
We use an AMPROBE multi-diode thermocouple reader to log ambient actively. This ambient measurement is used to monitor fluctuations and is subtracted from absolute GPU diode readings to produce a delta value. For these tests, we configured the thermocouple reader's logging interval to 1s, matching the logging interval of GPU-Z and AIDA64. Data is calculated using a custom, in-house spreadsheet and software solution.
Endurance tests are conducted for new architectures or devices of particular interest, like the GTX 1080, R9 Fury X, or GTX 980 Ti Hybrid from EVGA. These endurance tests report temperature versus frequency (sometimes versus FPS), providing a look at how cards interact in real-world gaming scenarios over extended periods of time. Because benchmarks do not inherently burn-in a card for a reasonable play period, we use this test method as a net to isolate and discover issues of thermal throttling or frequency tolerance to temperature.
Our test starts with a two-minute idle period to gauge non-gaming performance. A script automatically triggers the beginning of a GPU-intensive benchmark running MSI Kombustor – Titan Lakes for 1080s. Because we use an in-house script, we are able to perfectly execute and align our tests between passes.
Power Testing Methodology
Power consumption is measured at the system level. You can read a full power consumption guide and watt requirements here. When reading power consumption charts, do not read them as a GPU-specific requirements – this is a system-level power draw.
Power draw is measured during the thermal burn-in. We use a logging wall meter that sits between the PSU and the system and logs power consumption over the test period. We select the final 200s of data and average the data points.
We use a different bench platform for power measurements; see below:
| GN Z97 Bench | Name | Courtesy Of | Cost |
| Video Card | This is what we're measuring! | - | - |
| CPU | Intel i7-4790K CPU | CyberPower | $340 |
| Memory | 32GB 2133MHz HyperX Savage RAM | Kingston Tech. | $300 |
| Motherboard | Gigabyte Z97X Gaming G1 | GamersNexus | $285 |
| Power Supply | Enermax Platimax 1350W | Enermax | $272 |
| SSD | HyperX Predator PCI-e SSD Samsung 850 Pro 1TB | Kingston Tech. Samsung | |
| Case | Top Deck Tech Station | GamersNexus | $250 |
| CPU Cooler | Be Quiet! Dark Rock 3 | Be Quiet! | ~$60 |
Continue to the next page for Dx12, OpenGL, & Vulkan SLI benchmarks on 2x 1070s.
NVIDIA GTX 1070 SLI FPS Benchmarks – Dx12, Vulkan, & OpenGL vs. DirectX 11
This page initiates our game benchmarking for the GTX 1070 SLI configuration. We do not include any Dx11-only games on this page, but we do provide comparative data between Dx11, Dx12, and Vulkan (where present) for tested games. Some of this data is presented as a percent change value or other unique values, like ms latency. These charts provide insight as to async compute performance and overall acceptance of new APIs by the hardware. Learn more about Pascal asynchronous compute in our GTX 1080 review.
OpenGL is also included through DOOM, which we originally benchmarked here.
OpenGL DOOM – GTX 1070 SLI vs. GTX 1080, 980, Fury X, 390X
We're still waiting on the Vulkan implementation within id Software's DOOM. For the time being, the game remains on OpenGL and makes promises of enabling Vulkan for all GPU vendors; id Software has gone to bat for both nVidia and AMD in the past few months for the GTX 1080 and RX480, and seems to be charged to deliver on the new API.
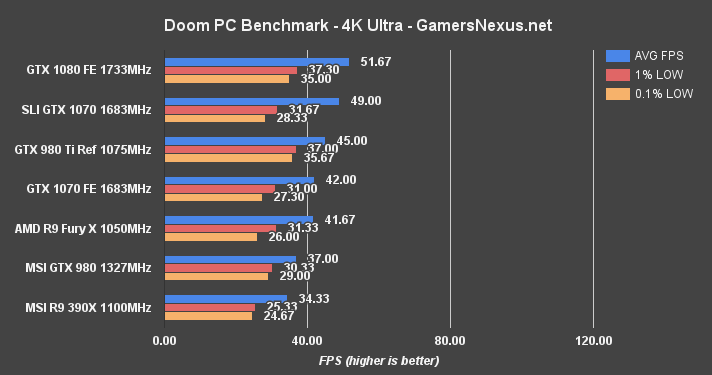
This should be obvious from one glance at the above, but DOOM does not have good SLI scaling at this time. SLI is not officially supported, and currently forces AFR2 to achieve function without any real gains.
At 4K, DOOM proves as intensive as ever for all devices under test (DUT). The GTX 1080 FE operates at 51.67FPS average, holding an imperceptible (but measurable) lead over the GTX 1070 SLI configuration (49FPS AVG). That lead boils-down to 5.3%, with the 1% and 0.1% lows being separated by a comparable margin. Over a single GTX 1070, the SLI configuration leads by 15.38% – that's not great scaling and would be pretty poor value for owners of 1070 SLI, but 4K is intensive. Let's move to 1440p and see if scaling improves.
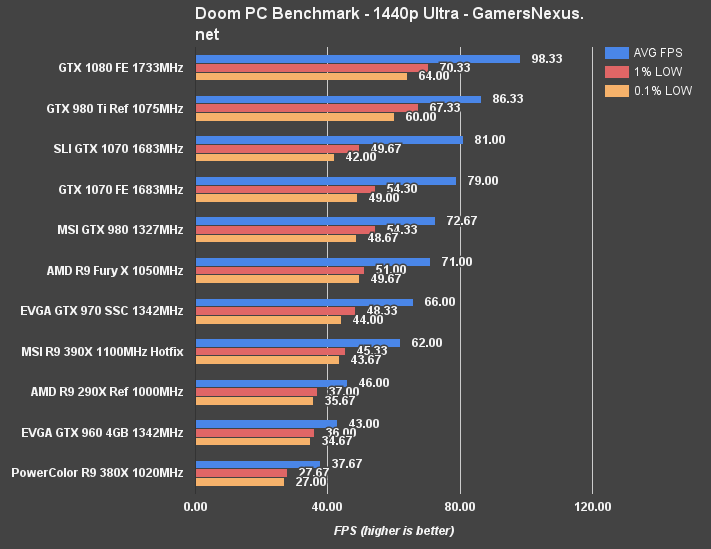
No. Not really. At 1440p, now that the bars are a little more exaggerated, we can see how much of a hit the 1% and 0.1% low framerates take with SLI. Consistency isn't bad – there's no real, observable micro-stutter (as there is in some games) – but it's still worse than a single GTX 1070, with averages more-or-less identical (81 vs. 79FPS AVG, so 2.5% delta).
At 1080p, we see a delta of 3.4% between the averages, with the SLI cards again taking a hit (although mostly imperceptible) to 1% and 0.1% lows. The FPS overall remains above a point of jarring stutter, but there's also a measurable dip – and that means exceptionally poor value.
If DOOM is the only game you want to play, SLI just isn't worth it right now. There should be better support forthcoming, but we've heard that song and dance before – like with Just Cause 3 and Assassin's Creed Syndicate.
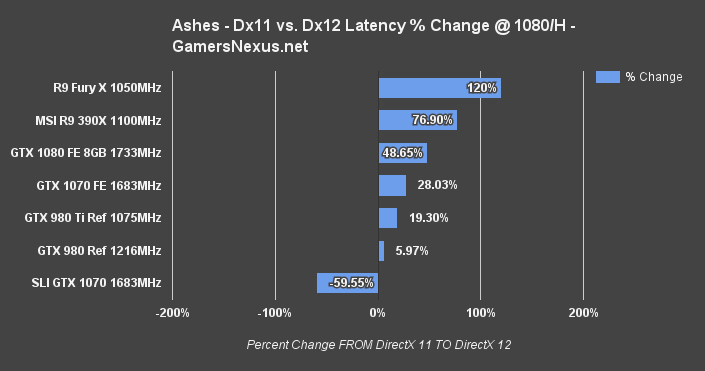
Comparative Dx12 vs. Dx11 FPS in Ashes of Singularity – GTX 1070 vs. 1080, 970 Fury X
SLI doesn't fare well in the Ashes of Singularity Dx12 benchmark.
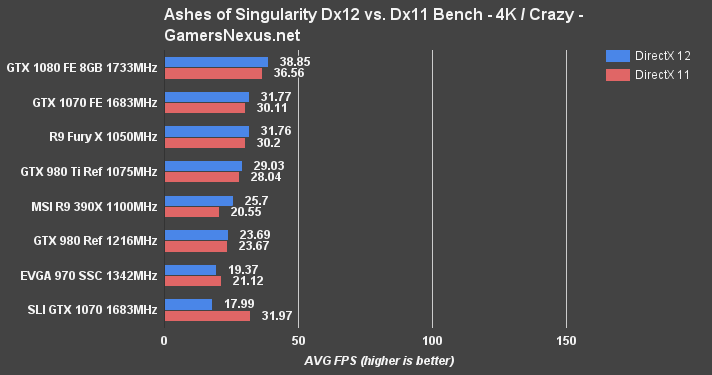
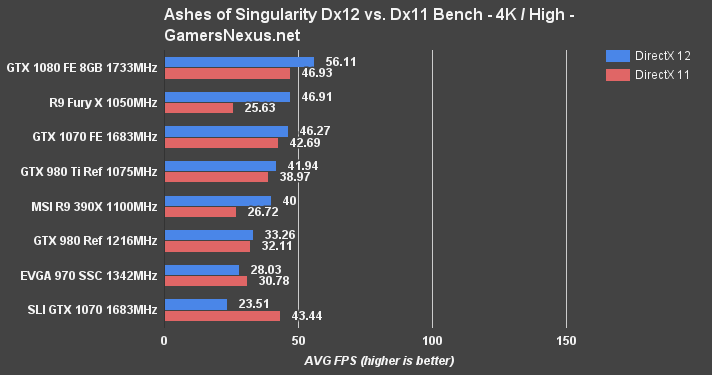
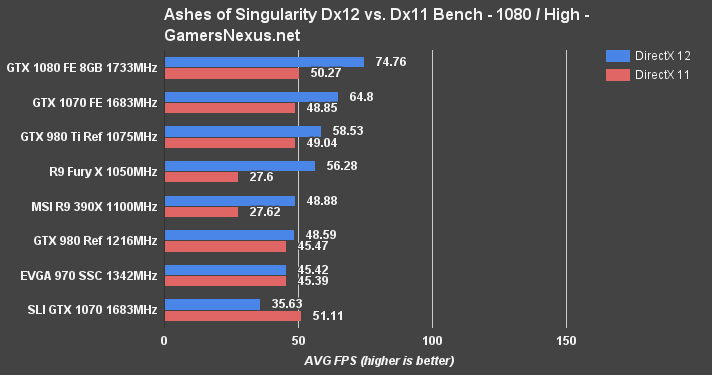
Using the DirectX 12 API, the SLI GTX 1070s fall to the bottom of all charts, regardless of settings, showing dismal frametimes (42.54ms average at 1080/high) in Dx12. Against other nVidia devices, this is a major downturn and is a result of SLI. It would actually be better to disable SLI for Ashes of Singularity in Dx12, leaving the second card to rot. DirectX 11 performance is more reasonable; frametimes are closer to the single GTX 1070 (20.46ms for single 1070 vs. 23.02ms for SLI), and scaling is around 5% for 1080p/high. Not good – certainly not worth it – but better than the massive negative hit from Dx12.
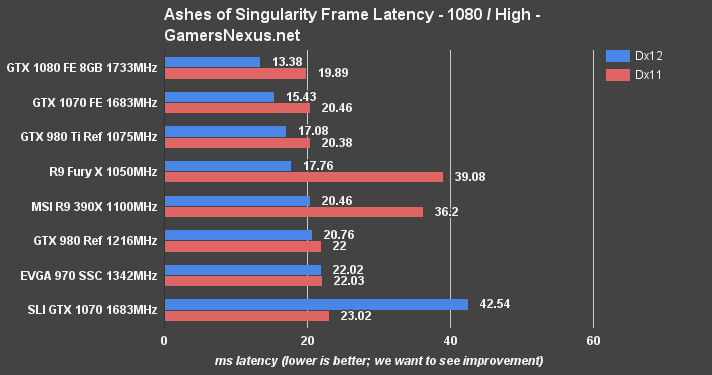
As always, this is just one game – don't take too much away from this other than “SLI GTX 1070s are terrible in Ashes of Singularity.”
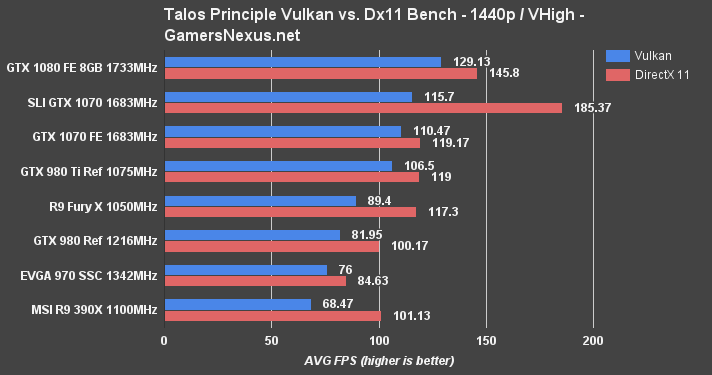
Comparative Vulkan vs. Dx11 in Talos Principle – GTX 1070 SLI vs. 1070, 1080, etc.
The Talos Principle shows massive gains in Dx11, but clearly unoptimized Vulkan/SLI performance.
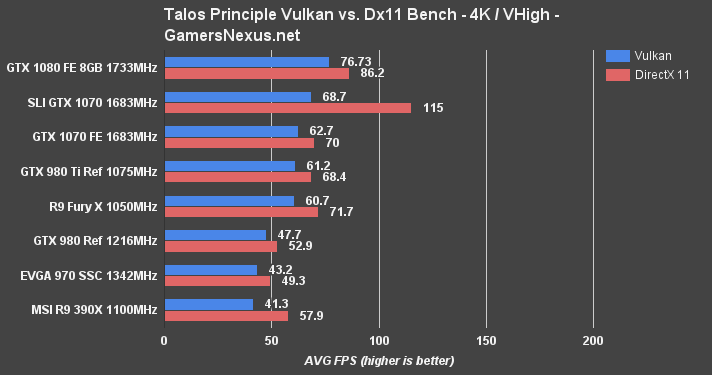
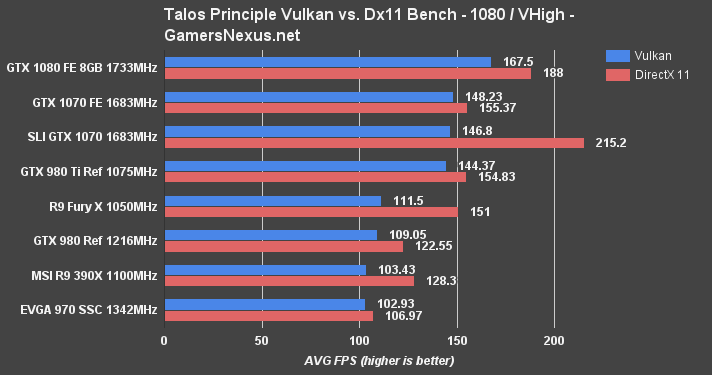
At 4K in Dx11, we're seeing scaling of 48.65% in The Talos Principle (1070 to SLI 1070 at Dx11). Against a single 1080, the 1070s push a 28.63% higher average framerate. In Vulkan, we're seeing only a 9.13% gain over a single GTX 1070, with a 20.12% drag behind the single GTX 1080 – very poor value, considering the 1080 is cheaper than two 1070s. That said, this is with Vulkan in Talos Principle, which has already proven to be a maturing deployment.
SLI 1070s are pushing 185.37FPS AVG in Dx11 at 1440p, which nets a 23.9% lead over the single GTX 1080 and a 43.48% lead over a single GTX 1070. Not bad. With Vulkan, we see comparable results to before – negligible gains versus a single 1070 card, and dragging behind the single GTX 1080.
The Division Benchmark – GTX 1070 SLI vs. 1070, 1080 at 4K, 1440, & 1080p
The Division is intensive. We use its built-in benchmarking suite for analysis, but there are a few critical points to be aware of: As a game, The Division has pretty heavily varied FPS depending on effects in the environment. Walking through the smoldering ash clouds of an explosive will tank FPS hard for that brief instant in the cloud, but isn't representative of greater gameplay (and is only an issue with some settings enabled). The Division is also an MMO, which isn't something we can really test given the latency of the servers and the variability of players on FPS – we need a reproducible scenario.
And so we run the benchmark, but point-out these challenges. The benchmark tends to be representative of real-world, in-game performance (even with other players) as it is exceptionally heavy on the GPU despite a lack of other players.
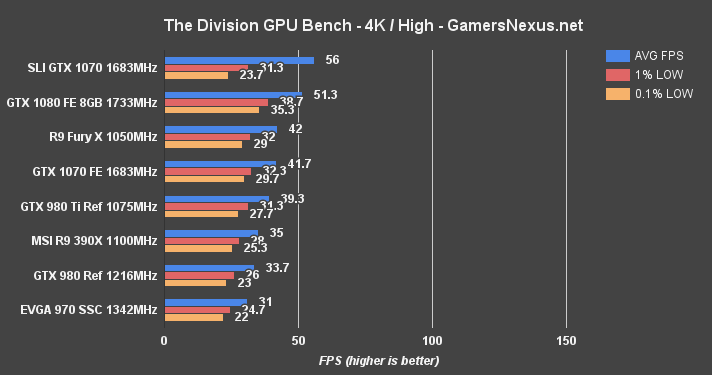
The Division shows some reasonable gains for SLI. At 4K, we see a scaling of 29.27% against the single GTX 1070 FE, with clock-for-clock configurations. The SLI 1070s run 8.76% faster than a single GTX 1080 in average framerate. 1% and 0.1% lows struggle, meaning that frametimes and overall consistency of framerate (ms-to-ms) is worse than the single GTX 1080 or single GTX 1070.
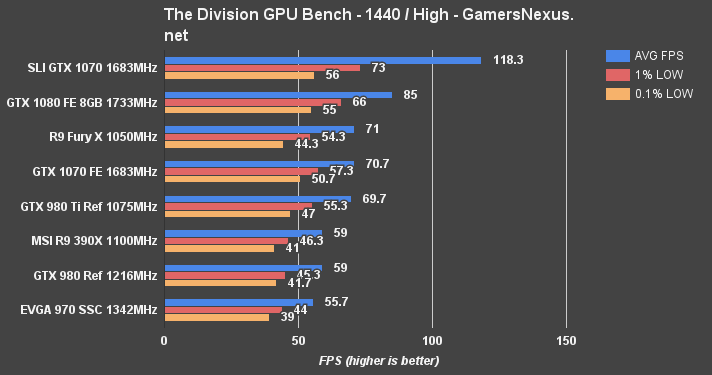
1440p is a little more favorable for the dual-GPU setup. The GTX 1070s in SLI push 118.3FPS – they were likely choking on pixel count at 4K – and hold a substantial 32.76% lead over the GTX 1080. 1% and 0.1% lows might not be as high as they should be, but are still superior to the single GPU configurations. Against a single GTX 1070, the SLI configuration holds a 50.37% lead in average FPS.
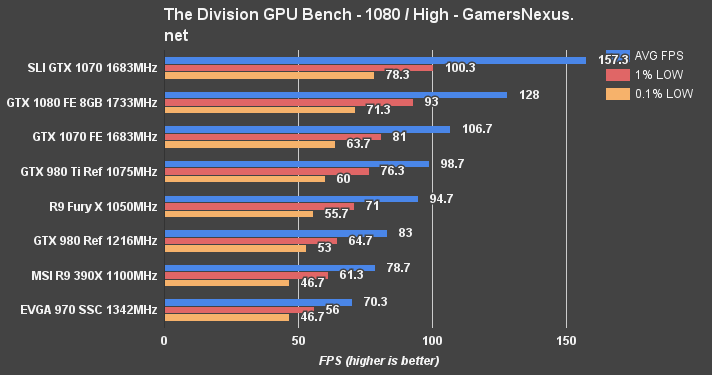
1080p more-or-less sticks to this. The SLI 1070s distance themselves by 20.54% over the single GTX 1080, and 38.3% lead over the single GTX 1070. The average framerate at 1080p is 157.3FPS, with a >100FPS 1% low.
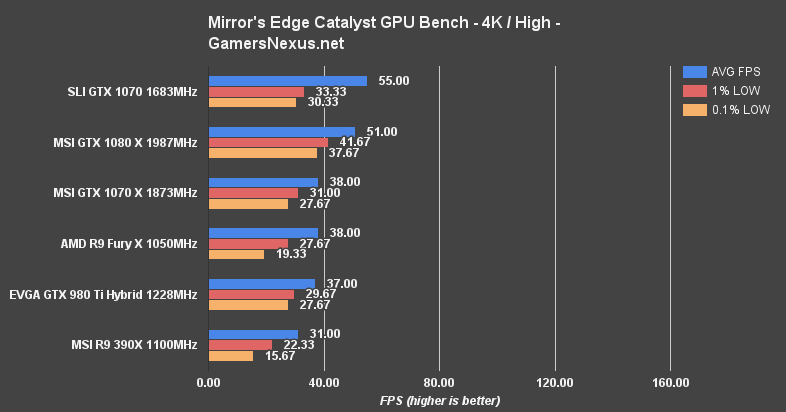
Mirror's Edge Catalyst Benchmark – GTX 1070 SLI vs. 1080, 1070 at Hyper
Mirror's Edge Catalyst came out this week. We ran benchmarks on day-one, our tests finding some odd behavior with low frametimes on AMD devices (as of 16.6.1 hotfix) and VRAM-abusive behavior by the Hyper settings.
ME Catalyst is one of the most GPU-intensive games we've tested in recent years, remaining true to its heritage, and even pushes the GTX 1080 into a struggle at 4K/High. When the game's fluid, it's beautiful – but the high-paced movement does make a higher framerate desirable for best gameplay (we found 50-60+ FPS to be the preferred window).
NOTE: Mirror's Edge is the one game where we ran an MSI GTX 1070 Gaming X as the single GTX 1070, rather than the Founders Edition. This is a change we will be making as we roll into the AIB partner cards, and ME Catalyst happened to be the game to initiate that transition. We try to move to AIB partner cards for AMD and nVidia once they ship, since we don't currently recommend the reference devices and because they're presently over-priced versus vendor pre-OC versions.
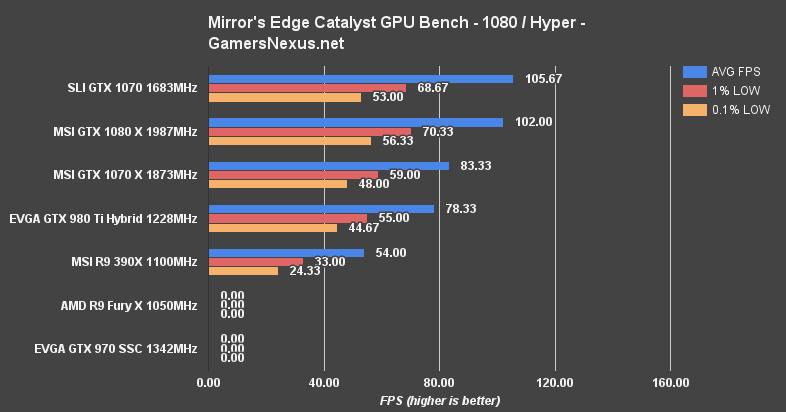
At 1080p/Hyper, the GTX 1070 SLI tops the bench with 105.67 FPS AVG and retains fairly strong 1% and 0.1% lows, despite being imperceptibly lower than the single GTX 1080. The SLI configuration scales 23.68% over a single GTX 1070 (83.3FPS), putting it within ~3FPS of the single GTX 1080 (Δ3.5%).
Moving to more intensive settings, 4K/High shows a gap of 4FPS between the 1080 and 1070 SLI, and a gap of 17FPS between the 1070 and 1070 SLI. As percentages, 4K/High distances the 1080 and 1070 SLI by Δ7.55%, but the 1% and 0.1% lows are much higher on the single GTX 1080 (Δ22.3% for 1% lows, Δ21.59% for 0.1% lows). This is a fairly constant trend for SLI/CrossFire. Against the 1070 non-SLI, we're seeing delta values of Δ36.56% for the average FPS, with the 1% and 0.1% lows marginally improving. Note again that the single GTX 1070 here is the Gaming X, so the gap is shrunken versus a reference 1070 (with lower clock-rate). These metrics provide hope considering what we just saw with DOOM.
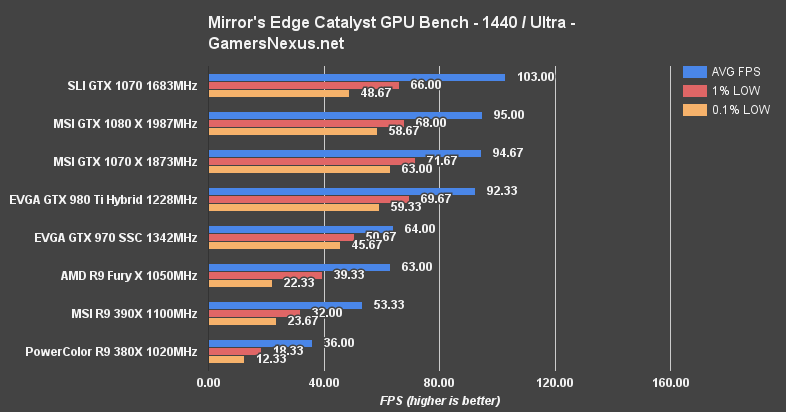
At 1440p, we see a delta of 8.4% between the 1070 SLI and 1070 (remember – settings have changed from “high” at 4K to “ultra” at 1440p, which shifts load to be more intensive after the rasterization step). The 0.1% lows are a fair bit reduced for SLI versus the non-SLI setup, posting 48.67FPS 0.1% low vs. 63FPS 0.1% low.
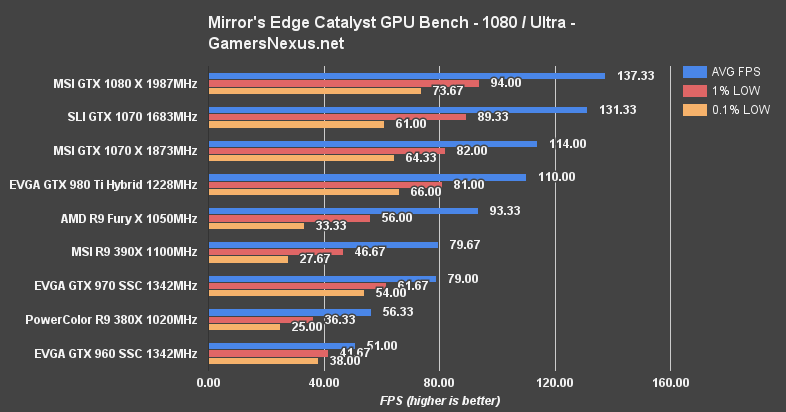
At 1080p/ultra, the GTX 1080 pulls ahead by 4.47%, with the GTX 1070 SLI setup leading a single GTX 1070 (pre-OC) by 14.12%.
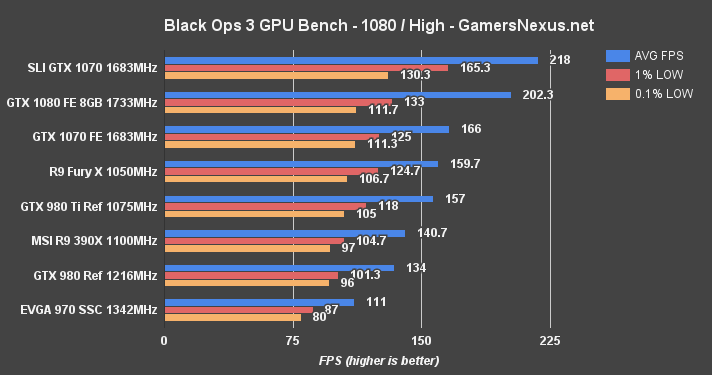
Black Ops 3 Benchmark – SLI GTX 1070 vs. 1070, 1080, more at 4K, 1440, & 1080
Black Ops 3 remains one of the best-optimized games we've worked with – perhaps a testament to Activision's experience in the space. The game has regularly posted strong performance for AMD devices as well, though the Fury X does still suffer at 4K.
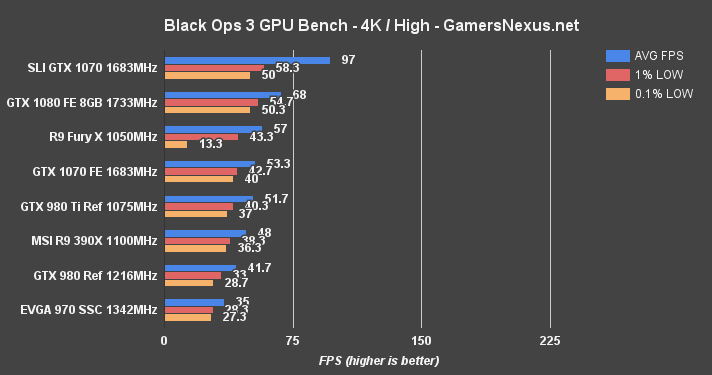
At 4K, we're seeing averages nearing 100FPS on the dual GTX 1070s in SLI, with 1% and 0.1% lows performing near 60FPS – a strong output overall. The single GTX 1080 FE pushes 68FPS average, so that's a 35.15% difference versus the SLI config. Against a single GTX 1070, the dual setup runs ~58.15% faster in average framerates. The Fury X sustains very low 0.1% metrics because of the 4GB limitation, which is quickly saturated by BLOPS3 at 4K.
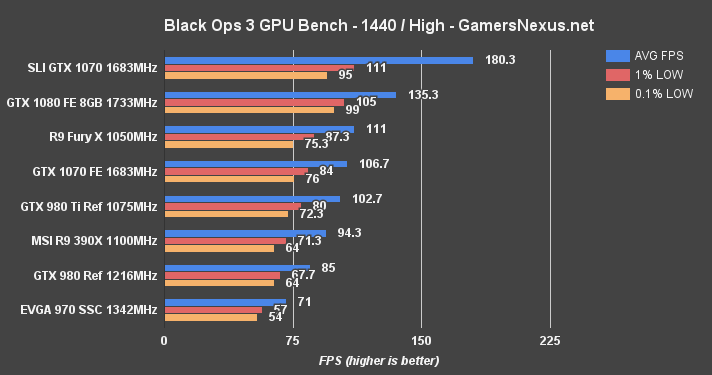
At 1440p, we're seeing 180.3FPS AVG on the SLI GTX 1070s – somewhat absurdly high – netting a ~28.52% difference over the GTX 1080 and 51.29% difference over the single GTX 1070. Good gains over all, with performance well above the magical 144Hz number for ultra-competitive gamers, and nearing 200Hz.
1080p is just comical, with the 2x GTX 1070s pumping 218FPS AVG against the 166FPS AVG of a single card. It's really not a use case that's realistic, though; at this point, most dual-1070 users will not be playing 1080p, anyway. Especially with 1440p pushing 180FPS.
GTA V Benchmark – SLI GTX 1070 vs. 1070, 1080, 980 Ti, Fury X at 4K & 1080
GTA V is becoming one of the longer-standing titles on our bench. It's been intensive, but reasonably well-optimized. We understand the graphics settings exceptionally well as a result of our graphics optimization guide, something which fuels our methodology.
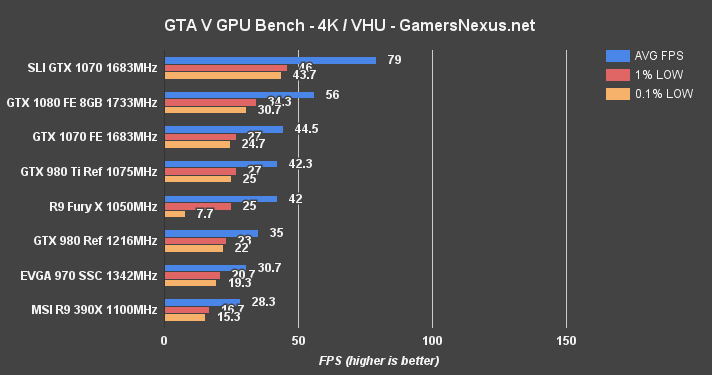
GTA V at 4K also sees >50% scaling versus a single GTX 1070 (55.8%) in the AVG FPS department. 1% and 0.1% lows are also improved, and now land above 30FPS. Together, this makes 4K at Very High / Ultra completely playable on the SLI GTX 1070s, where a single GTX 1070 sees enough dips in performance (in the 1%/0.1% lows) to necessitate a very slight settings reduction. Versus a GTX 1080, the SLI GTX 1070 at 4K show a delta of 34.07%.
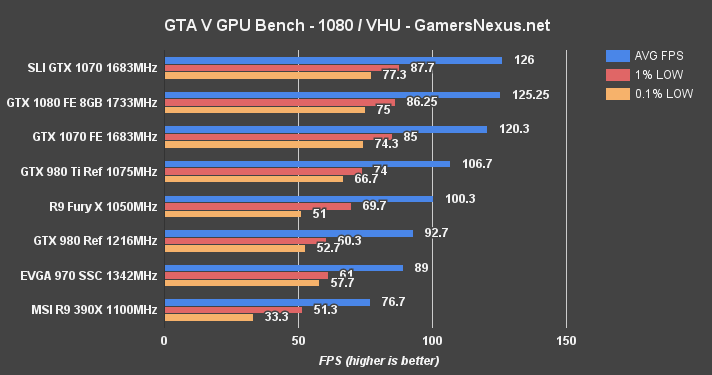
We hit a CPU bottleneck at 1080p, with the GTX 1080 and SLI 1070s – and effectively the 1x GTX 1070 – all landing at around the same ~120-125 limit.
Metro: Last Light Benchmark – SLI GTX 1070 vs. 980 Ti, Fury X at 4K, 1440, & 1080
Metro: Last Light will eventually be phased-out of our bench, but its reliability keeps it on for now.
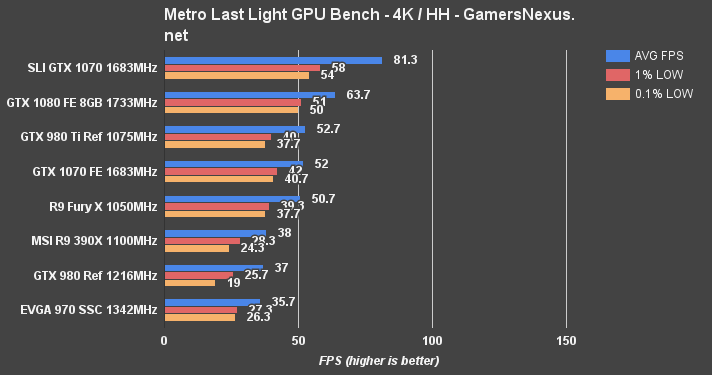
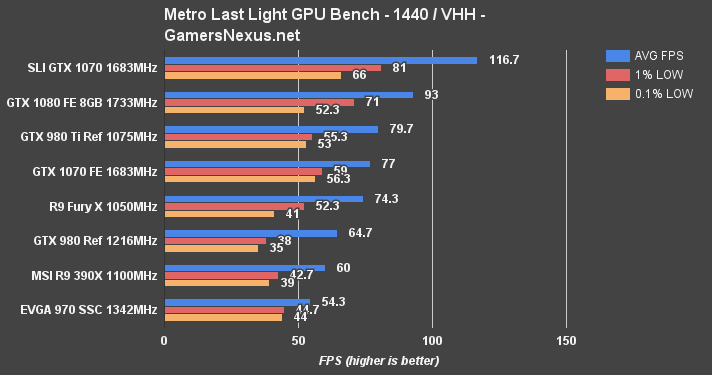
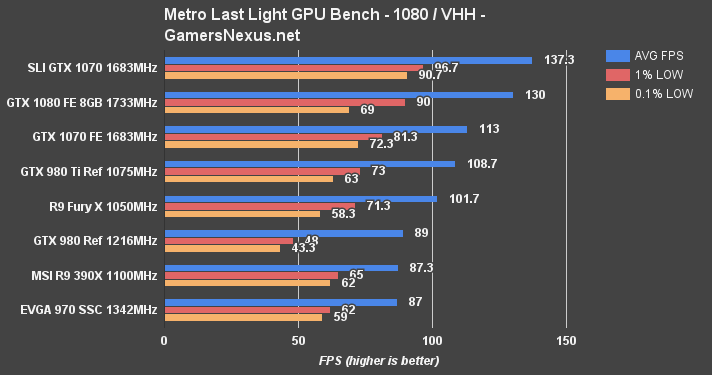
At 4K, we're seeing 81.3FPS AVG in MLL, equating a 24.28% lead over the GTX 1080 and 42.69% lead over a single GTX 1070. 1440p has the GTX 1070s exceeding 100FPS, with nearly identical percent differences between the single 1080 and 1070. 1080p has us bumping against a performance wall at the top-end of the chart (1080 & 1070s in SLI).
Shadow of Mordor Benchmark – GTX 1070 SLI vs. 1080, Fury X at 4K, 1440, & 1080
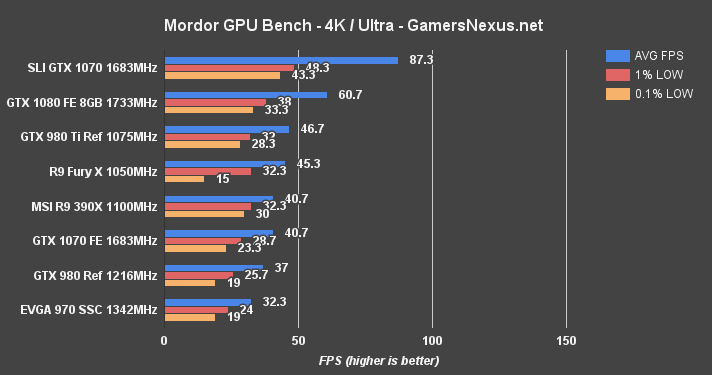
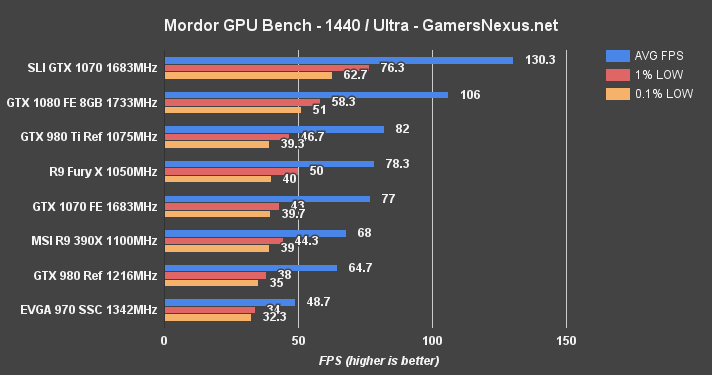
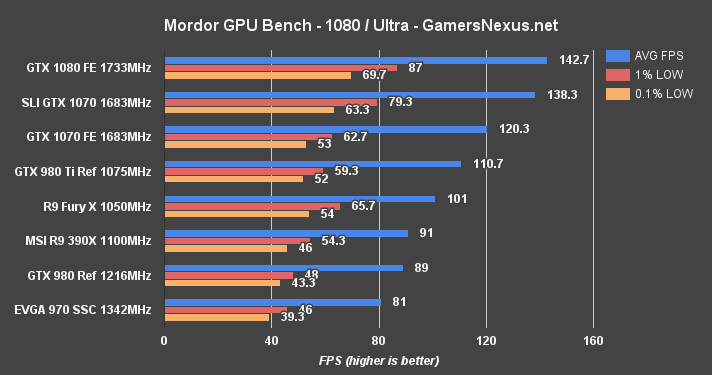
The last chart for this FPS bench, we see Shadow of Mordor operating at 87.3FPS on the SLI setup, a good ~27FPS lead (at 4K) over the 1080, or 35.95%, and ~40FPS lead over a single 1070, or 72.8% scaling. That makes Shadow of Mordor one of the most aggressively scaled games, producing real, measurable, and tangible gains otherwise unachievable on other devices.
Power Testing – SLI GTX 1070s vs. GTX 1080, GTX 1070
We're not running thermals for this setup for a few reasons – mostly that the cards aren't the same design, and that we already ran extensive thermal testing on the FE card in our 1070 review. We'll be looking at the MSI card's thermals separately, when its standalone review is posted.
Power draw, however, was run through the ringer for this setup – and it's important, too. With SLI configurations, power draw increases greatly and can be the teetering point between one PSU and another, potentially offsetting price further when compared against single GPU configurations.
Here's a look:
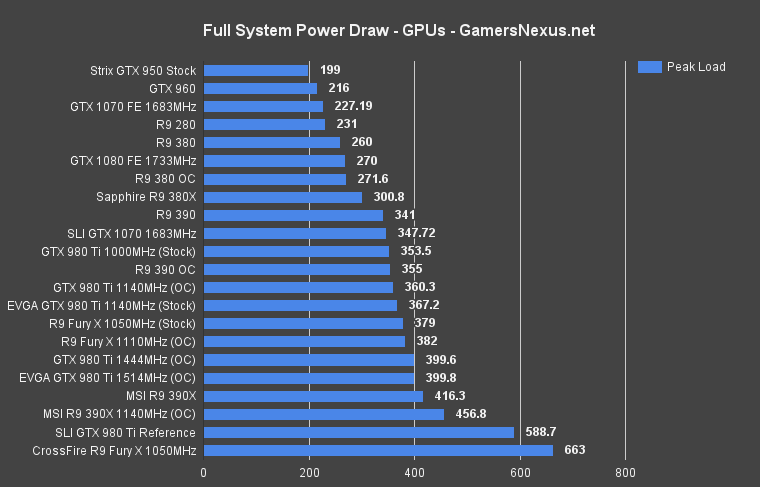
The GTX 1080 FE runs (stock) at 270W for peak system load using GFX Test 2 in 3DMark FireStrike. A single GTX 1070 FE (stock) operates at 227.19W peak system load – a reduction of ~43W. Looking to the SLI configuration, we're now drawing more power than the single GTX 1080 – 347.72W peak system load. That's an increase of 41.93%, or ~120.53W. Whether or not the increase is important to your build is personal preference – but the power increase is often greater than the performance increase, depending on game, so it's worth keeping in mind.
Conclusion: Are SLI GTX 1070s Worth It or Single GTX 1080?
Answering this question is tough, but we face it with every SLI benchmark. In this instance, the question is whether or not there's better value in spending ~$600-$700 on a single GTX 1080 or $380-$450 on 2x GTX 1070s. Based on the AIB partner cards we know to be hitting the market, let's just make it easy and assume an average GTX 1080 price of $650, and an average joint price of 2x GTX 1070s at roughly $800-$850 – so that's a $150-$200 gap between the two main options. To be worth it, you'd want to feel like you're getting an additional $150 of performance out of two GTX 1070s.
In some games, such a gain is reasonably present. We saw upwards of a 30% lead over a single GTX 1080 in a few instances, which is no small jaunt considering the already impressive performance of the 1080. Still, though, SLI and CrossFire run the same risk they always have: Poor optimization earlier in launch cycles or a complete lack of any meaningful support in some games (like Just Cause 3, Assassin's Creed Syndicate, and Doom). Some of this will simply never be resolved – it's the way the game was made, and the devs aren't going to be able to do enough optimization to meaningfully impact performance. Some of the detriment is just launch cycles – nVidia tends to put out SLI optimizations over time, as do devs, and games can improve in overall performance throughput.
Inevitably, there will be times when multi-GPU configurations simply don't work well (or at all) and necessitate that the second card is disabled. That's never fun, but there are also gains – like in Mordor, with >70% scaling – that can counteract the occasional loss. Ultimately, it's up to you to look at data on a game-by-game basis and determine if SLI makes sense for you. If you're very heavily focusing on one game – maybe hoping to competitively play Infinite Warfare or BLOPS3 for a year or more – it could make sense to go SLI, with an occasional toggle for unsupported titles. If playing a wider swath of games, we'd recommend very seriously considering a single GTX 1080 instead – or waiting for the RX 480s to come out, and then seeing if AMD's claims of highly performant CrossFire framerates are valid across all titles.
Overall, it's still a mixed bag of results. Some games show less than 10% scaling – or even “negative” scaling, particularly with poor frametimes – and others show 40-50% (or, rarely, greater) scaling in SLI. Look through the data and make a decision.
That said, if you're the type who will be greatly upset every time SLI has to be disabled and you're left with a $400 brick in your PC (until it can be used again), maybe just avoid multi-GPU configurations altogether. A single card is certainly the “safe” and easy route, and the 1080 is a good single card as an alternative – and cheaper than two 1070s.
If you like our work, please consider supporting us on Patreon.
Editorial, Test Lead: Steve “Lelldorianx” Burke
Sr. Test Technician: Mike “Budekai?” Gaglione
Test Technician: Andie “Draguelian” Burke
Video: Andrew “ColossalCake” Coleman