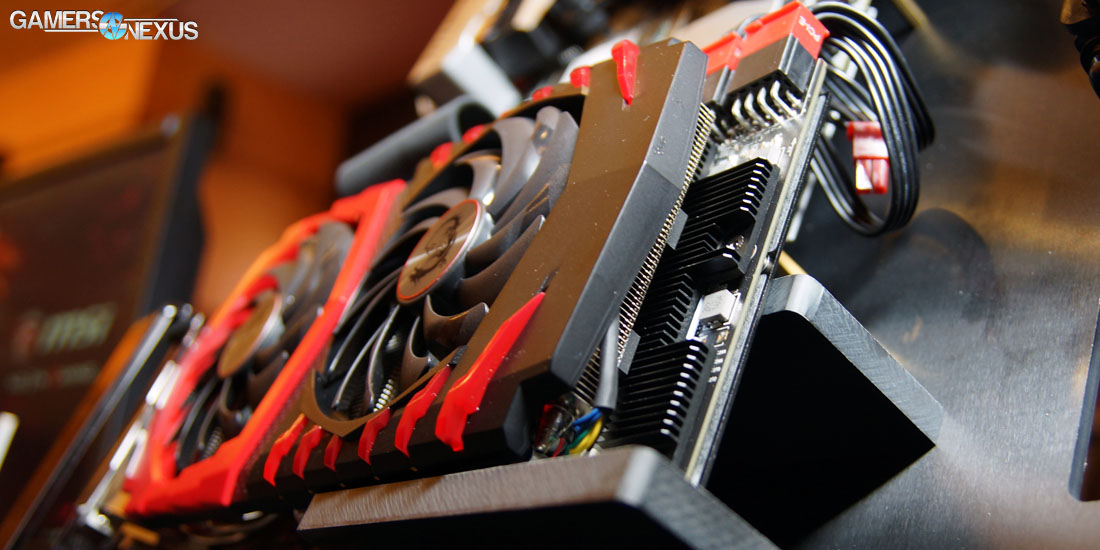
MSI's GTX 1080 Gaming X was the first AIB partner GTX 1080 to show up at our lab, marking the beginning of AIB partner reign over the GTX 1080 market. We originally reviewed the GTX 1080 and remarked that, although the card is good, it just made far more sense to wait for non-reference (“Founders Edition”) designs. The FE card exhibited some clock-rate instability in some instances, and our DIY Hybrid project served as a proof of concept for aftermarket cooling solutions.
MSI's GTX 1080 Gaming X (priced at $720) tests that theory with a manufacturer-made cooling solution. The GTX 1080 Gaming X uses a new Twin Frozr VI air cooler, ships with three OC settings in the MSI Gaming App (maxing-out at 1847MHz with OC mode), and is stacked in the middle of MSI's options. The company is also working on a Gaming Z card, which we live-overclocked at Computex, and a new SeaHawk – all those are detailed here.
In this MSI GTX 1080 Gaming X review, we look at cooling performance, noise levels, FPS (gaming), and maximum overclocking performance.
GTX 1080 & Pascal Architecture Content
To catch-up on the GTX 1080, our GN Hybrid experiment, and Pascal architecture, check out these articles:
MSI GTX 1080 Gaming X Overclocking & Video Review
NVIDIA GTX 1080 Specs, 1070 Specs, 980 & 980 Ti Specs
| NVIDIA Pascal vs. Maxwell Specs Comparison | ||||||
| Tesla P100 | GTX 1080 | GTX 1070 | GTX 980 Ti | GTX 980 | GTX 970 | |
| GPU | GP100 Cut-Down Pascal | GP104 Pascal | GP104 (?) | GM200 Maxwell | GM204 Maxwell | GM204 |
| Transistor Count | 15.3B | 7.2B | Unknown | 8B | 5.2B | 5.2B |
| Fab Process | 16nm FinFET | 16nm FinFET | 16nm FinFET | 28nm | 28nm | 28nm |
| CUDA Cores | 3584 | 2560 | Unknown | 2816 | 2048 | 1664 |
| GPCs | 6 | 4 | Unknown | 6 | 4 | 4 |
| SMs | 56 | 20 | Unknown | 22 | 16 | 13 |
| TPCs | 28 TPCs | 20 TPCs | Unknown | - | - | - |
| TMUs | 224 | 160 | Unknown | 176 | 128 | 104 |
| ROPs | 96 (?) | 64 | Unknown | 96 | 64 | 56 |
| Core Clock | 1328MHz | 1607MHz | Unknown | 1000MHz | 1126MHz | 1050MHz |
| Boost Clock | 1480MHz | 1733MHz | Unknown | 1075MHz | 1216MHz | 1178MHz |
| FP32 TFLOPs | 10.6TFLOPs | 9TFLOPs | 6.5TFLOPs | 5.63TFLOPs | 5TFLOPs | 3.9TFLOPs |
| Memory Type | HBM2 | GDDR5X | GDDR5 | GDDR5 | GDDR5 | GDDR5 |
| Memory Capacity | 16GB | 8GB | 8GB | 6GB | 4GB | 4GB |
| Memory Clock | ? | 10Gbps GDDR5X | Unknown | 7Gbps GDDR5 | 7Gbps GDDR5 | 7Gbps |
| Memory Interface | 4096-bit | 256-bit | Unknown | 384-bit | 256-bit | 256-bit |
| Memory Bandwidth | ? | 320.32GB/s | Unknown | 336GB/s | 224GB/s | 224GB/s |
| TDP | 300W | 180W | Unknown | 250W | 165W | 148W |
| Power Connectors | ? | 1x 8-pin | Unknown | 1x 8-pin 1x 6-pin | 2x 6-pin | 2x 6-pin |
| Release Date | 4Q16-1Q17 | 5/27/2016 | 6/10/2016 | 6/01/2015 | 9/18/2014 | 9/19/2014 |
| Release Price | TBD (Several thousand) | Reference: $700 MSRP: $600 | Reference: $450 MSRP: $380 | $650 | $550 | $330 |
MSI GTX 1080 Gaming X Specs
MSI's GTX 1080 Gaming X ($720) runs the same GP104 GPU as all other GTX 1080s, resulting in the same core specs as – again – every other GTX 1080 that will hit the market. As is always the case with AIB partner cards, the primary difference to MSI's Gaming X is its cooling design and pre-overclock settings.
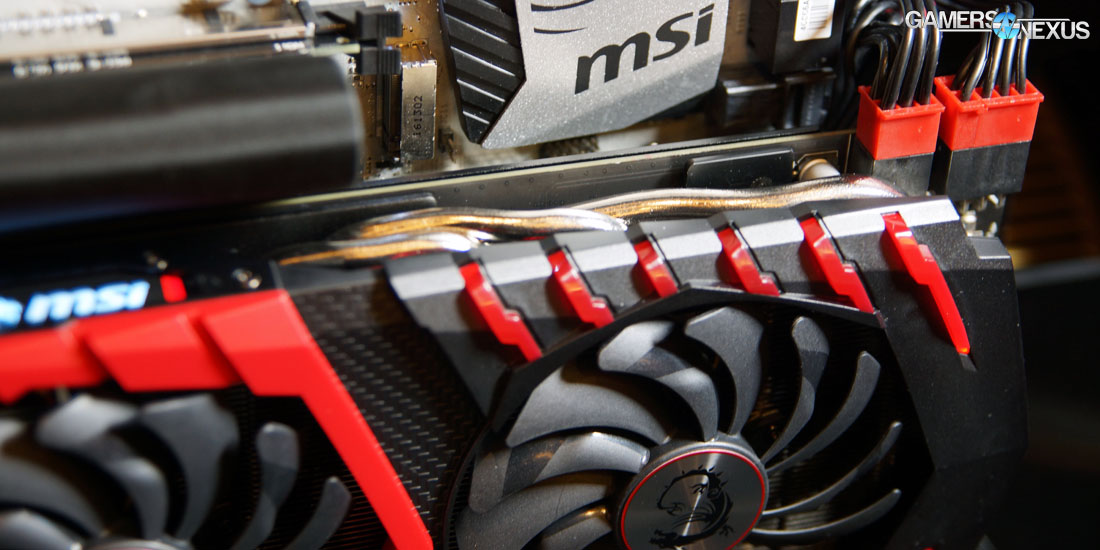
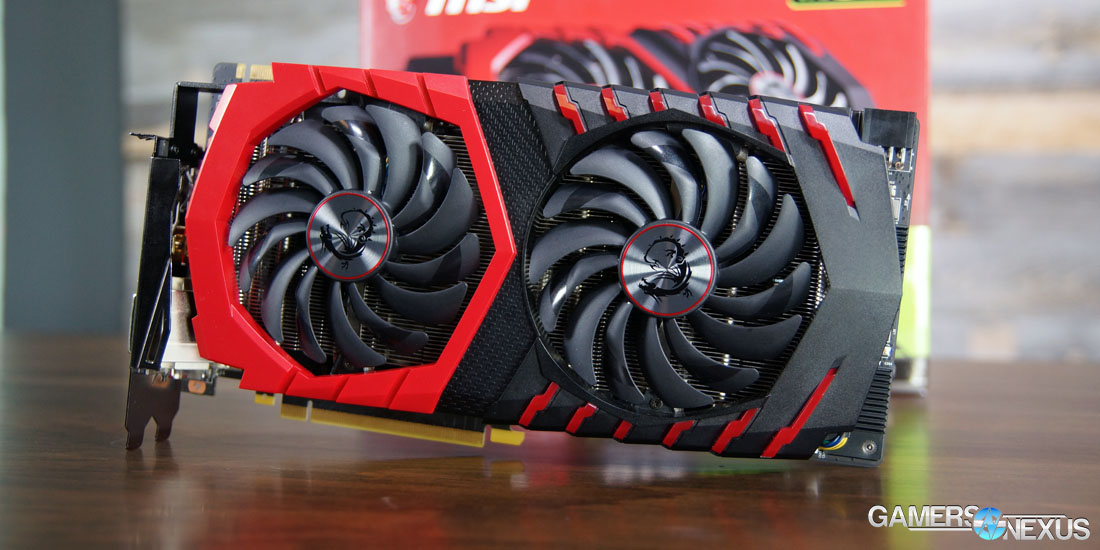
The MSI GTX 1080 Gaming X uses MSI's Twin Frozr VI cooler, the newest version of the Twin Frozr cooling solution, and institutes a few minor (but technical) changes that we explored at Computex. In this specific implementation, the Twin Frozr VI cooler uses six 8mm heatpipes that have a tapered design. The heatpipes are rounded toward the fringes of the cooler, but come to a squared end at the coldplate. Squaring the heatpipes seems to be a trend for this generation of AIB partner coolers, and widens surface area and contact with the coldplate and nearby fins. The real-world impact of this is difficult to measure without access to a tooling shop, but the science behind the concept is sound – it just may be negligible; that said, the world of cooling is often a fight over one degree Celsius, if that, so every small change is critical to these manufacturers.
EVGA's approach is a bit different. EVGA's ACX 3.0 cooler sticks with round heatpipes, but the company is filling the borders between the heatpipe and coldplate/fins with copper (or “something like that,” as we were coyly told at Computex).
Back to Twin Frozr, though.
The GTX 1080 Gaming X and GTX 1080 Gaming Z both mount an aluminum heatsink to the PWM for better OC/OV temperature control, shown at the right-edge of the card. The baseplate offers what some companies might call “thermal armor,” sitting between the sizable aluminum heatsink and the PCB. That baseplate deploys thermal pads between each of the memory modules and its metal, with MSI's “Extreme Compound X” TIM between the GPU and coldplate. MSI did not reveal the thermal conductivity of the TIM when asked.
As for the fans, MSI has upgraded to its “Torx 2.0” fan design – basically pairs of traditional fan blades and dispersion fan blades, which help trap col air and move it through the fins. The left fan is positioned above the GPU, the right above the VRM. Previous MSI coolers function the same way as the new one, using a “Zero Frozr” hardware toggle to disable fans when the GPU is below 60C. This keeps noise levels down during idle or low-load times. As an example, intentionally throttling the GPU for a game like LoL or DOTA2 would result in (easily) 60FPS framerates at nearly any resolution, while maintaining passive cooling with just the copper and alloy.
Power design is improved substantially over the reference (“Founders Edition”) card, now using a 10+1 phase VRM rather than the 5+1 phasing of the GTX 1080 FE card. MSI also cuts a custom PCB, as should be plenty obvious from the comparative heights of the FE and Gaming X cards – the Gaming X is much taller. This is actually a little annoying, but we'll talk more about the z-height later.
An additional 6-pin power header provides another 75W of power to the GPU which, if fully utilized (and that's tough to accomplish with this chip), would result in a maximum power allowance nearing 300W. MSI tells us that a custom VBIOS is on the Gaming X card and that all shipping Gaming X cards will have this custom VBIOS. We were – again, coyly, as seems the case of manufacturers – told that the VBIOS should allow marginal voltage increases past the OV limit of the FE card.
MSI ships the GTX 1080 Gaming X with its MSI Gaming App, which can switch the card between these three pre-OC values & fan curves:
OC Mode: 1847MHz Boost / 1708MHz Base
Gaming Mode: 1822MHz Boost / 1683MHz Base
Silent Mode: 1733MHz Boost / 1607MHz Base
Review Sample Notes
Our review sample shipped at its maximum pre-overclock speed, so that'd be with OC Mode pre-enabled at 1708/1847MHz base/boost. If retail cards do not ship with this speed pre-configured, downloading the MSI Gaming App and selecting “OC Mode” will put retail cards at parity with what we tested (which was configured to the OC Mode by default).
Continue to the next page for testing methodology.
Game Test Methodology
We tested using our GPU test bench, detailed in the table below. Our thanks to supporting hardware vendors for supplying some of the test components.
The latest AMD drivers (16.6.1) were used for testing. NVidia's 368.39 drivers were used for game (FPS) testing. Game settings were manually controlled for the DUT. All games were run at presets defined in their respective charts. We disable brand-supported technologies in games, like The Witcher 3's HairWorks and HBAO. All other game settings are defined in respective game benchmarks, which we publish separately from GPU reviews. Our test courses, in the event manual testing is executed, are also uploaded within that content. This allows others to replicate our results by studying our bench courses.
Windows 10-64 build 10586 was used for testing.
Each game was tested for 30 seconds in an identical scenario, then repeated three times for parity. Some games have multiple settings or APIs under test, leaving our test matrix to look something like this:
| Ashes | Talos | Tomb Raider | Division | GTA V | MLL | Mordor | BLOPS3 | Thermal | Power | Noise | |
| NVIDIA CARDS | |||||||||||
| GTX 1080 | 4K Crazy 4K High 1080 High Dx12 & Dx11 | 4K Ultra 1440p Ultra 1080p UltraVulkan & Dx11 | 4K VH 1440p VH 1080p VHDx12 & Dx11 | 4K High 1440p High 1080p High | 4K VHU 1080 VHU | 4K HH 1440p VHH 1080p VHH | 4K Ultra 1440p Ultra 1080p Ultra | 4K High 1440p High 1080p High | Yes | Yes | Yes |
| GTX 980 Ti | 4K Crazy 4K High 1080 High Dx12 & Dx11 | 4K Ultra 1440p Ultra 1080p UltraVulkan & Dx11 | 4K VH 1440p VH 1080p VHDx12 & Dx11 | 4K High 1440p High 1080p High | 4K VHU 1080 VHU | 4K HH 1440p VHH 1080p VHH | 4K Ultra 1440p Ultra 1080p Ultra | 4K High 1440p High 1080p High | Yes | Yes | Yes |
| GTX 980 | 4K Crazy 4K High 1080 High Dx12 & Dx11 | 4K Ultra 1440p Ultra 1080p UltraVulkan & Dx11 | 4K VH 1440p VH 1080p VHDx12 & Dx11 | 4K High 1440p High 1080p High | 4K VHU 1080 VHU | 4K HH 1440p VHH 1080p VHH | 4K Ultra 1440p Ultra 1080p Ultra | 4K High 1440p High 1080p High | Yes | Yes | Yes |
| AMD CARDS | |||||||||||
| AMD R9 390X | 4K Crazy 4K High 1080 High Dx12 & Dx11 | 4K Ultra 1440p Ultra 1080p UltraVulkan & Dx11 | 4K VH 1440p VH 1080p VHDx12 & Dx11 | 4K High 1440p High 1080p High | 4K VHU 1080 VHU | 4K HH 1440p VHH 1080p VHH | 4K Ultra 1440p Ultra 1080p Ultra | 4K High 1440p High 1080p High | Yes | Yes | No |
| AMD Fury X | 4K Crazy 4K High 1080 High Dx12 & Dx11 | 4K Ultra 1440p Ultra 1080p UltraVulkan & Dx11 | 4K VH 1440p VH 1080p VHDx12 & Dx11 | 4K High 1440p High 1080p High | 4K VHU 1080 VHU | 4K HH 1440p VHH 1080p VHH | 4K Ultra 1440p Ultra 1080p Ultra | 4K High 1440p High 1080p High | Yes | Yes | Yes |
Average FPS, 1% low, and 0.1% low times are measured. We do not measure maximum or minimum FPS results as we consider these numbers to be pure outliers. Instead, we take an average of the lowest 1% of results (1% low) to show real-world, noticeable dips; we then take an average of the lowest 0.1% of results for severe spikes.
| GN Test Bench 2015 | Name | Courtesy Of | Cost |
| Video Card | This is what we're testing! | - | - |
| CPU | Intel i7-5930K CPU | iBUYPOWER | $580 |
| Memory | Corsair Dominator 32GB 3200MHz | Corsair | $210 |
| Motherboard | EVGA X99 Classified | GamersNexus | $365 |
| Power Supply | NZXT 1200W HALE90 V2 | NZXT | $300 |
| SSD | HyperX Savage SSD | Kingston Tech. | $130 |
| Case | Top Deck Tech Station | GamersNexus | $250 |
| CPU Cooler | NZXT Kraken X41 CLC | NZXT | $110 |
For Dx12 and Vulkan API testing, we use built-in benchmark tools and rely upon log generation for our metrics. That data is reported at the engine level.
Video Cards Tested
- MSI GTX 1080 Gaming X ($720)
- NVIDIA GTX 1080 Founders Edition ($700)
- NVIDIA GTX 980 Ti Reference ($650)
- NVIDIA GTX 980 Reference ($460)
- NVIDIA GTX 980 2x SLI Reference ($920)
- AMD R9 Fury X 4GB HBM ($630)
- AMD MSI R9 390X 8GB ($460)
Thermal Test Methodology
We strongly believe that our thermal testing methodology is the best on this side of the tech-media industry. We've validated our testing methodology with thermal chambers and have proven near-perfect accuracy of results.
Conducting thermal tests requires careful measurement of temperatures in the surrounding environment. We control for ambient by constantly measuring temperatures with K-Type thermocouples and infrared readers. We then produce charts using a Delta T(emperature) over Ambient value. This value subtracts the thermo-logged ambient value from the measured diode temperatures, producing a delta report of thermals. AIDA64 is used for logging thermals of silicon components, including the GPU diode. We additionally log core utilization and frequencies to ensure all components are firing as expected. Voltage levels are measured in addition to fan speeds, frequencies, and thermals. GPU-Z is deployed for redundancy and validation against AIDA64.
All open bench fans are configured to their maximum speed and connected straight to the PSU. This ensures minimal variance when testing, as automatically controlled fan speeds will reduce reliability of benchmarking. The CPU fan is set to use a custom fan curve that was devised in-house after a series of testing. We use a custom-built open air bench that mounts the CPU radiator out of the way of the airflow channels influencing the GPU, so the CPU heat is dumped where it will have no measurable impact on GPU temperatures.
We use an AMPROBE multi-diode thermocouple reader to log ambient actively. This ambient measurement is used to monitor fluctuations and is subtracted from absolute GPU diode readings to produce a delta value. For these tests, we configured the thermocouple reader's logging interval to 1s, matching the logging interval of GPU-Z and AIDA64. Data is calculated using a custom, in-house spreadsheet and software solution.
Endurance tests are conducted for new architectures or devices of particular interest, like the GTX 1080, R9 Fury X, or GTX 980 Ti Hybrid from EVGA. These endurance tests report temperature versus frequency (sometimes versus FPS), providing a look at how cards interact in real-world gaming scenarios over extended periods of time. Because benchmarks do not inherently burn-in a card for a reasonable play period, we use this test method as a net to isolate and discover issues of thermal throttling or frequency tolerance to temperature.
Our test starts with a two-minute idle period to gauge non-gaming performance. A script automatically triggers the beginning of a GPU-intensive benchmark running MSI Kombustor – Titan Lakes for 1080s. Because we use an in-house script, we are able to perfectly execute and align our tests between passes.
Noise Testing Methodology
Our noise testing methodology is new and still being revised, but has been kept consistent across all tests contained herein. We test noise in a real-world environment and do not presently use an anechoic chamber. The results align with what consumers will encounter in their own rooms.
We use a REED logging dB meter mounted to a tripod, whose mic is positioned 20” from the face of the GPU (mounted in an open bench). The REED meter is approximately 6” above the bench. All open bench fans are disabled. The Kraken X41 CPU cooling fan is configured to its “silent” mode, minimizing its noise output to be effectively imperceptible.
A noise floor measurement is taken prior to each test's execution to determine ambient without any systems running in the room. We then take an idle measurement (GPU & CPU at idle). Our noise floor has a fluctuation of approximately +/-0.6dB.
Noise levels are logarithmic, and are therefore not as simple to perform delta calculations as thermals or framerates. Noise percent differences are calculated using dB=20*log(V2/V1) (where V is amplitude). You cannot perform a simple percent difference calculation to determine the delta. For an example, a 10dB range (50dB vs. 40dB) is not equal to a 22% delta.
After the noise floor is determined, we log idle fan dB, 50% speed dB, and 100% speed dB (configured in Afterburner). We also measure auto fan dB at an identical stepping for every test; we do this by running Kombustor for exactly 5 minutes prior to beginning dB logging, which is useful for fans which use two push fans. Some dual-push fan cards will only trigger the second fan if the VRM is under load.
Power Testing Methodology
Power consumption is measured at the system level. You can read a full power consumption guide and watt requirements here. When reading power consumption charts, do not read them as a GPU-specific requirements – this is a system-level power draw.
Power draw is measured during the thermal burn-in. We use a logging wall meter that sits between the PSU and the system and logs power consumption over the test period. We select the final 200s of data and average the data points.
We use a different bench platform for power measurements; see below:
| GN Z97 Bench | Name | Courtesy Of | Cost |
| Video Card | This is what we're measuring! | - | - |
| CPU | Intel i7-4790K CPU | CyberPower | $340 |
| Memory | 32GB 2133MHz HyperX Savage RAM | Kingston Tech. | $300 |
| Motherboard | Gigabyte Z97X Gaming G1 | GamersNexus | $285 |
| Power Supply | Enermax Platimax 1350W | Enermax | $272 |
| SSD | HyperX Predator PCI-e SSD Samsung 850 Pro 1TB | Kingston Tech. Samsung | |
| Case | Top Deck Tech Station | GamersNexus | $250 |
| CPU Cooler | Be Quiet! Dark Rock 3 | Be Quiet! | ~$60 |
MSI GTX 1080 Gaming X Thermal Benchmark vs. Founders Edition
These thermal benchmarks primarily seek to compare MSI's GTX 1080 Gaming X video card versus the GTX 1080 Founders Edition card, using the reference heatsink with blower fan. Reference designs are almost guaranteed to run hotter than AIB partner cards, but the blower fan does have its place: In AIB partner models (like MSI's lowest-end, $600 GTX 1080 Gaming), it's cheaper to implement, and blower fans are generally better suited for certain small form-factor enclosures where air needs to be removed from the enclosure.
Blower fans push air into the heatsink and allow it to dissipate into the greater case, later evacuated by system fans (with some escaping through the expansion slot); generally, the blower fan is advisable for SFF builds where heat easily builds-up and causes other components to warm-up.
This first chart shows the peak GPU temperatures at load and idle:
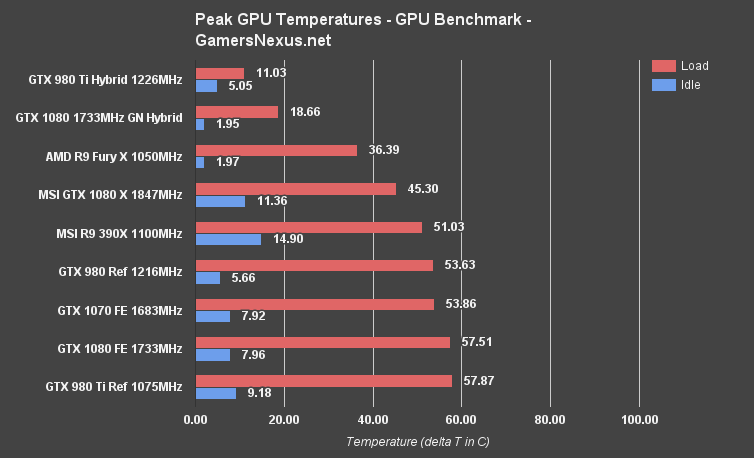
We often refer to these charts as “equilibrium” charts, loosely used to refer to the point at which the average temperature ceases fluctuation and rests at its peak. All values are reported as Delta T over Ambient, so we're subtracting the actively monitored ambient second-to-second from the absolute results.
The MSI GTX 1080 Gaming X runs at 45.3C delta T over ambient (load), which is a respectable 23.75% performance improvement over the Founders Edition card. Idle, MSI's Gaming X flavor of the GTX 1080 runs at 11.36C, which is a marginal gain over the FE 7.96C – that gain, however, is accompanied by a noise reduction. MSI's Twin Frozr cooler spins-down its fans to 0RPM when idle, effectively creating 0 additional system noise. That aluminum and copper are sufficient enough to cool the idle GPU.
Against liquid solutions, the MSI GTX 1080 Gaming X is approximately 83% different (warmer) than our DIY GN Hybrid solution, which places a liquid cooling block on the GPU proper. This is opposed to the 102% warmer output of the FE card vs. the DIY liquid card.
MSI's air cooler performs impressively well overall. The MSI GTX 1080 Gaming X and Twin Frozr VI combination lands the new card at the top of our bench for air cooling performance. The Gaming X is beaten only by liquid cooled cards (Fury X, GN Hybrid, 980 Ti Hybrid).
MSI GTX 1080 Gaming X Thermals Over Time
This chart presents the thermal data slightly differently, pitting thermals against time for the same test. The data used here is the same as the data that created the above peak thermal AVG chart, but stretched over time:
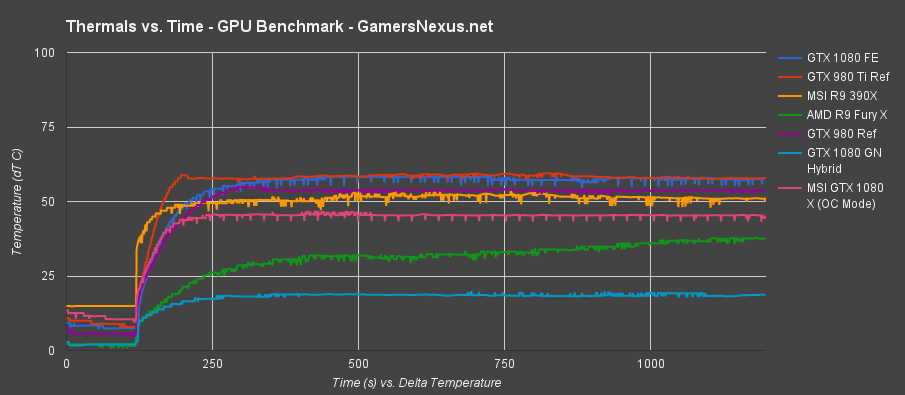
As we've said before, our in-house test program executes the test at precisely the same second each iteration. Because of this, we see all cards start ramping their thermals at the same time (and with the same load level) for each test. The MSI GTX 1080 Gaming X in OC mode has the usual ticks up-and-down as fans govern their speed, managing to sit below 50C (delta) for the entirety of the test.
MSI GTX 1080 Gaming X Noise Levels vs. Founders Edition
The next chart was first introduced in our GTX 1080 FE review (P3), and is still being refined in its data presentation. Noise testing uses the methodology defined on the previous page.
Quick reminder: dB is logarithmic, so subtracting two values does not create a delta. It is more complex than usual percent difference / subtraction methods to compare values.
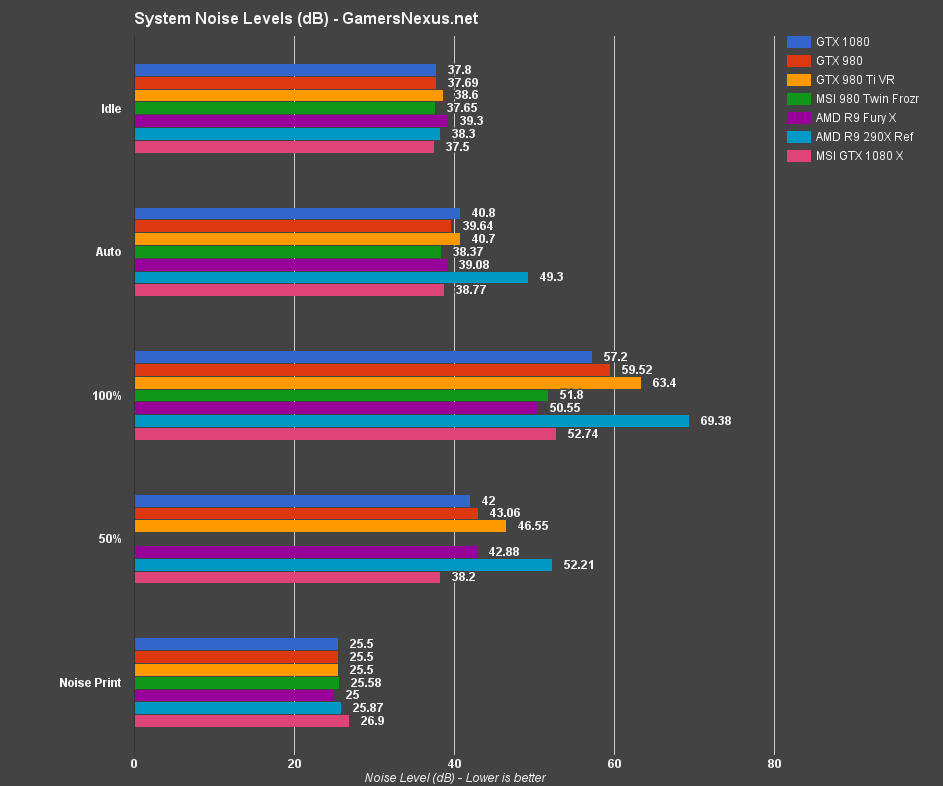
Idle, system noise levels are more-or-less identical. Because the fan spins at 0RPM for MSI's Twin Frozr cards, system noise levels at idle are going to be more bound by the PSU and CPU cooler fans than VGA fans.
As we move to the “Auto” test, it's clear that MSI's GTX 1080 Gaming X performs about equal with the previous MSI Twin Frozr solution (on the 980). The difference between the Twin Frozr VI 1080 and the FE card is measurable, but more-or-less imperceptible.
100% shows the full load noise generation of the card. It's rare for cards to actually hit 100% fan speed, as fan curves generally force VGA coolers to stick close to 50% and sacrifice clock-rate instead. Forced to 100%, the R9 290X runs nearly 70dB (louder than conversational speech, which we've measured to be loosely around 65dB, depending on speaker). The GTX 1080 FE runs at 57.2dB, with the MSI GTX 1080 running at a noticeably and measurably quieter 52.74dB.
At 50% load, we see the MSI 1080 Gaming X running only marginally above its idle measurement, sitting at 38.2dB – a reasonable improvement over the 42dB of the FE card.
Continue to the next page for Dx12 & Vulkan vs. Dx11 benchmarks.
MSI GTX 1080 FPS Benchmarks – Dx12, Vulkan vs. Dx11
This page initiates our game benchmarking for the GTX 1080 Gaming X. We do not include any Dx11-only games on this page, but we do provide comparative data between Dx11, Dx12, and Vulkan (where present) for tested games. Some of this data is presented as a percent change value or other unique values, like ms latency. These charts provide insight as to async compute performance and overall acceptance of new APIs by the hardware.
Comparative Dx12 vs. Dx11 FPS in Ashes of Singularity – MSI 1080 X vs. FE
Ashes of the Singularity is still one of the best-built Dx12 games. Ashes has supported Dx12 ground-up, which means that it's more than a mere wrapper. We've eliminated Rise of the Tomb Raider from our bench as it produces poor Dx12 results and is a sub-optimal execution of the new API.
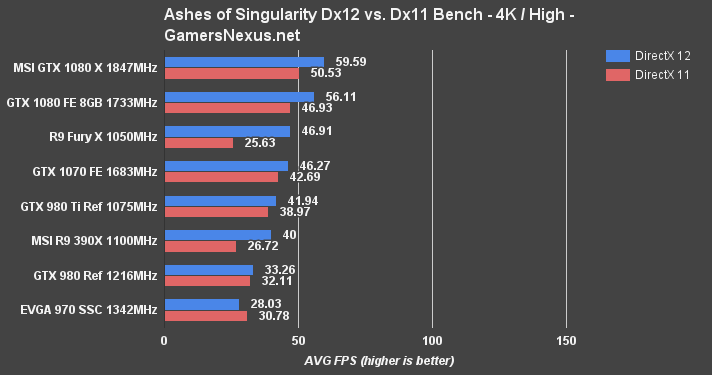
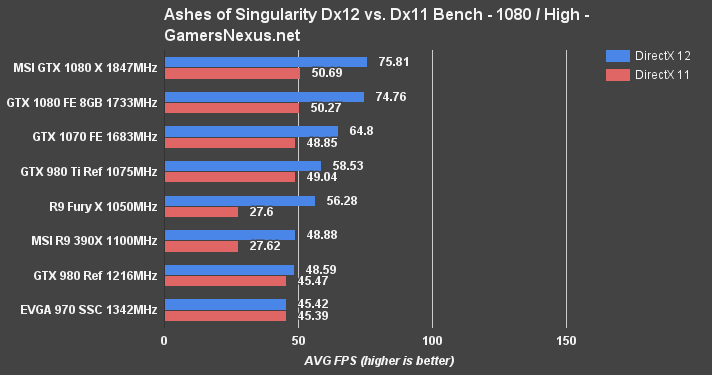
Ashes shows mostly identical performance between the GTX 1080 FE and GTX 1080 Gaming X. The 1080p High test plants the MSI card about 1FPS ahead of the FE card (for Dx12), but is only 0.5FPS different with Dx11. At 4K / High, there's a 6.02% FPS gain with the Gaming X – but it's still in that range of “probably won't notice the extra frames.”
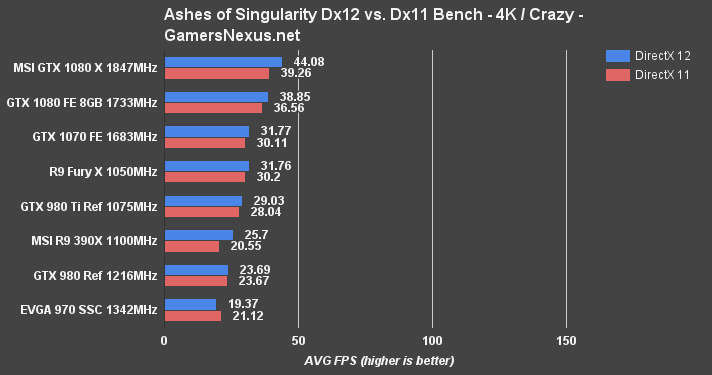
4K Crazy shows greater deltas at 12.6% for Dx12, FE versus Gaming X, and 7.12% for Dx11. This is a result of the heavier clock-rate dependency and GPU loading with this configuration.
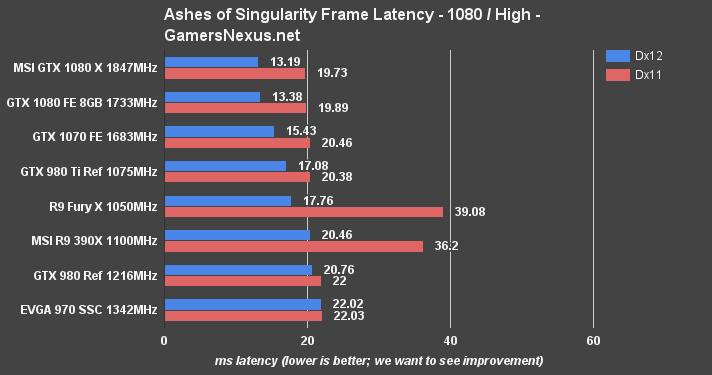
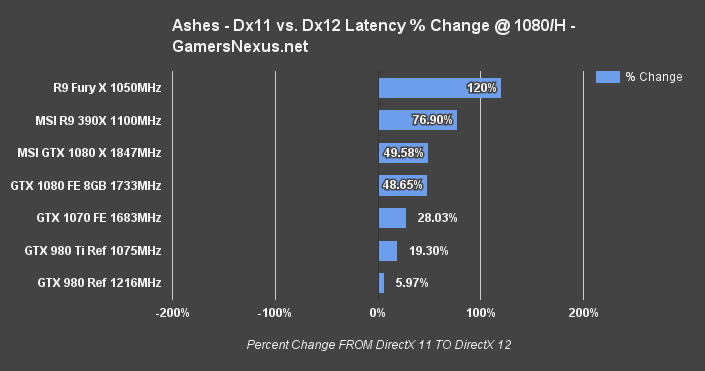
Frametimes versus FE are also similar. At 1080p / High, which is intensive during the Ashes benchmark, we see a frame latency change of +48.65% for the FE card (Dx11 to Dx12 boost) versus +49.58% for the Gaming X card.
Comparative Vulkan vs. Dx11 in Talos Principle – MSI 1080 X vs. Reference
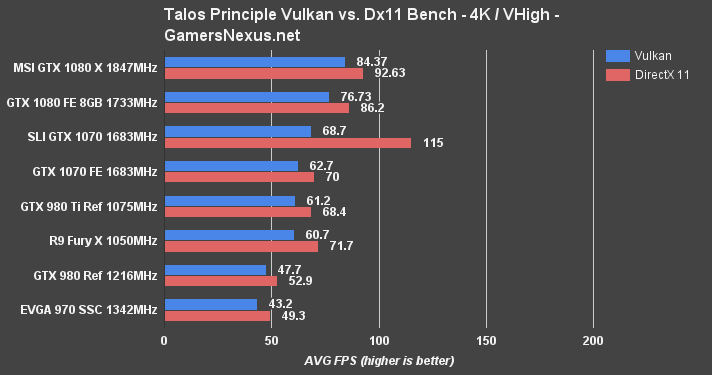
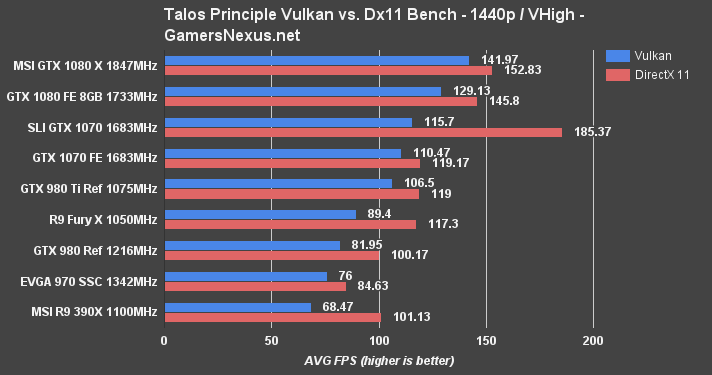
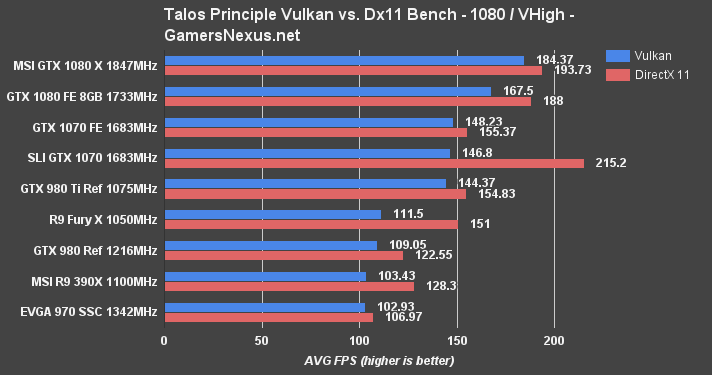
Vulkan is still improving in its Talos Principle implementation. CroTeam has publicly stated that Vulkan presently under-performs against Dx11, but should eventually achieve parity with (and pass) Dx11 performance.
The MSI GTX 1080 Gaming X sees reasonable gains over the 1080 FE (+9.48%) in Vulkan and Dx11 (+7.19%) when testing at 4K. At 1440p, we see similar gains of +9.47% (FE to Gaming X, Vulkan) and +4.7% (FE to Gaming X, Dx11).
Continue to the next page for the more familiar Dx11 benchmarks (& frametime analysis).
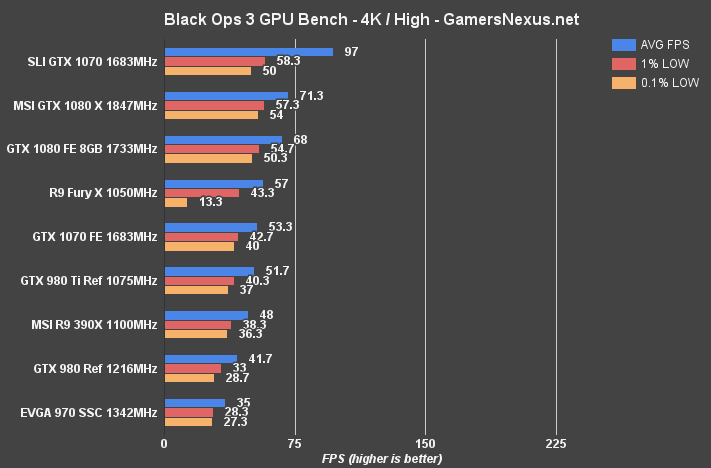
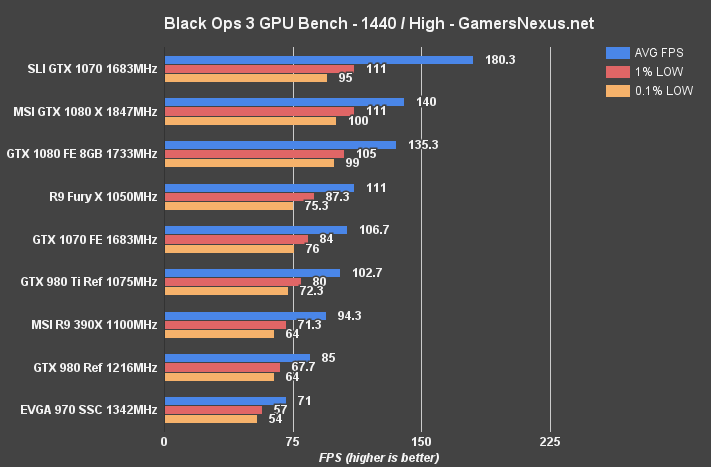
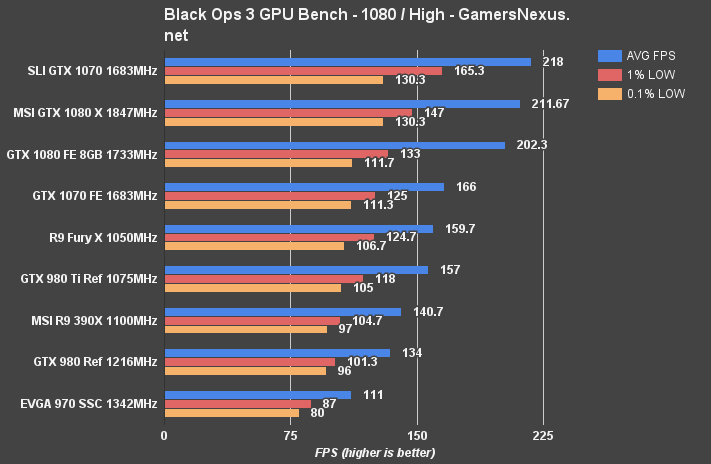
Black Ops 3 Benchmark – MSI 1080 X vs. 1080 FE, 1070 SLI, Fury X
Black Ops III is one of the best-optimized titles we're currently working with, regardless of general opinions of Call of Duty. We've studied the game's graphics and have a solid understanding of its performance. Activision has already pushed its optimization patches and seems to have ceased modifications to the title's performance, which is also good for benchmarking.
Black Ops III posts the 1080 Gaming X at 211 FPS average for 1080p high settings, a 9 FPS gain over the FE card – which is about 4.5%. 1440p carries that gain with a 140 vs. 135.3FPS disparity, or about 3.4% delta. 4K has us at 71.3FPS vs 68FPS, or 4.7% delta.
Mirror's Edge Catalyst Benchmark – MSI 1080 X vs. 1070, 1070 SLI, Fury X
Mirror's Edge Catalyst was tested and benchmarked fully on our GPU suite after the GTX 1080 launched. We did not test Catalyst with the Founders Edition card, but have included the results (with the MSI Gaming X card) anyway.
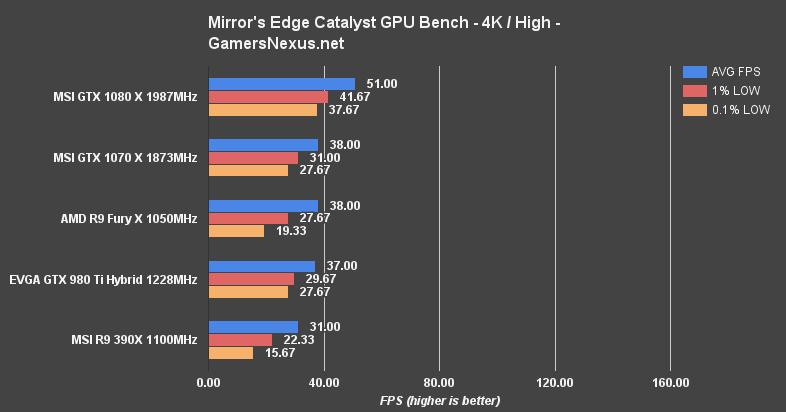
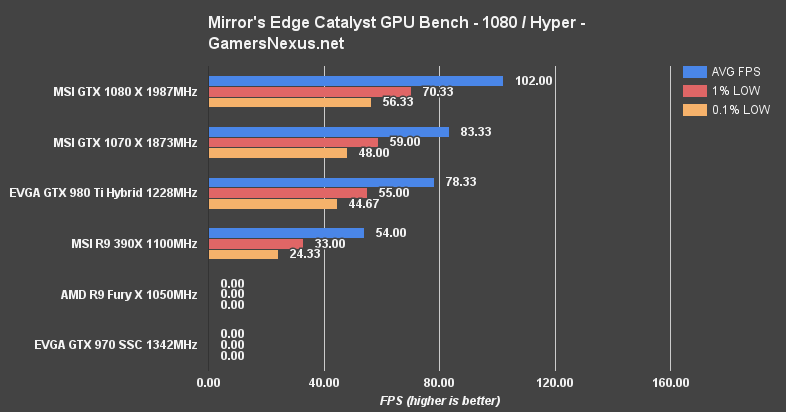
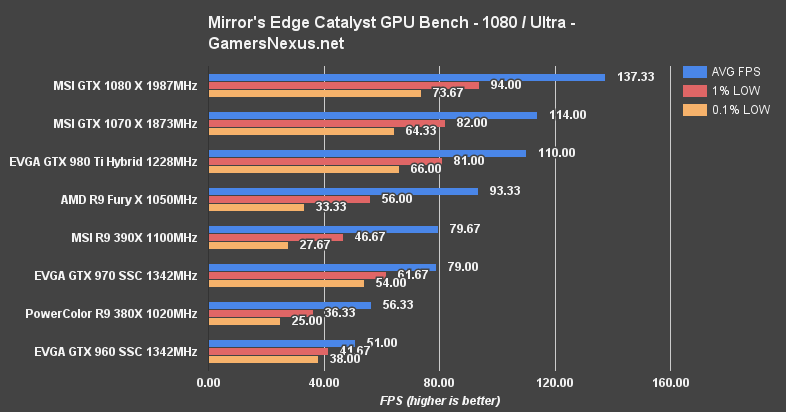
MSI's GTX 1080 Gaming X boosts to its max with Mirror's Edge Catalyst, and is able to produce 51FPS AVG – a 29.2% gain over the MSI GTX 1070 Gaming X. Against last-gen, the GTX 1080 Gaming X runs 31.82% faster (vs. GTX 980 Ti Hybrid). That's not ideal for playability, but settings reductions to High-Medium would allow for 60FPS at 4K.
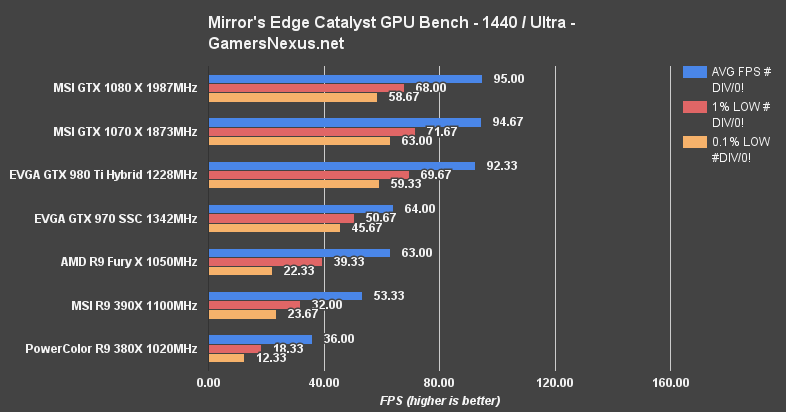
With 1440p and Ultra settings, Mirror's Edge ran at 95FPS AVG on the GTX 1080 Gaming X, running into a CPU or other system bottleneck (hence the similar results across the cards).
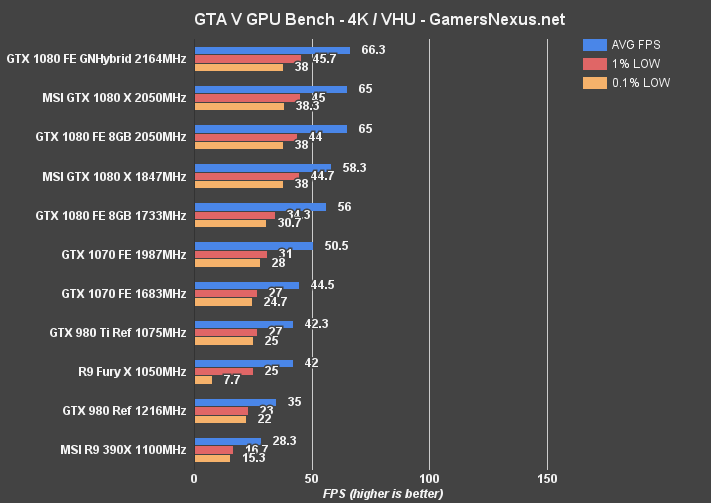
GTA V Benchmark – MSI 1080 X vs. 1080 FE, 1070, 390X, More
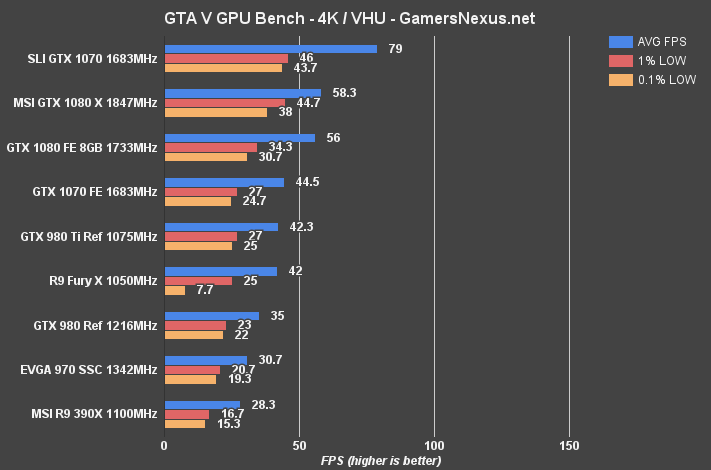
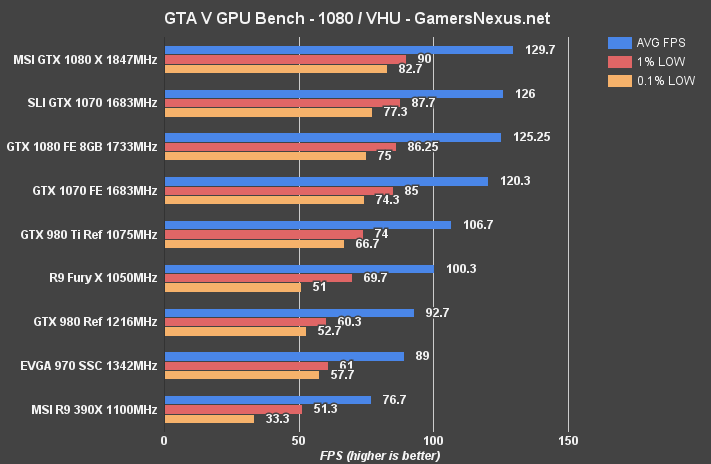
GTA V shows minimal FPS gain with the MSI Gaming X flavor of the GTX 1080 when playing at 4K. We're seeing a gap of 2FPS, or 4.02% with the 4K / Very High & Ultra configuration. At 1080p, that translates to a 3.5% delta. Certainly not very impressive, but still – we're already well ahead of the reference card in thermals and are gaining a slight performance boost from the pre-OC. The gap isn't all that noticeable, but it's not bad, either.
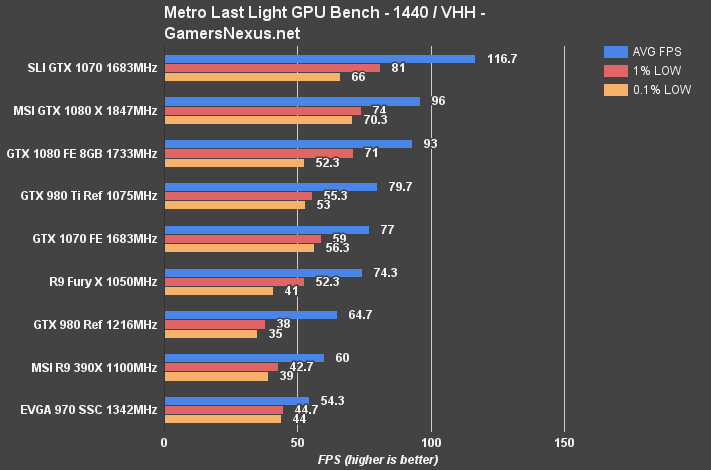
Metro: Last Light Benchmark – MSI 1080 Gaming X vs. 1080 Founders Edition
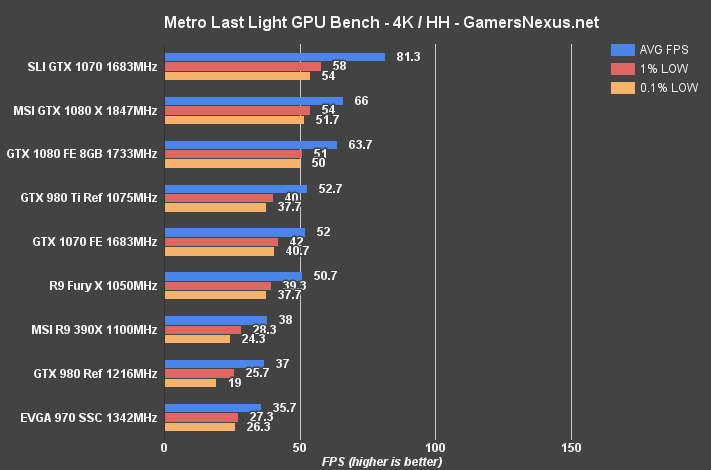
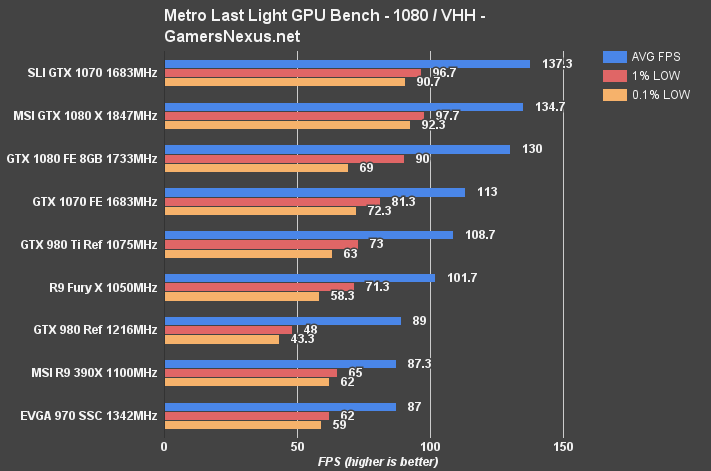
MSI's GTX 1080 Gaming X is the fastest performer on the bench for a lot of these games, and Metro is included in that metric. Sure, it's a few FPS different than the FE card – but that's often all that separates these AIB partners when speaking to non-user OCs. Only the 1070s in SLI outperform the 1080 for 4K gaming in Metro, producing a gap of 20.77%. Between the FE and Gaming X cards, the performance gap is just 3.55%.
At 1440p, we see a ~5FPS difference (134.7FPS vs. 130FPS) between the FE and Gaming X averages, but the Gaming X has significantly stronger 0.1% low frametimes. This is somewhat of a trend with the AIB partner cards versus our original (stock) FE card, likely triggered by temperature or other limiters.
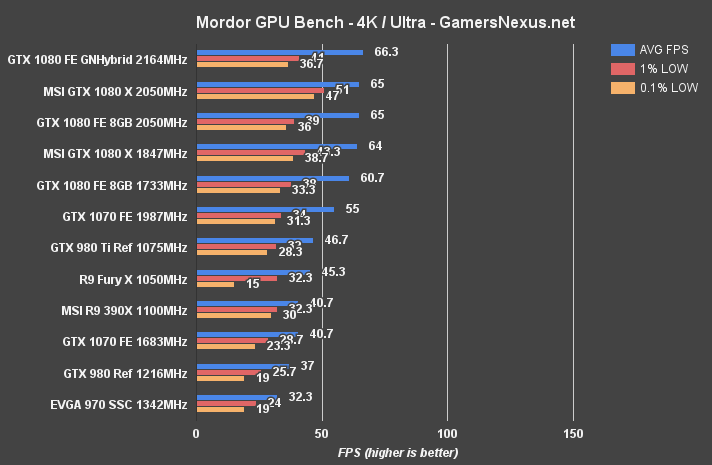
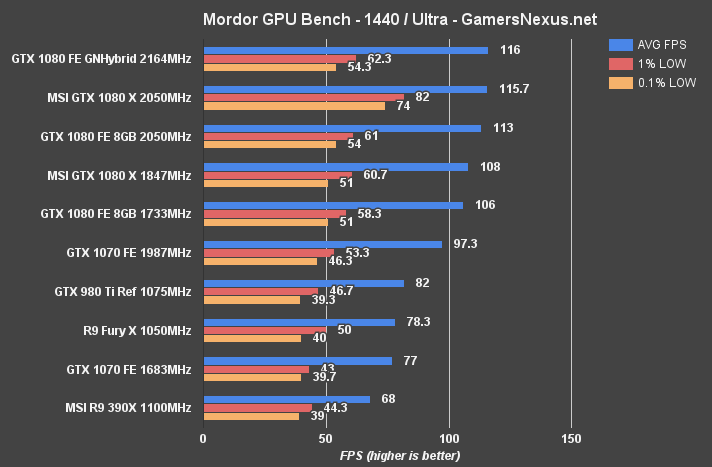
Shadow of Mordor Benchmark – MSI 1080 X vs. 1080 FE, 1070, Fury X
Shadow of Mordor was one of the most graphics-intensive games when it came out, and still remains heavy on VRAM consumption toward higher resolutions.
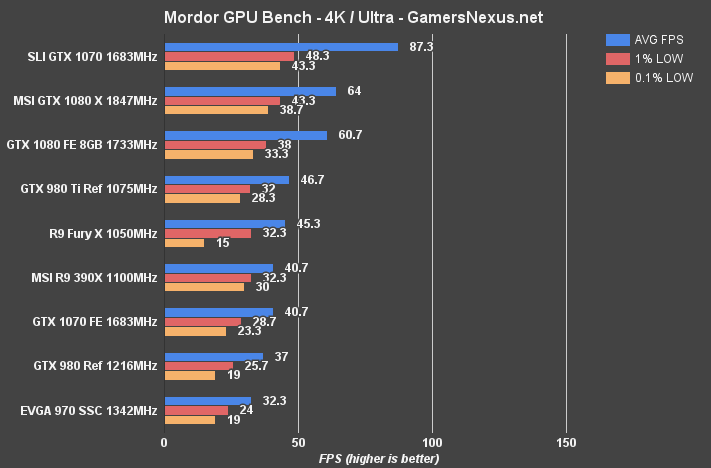
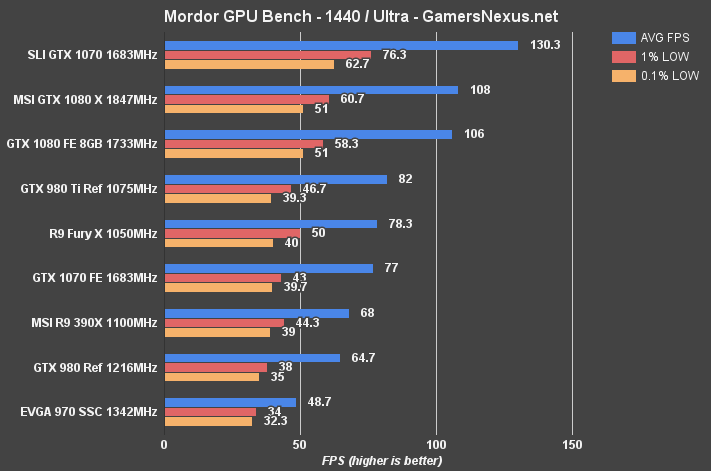
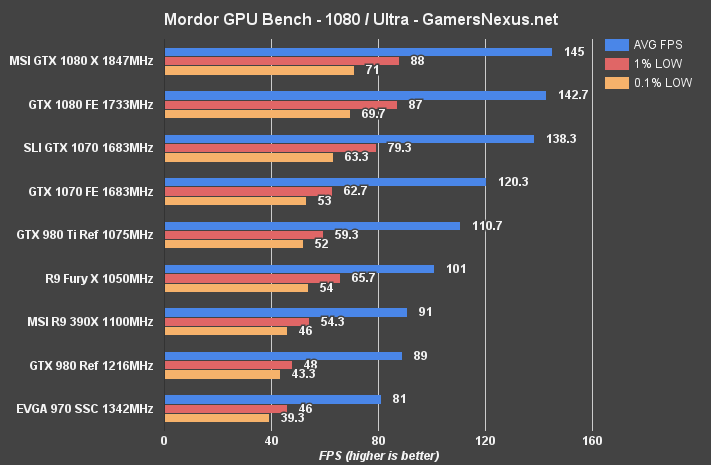
Shadow of Mordor at 1440p puts us at 108FPS with the pre-OC MSI Gaming X card, a gain of 1.87% over the FE card. At 4K, we're seeing a couple FPS gained that amounts to about a 4% jaunt. This isn't all that impressive, but it's about expected for what is effectively a factory overclocked GTX 1080.
How to Overclock the GTX 1080, Pascal GP104, & GTX 1070
From our 1070 review:
“Overclocking has changed with Pascal. It's gotten more advanced – but not more complex. The core functions of overclocking remain the same; we're still using manual stepping and sliders to achieve high, sustained overclocks, but a new auto OC tool (currently only with EVGA Precision) makes limit finding easier. In theory, anyway. We couldn't get it to work with our GTX 1080, but it seems that EVGA Precision's auto-OC (called “ScanOC”) is now functioning with the latest press drivers and installation package.
But we decided to keep going the manual route – it's just better for testing.”
And from our 1080 review:
“GTX 1080 overclocking is revised heavily from previous generations. The GTX 1080 and GP104 move nVidia from GPU Boost 2.0 to GPU Boost 3.0. GPU Boost 3.0 and supporting applications from AIB partners will allow for frequency-voltage curve creation that fine-tunes voltages against various frequencies. Rather than functioning on a single slider for frequency, applications like Precision and Afterburner will now create a curve that fits your card's particular silicon.
Anyone who's overclocked knows that a high frequency may be sustainable in most games or for long stretches of time, but that some specific applications or use cases will crash the drivers resultant of the overclock. The obvious solution is to step-down the OC globally until something is stable across the board, but then we're losing OC room in the use cases that didn't originally trigger faults.
GPU Boost 3.0 supports scanners, which figure out the optimal frequency for each individual voltage point. If a particular voltage point is less stable, the frequency offset can be adjusted by the tool or by manual control. In EVGA Precision, a ScanOC tool finds the optimal setup and provides a baseline that allows enthusiasts to further tune their setup. Vendors can determine parameters for voltage-frequency curve determination by the OC scanner.”
MSI GTX 1080 Gaming X Overclocking Results
Here is the stepped progression for our overclocking attempts with the MSI GTX 1080 Gaming X:
| Core Clock (MHz) | Core Offset (MHz) | Mem CLK (MHz) | Mem Offset (MHz) | Power Target (%) | vCore Offset (%) | 5m Test | 60m Burn-in |
| 1999.5 | 0 | 5054 | 0 | 100 | 0 | P | P |
| 2012 | 50 | 5054 | 0 | 107 | 0 | P | |
| 2025 | 70 | 5054 | 0 | 107 | 0 | P | |
| 2037.5 | 75 | 5054 | 0 | 107 | 0 | P | |
| 2062.5 | 115 | 5054 | 0 | 107 | 0 | P | |
| 2075.5 | 130 | 5054 | 0 | 107 | 0 | F | |
| 2062.5 | 115 | 5054 | 0 | 107 | 25 | P | |
| 2075.5 | 130 | 5054 | 0 | 107 | 25 | P | F |
| 2075.5 | 130 | 5054 | 0 | 107 | 30 | P | F |
| 2062.5 | 115 | 5454 | 400 | 107 | 30 | P | |
| 2062.5 | 115 | 5557 | 500 | 107 | 30 | F Black Flickering | |
| 2062.5 | 115 | 5557 | 500 | 107 | 40 Max vCore 1.062 | F Black Flickering | |
| 2062.5 | 115 | 5557 | 500 | 107 | 50 Max vCore 1.062 | F Driver Crash | |
| 2088 | 120 | 5454 | 400 | 107 | 50 | F | |
| 2075.5 | 115 | 5454 | 400 | 107 | 50 | P | F |
| 2062.5 | 105 | 5454 | 400 | 107 | 40 | P | F |
| 2050 | 90 | 2301 | 250 | 107 | 40 | P | P |
| 2050 | 90 | 5454 | 400 | 107 | 40 | P | P |
Through manual overclocking with Afterburner, we stepped completely through the MSI GTX 1080 Gaming X's range and found that it settled firmly at 2050MHz core clock and 5454MHz memory clock, nearly an effective 11GHz. The power target maxes out at 107% and vCore stops gaining at 1.062V.
Because we use real-world applications for our overclock validation, these numbers are representative of what you would see (on similar hardware, silicon lottery notwithstanding) in actual overclocking. Overclocks exceeding 2100MHz on Pascal seem to have issues validating in endurance tests (as we've shown) or with non-synthetic applications. It is easy to exceed 2100MHz with Furmark, for instance, as Furmark only loads the GPU in one very specific way – but fluctuating loads / demand of gaming will destabilize those higher OCs.
DIY GTX 1080 GN Hybrid Overclocking Results
Here are the results from our GN Hybrid overclocking:
| Core Clock (MHz) | Core Offset (MHz) | Mem CLK (MHz) | Mem Offset (MHz) | Power Target (%) | 5m Test | 60m Burn-in |
| ~2050-2072 | 225 | 5005 | 0 | 120 | Pass | - |
| ~2100-2138 | 250 | 5005 | 0 | 120 | Pass | - |
| 2164 | 275 | 5005 | 0 | 120 | Pass | - |
| 2164 | 275 | 5602 | 600 | 120 | Pass | Pass |
| 2189 | 300 | 5602 | 600 | 120 | Fail | - |
| 2189 | 300 | 4489 | -500 | 120 | Pass | Pass (But struggled – so would probably fail with longer burn-in; failed immediately when gaming / not synthetic load) |
| 2202 | 325 | 4489 | -500 | 120 | Pass | Fail |
| 2164 | 275 | 5602 | 600 | 120 | Pass | Pass |
Read more about these here.
GTX 1080 Founders Edition Overclocking Results
And the results from the FE:
| Core Clock (MHz) | Core Offset (MHz) | Mem CLK (MHz) | Mem Offset (MHz) | Power Target (%) | 5m Test | 60m Burn-in |
| 1733 | 0 | 5005 | 0 | 100 | Pass | Pass |
| 1880 | 150 | 5305 | 300 | 120 | Pass | - |
| 1974 | 171 | 5305 | 300 | 120 | Pass | - |
| 1987 | 190 | 5305 | 300 | 120 | Pass | - |
| 2025 | 210 | 5305 | 300 | 120 | Pass | - |
| 2050 | 230 | 5305 | 300 | 120 | Fail Driver Crash | |
| ~2030 | 220 | 5400 | 400 | 120 | Pass | Pass |
MSI GTX 1080 Gaming X Overclocked FPS Benchmark
Results charts below:
We're seeing a few percentage points of difference at best. Not phenomenal, but the clock-rate is already high with the GP104.
Overclocking wasn't all that exciting. Sure, it was about 20-25MHz higher than our Founders Edition card, but in no way is that worth another $20. What is worth the $20, though, is the substantially improved cooling solution and slightly improved noise performance. Unfortunately, I just don't think the GTX 1080 is worth $700 at this time, and it's certainly not worth $720 – even with the cooler improvements. We'd like to see GTX 1080 prices fall to their MSRP range as advertised, as the few available options are presently north of $800 to $1000.
But let's talk about the Gaming X.
Thermally, we saw about a 25% improvement in temperatures. That's a large decrease in GPU diode temperature, and ensures that our overclock remains stable over time, something which wasn't always true for the Founders Edition. Temperatures are kept well below the 82C throttle point that the reference card hits.
The Gaming X only overclocks marginally better than the reference design. It seems Pascal has some limitations here. FPS sees anywhere from a 1.8% to 12% performance improvement with the pre-OC, depending on how GPU and clock-bound the game is. Generally, we see FPS performance gains around 5% max.
It's much better than the reference design, that's for sure. The card is cooler – and that was a major point of failure for the FE, despite being an overall good chip. Our Best of Bench award is an objective badge given to cards which excel and top a bench in one way or another. Because MSI's GTX 1080 Gaming X has topped the air-cooled video cards on the thermal charts, the card has received our Best of Bench award for VGA thermals (when air cooled, anyway -- which is most cards). We'll see how that holds together as we get other 1080s on the bench.
Unfortunately, overclocking appears limited on the 1080s to the point that significantly improved power designs don't produce immediately visible gains in max clock-rate, but the MSI card does run more stable than the FE card when overclocked.
The Gaming X is too tall and eliminates itself from inclusion with several mini-ITX builds. This is something we'd like to see MSI improve on, and something they could improve on. But it is a minor complaint.
We'd suggest waiting to see how the rest of the market rattles-out right now. Prices are still stabilizing and vendors are just getting their cards out there. Keep a close eye on the official Hybrid launch, too, as we think liquid has some pretty serious implications for this generation of flagship. If EVGA can keep it under $700, it'll be tough competition.
The GTX 1080 Gaming X is a fine card. It's OK. The cooling performance is significantly better, gaming performance is slightly better, and quality overall is decent. But it's not an insane overclocker, so don't buy it for that reason. And the price should be lower, we think. The $720 could be justifiable if this thing hit in excess of 2100MHz while gaming, but it just doesn't. At least, not our model. We'd like to see GTX 1080 prices fall to the more reasonable $600-$700 range, rather than the $700+ range where they rest now.
If you enjoyed this content, please consider backing us on Patreon.
Editorial, Test Lead: Steve “Lelldorianx” Burke
Sr. Test Technician: Mike “Budekai?” Gaglione
FPS Test Technician: Andie “Draguelian” Burke
dB Test Technician: Patrick “Mocalcium” Stone
Video Producer: Andrew “ColossalCake” Coleman